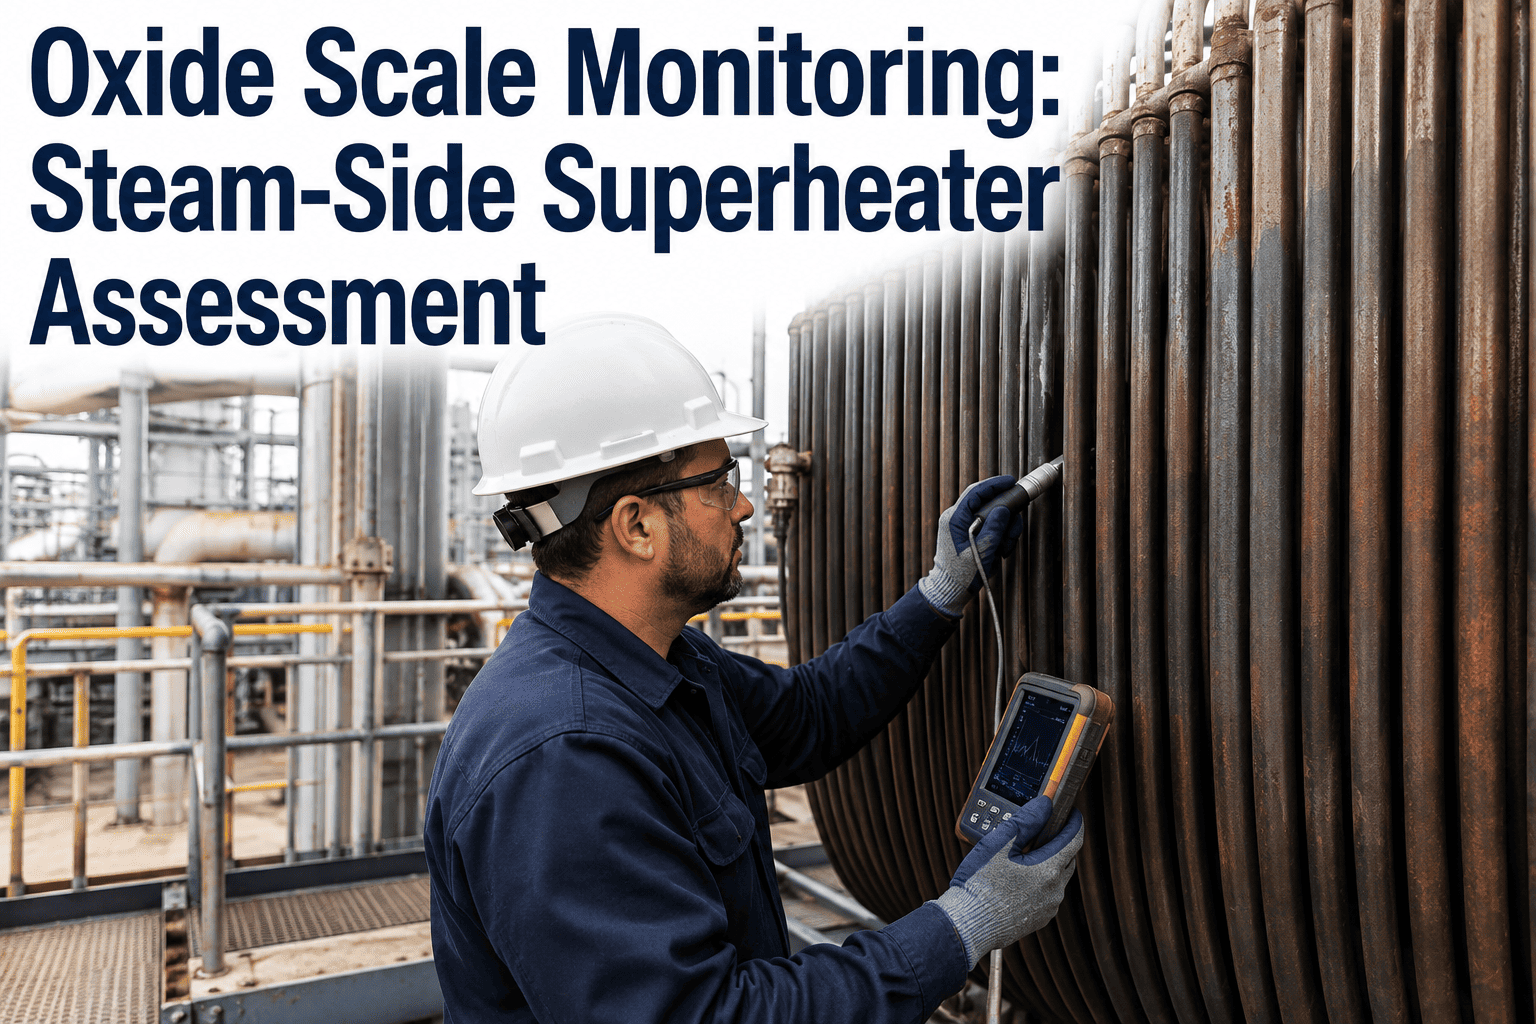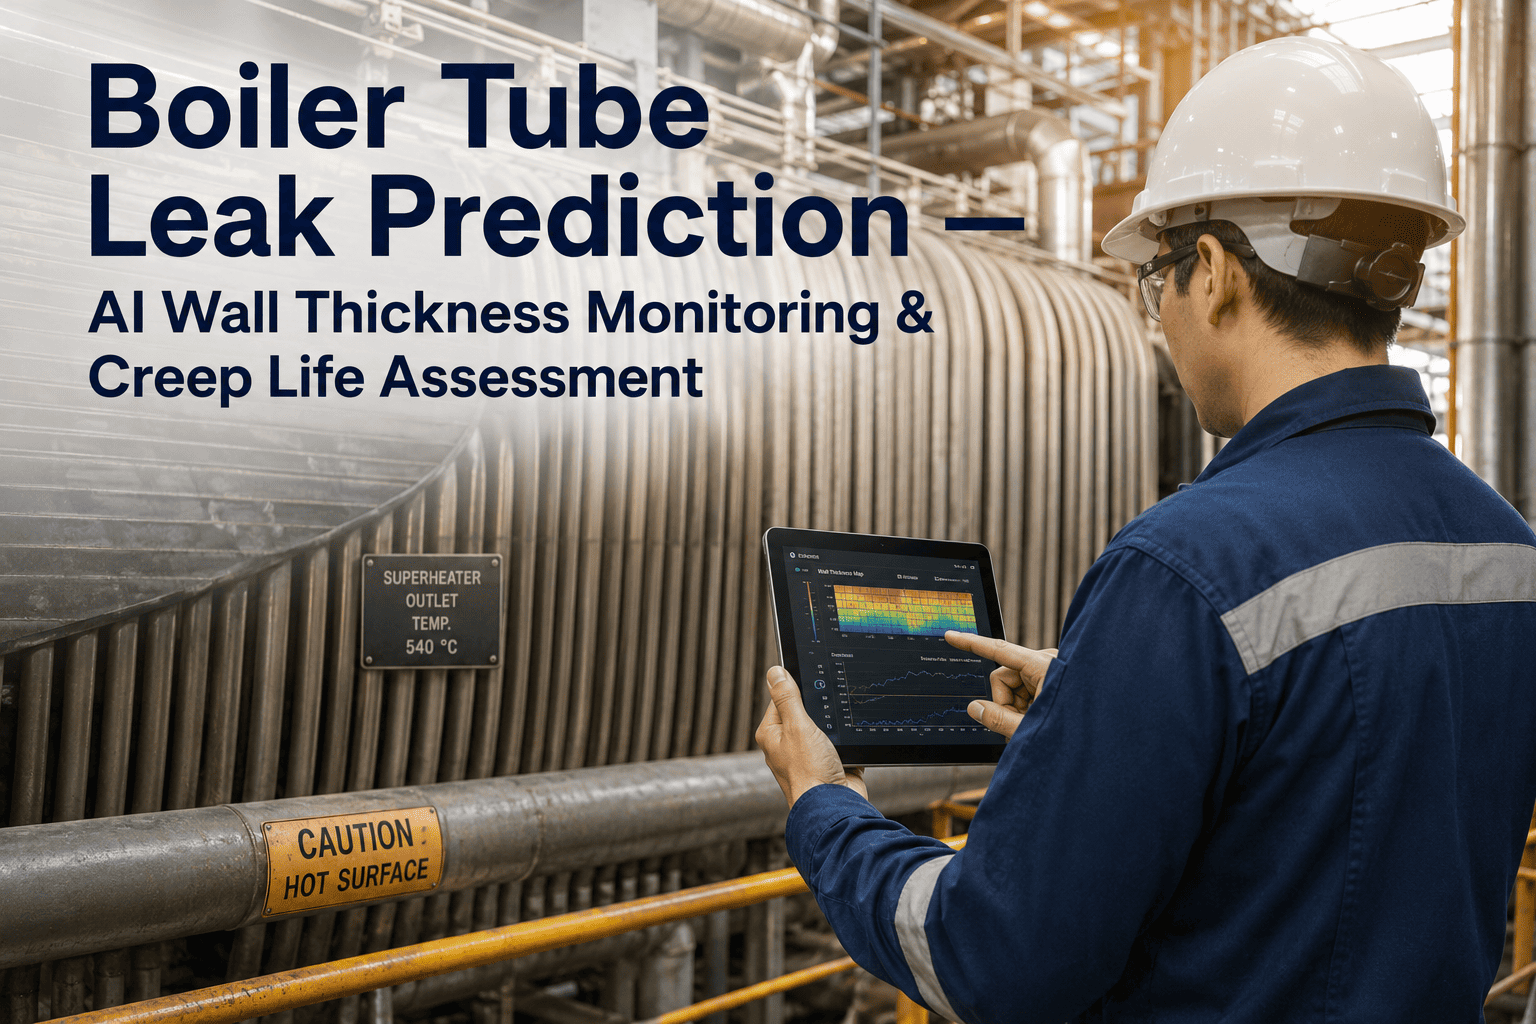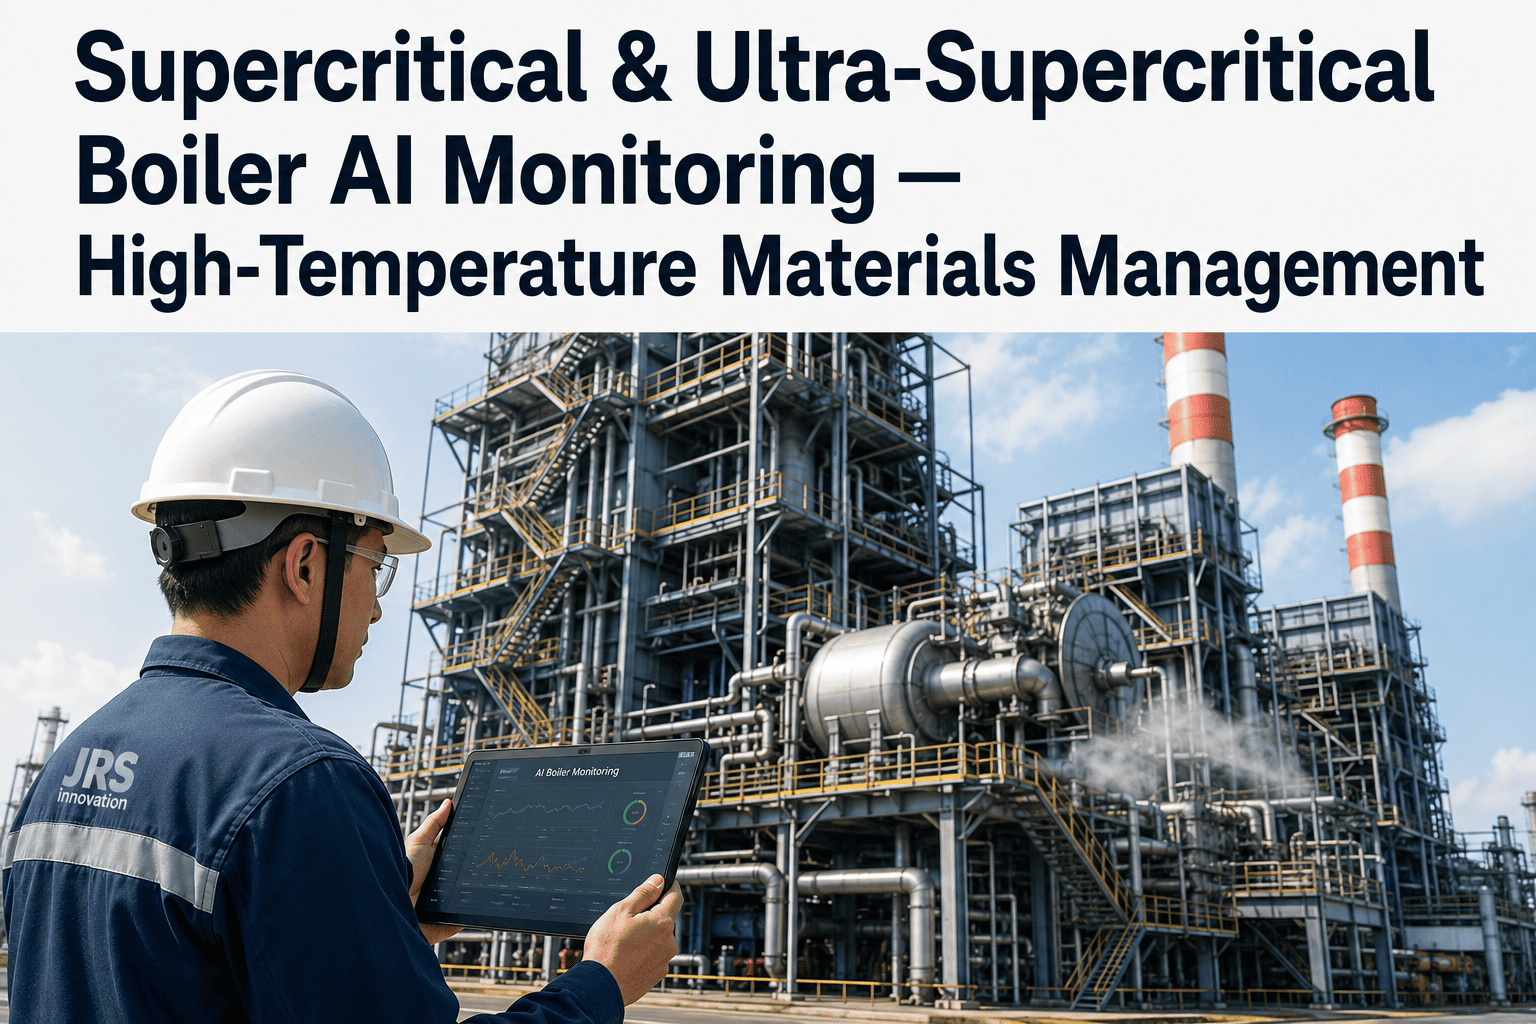
A plant manager running a supercritical or ultra-supercritical unit is operating metal at conditions that were considered experimental a generation ago, and the efficiency gains that come with pushing past 600C carry a cost most conventional monitoring programs were never designed to track. Creep damage in a header or a length of main steam piping does not show up as a sudden failure, it accumulates silently over years of operation at temperature, and the components most exposed to it are exactly the ones a forced outage cannot afford to lose without warning. A single header replacement can take a unit offline for weeks if the damage is discovered rather than predicted. iFactory tracks the specific high-temperature components carrying the highest creep exposure across your boiler and flags the ones approaching their remaining life limit, and you can book a demo to see how it maps against your own unit's material inventory.
Above 600C, Every Extra Hour of Operation Spends Down a Fixed, Non-Renewable Budget of Metal Life
iFactory's AI monitoring tracks temperature, pressure, and operating history against the specific creep-fatigue characteristics of your headers, main steam piping, and superheater tubes, so remaining life is a number you manage instead of a surprise you discover.
Four Component Groups Carry Almost All of the Creep Exposure on a Supercritical Unit
Not every part of a supercritical boiler operates under the same thermal stress. A small number of component groups sit at the temperature and pressure combination where creep damage actually accumulates, and those are the ones that deserve continuous attention.
Superheater & Reheater Tubes
Final-stage tubes see the highest metal temperatures in the boiler and are typically the first components to show measurable creep strain.
Main Steam & Hot Reheat Piping
Thick-walled piping under sustained internal pressure accumulates creep damage slowly but catastrophically if a rupture occurs.
Outlet Headers
Header stub-to-shell welds concentrate stress at a geometry change, making them a common site for creep crack initiation.
Steam-Side Attemperator Zones
Thermal cycling from spray attemperation adds fatigue on top of creep, accelerating damage at these transition points.
Creep Life Is Consumed by Time at Temperature, Not by a Single Event
Unlike fatigue, which accumulates in discrete cycles, creep damage accumulates continuously as long as a component sits above its threshold temperature under load. That makes it a fundamentally different monitoring problem than most plant maintenance teams are used to solving.
Stage 1 — Primary Creep
Initial deformation occurs quickly after a component reaches operating temperature, then the strain rate slows as the material work-hardens.
Stage 2 — Secondary Creep
A long, steady-state period where strain accumulates at a roughly constant rate. Most of a component's operating life is spent here, and it is the stage where consumed life fraction can be tracked most reliably.
Stage 3 — Tertiary Creep
Strain rate accelerates as micro-voids link into visible cracking, and the time remaining before rupture shrinks rapidly once this stage begins.
Waiting for Stage Three Means the Warning Window Is Already Closing
iFactory tracks consumed life fraction through stage two, while there is still time to plan a replacement instead of react to a failure.
What Changes When Creep Life Is Modeled Continuously Instead of Estimated at Outage
| Monitoring Approach | Traditional Practice | AI-Based Continuous Monitoring |
|---|---|---|
| Data source | Periodic NDE inspection during scheduled outages | Continuous temperature and pressure history combined with periodic inspection data |
| Remaining life estimate | Recalculated once per outage cycle using average operating assumptions | Updated continuously using actual operating history for each component |
| Excursion tracking | Temperature excursions logged but rarely tied back to specific component life impact | Each excursion is quantified for its specific consumed-life contribution |
| Inspection prioritization | Fixed inspection scope based on component age and code requirements | Inspection scope weighted toward components showing the fastest life consumption |
A Short Excursion Above Design Temperature Can Consume Life Disproportionately
Creep rate does not scale linearly with temperature, it scales exponentially, which means a startup transient or a control upset that pushes a header briefly above its design temperature can consume a meaningful fraction of that component's remaining life in a matter of minutes. A plant that logs the excursion but never quantifies its life impact has no way to know whether that single event just moved a header years closer to its replacement date. This is the gap continuous monitoring is built to close, by converting every excursion into a specific, cumulative life-consumption number tied to the component that experienced it, rather than a note in an operating log that nobody revisits.
Over the operating life of a unit, the difference between a component that experienced a handful of well-managed excursions and one that experienced repeated uncontrolled ones can be measured in years of usable life, which is exactly the kind of gap that determines whether a header lasts to its next scheduled outage or needs an unplanned replacement.
What Plant Managers Report After Adding Continuous Creep Life Monitoring
The Efficiency Gain From Higher Steam Conditions Comes With a Materials Bill That Arrives Years Later
Every incremental increase in main steam temperature and pressure improves cycle efficiency, which is exactly why ultra-supercritical designs exist, but that gain is purchased against a materials budget that behaves very differently from a conventional subcritical unit. Advanced alloys like P91 and P92 were selected specifically because they extend the usable temperature range for these components, but they also carry their own creep-rupture characteristics that must be tracked accurately, since assuming a generic steel life curve on an advanced alloy component can produce a badly wrong remaining-life estimate in either direction. A plant that treats every header the same regardless of alloy grade risks either replacing serviceable components too early or running degraded ones too long.
This is also why the financial case for continuous creep monitoring tends to be straightforward once a plant has experienced even one unplanned header or piping failure, since the cost of an extended forced outage to replace a component that failed without warning is almost always larger than the cost of the monitoring program that would have flagged it months in advance.
Remaining Life Data Only Creates Value When It Reaches the People Scoping the Next Outage
A creep life model that lives in a separate report nobody checks before outage planning begins provides little practical benefit over a periodic OEM calculation. iFactory is built to feed directly into the outage scoping process, surfacing the specific headers, piping runs, and superheater sections closest to their remaining life threshold as a ranked list rather than a raw dataset that needs interpretation. This lets an outage planning team weigh replacement decisions against actual consumed-life data instead of relying solely on component age or the last inspection interval, which often does not reflect how hard a specific component has actually been run.
Over several outage cycles, this creates a documented history for every major component that shows exactly how its remaining life estimate has moved, giving both plant management and any outside inspection authority a clear, defensible record of how replacement and inspection decisions were made.
Questions Plant Managers Ask About Supercritical Boiler Life Monitoring
Know Which Header Is Closest to Its Limit Before an Outage Forces the Question
iFactory turns operating history you already have into a continuously updated remaining-life picture for every high-temperature component.