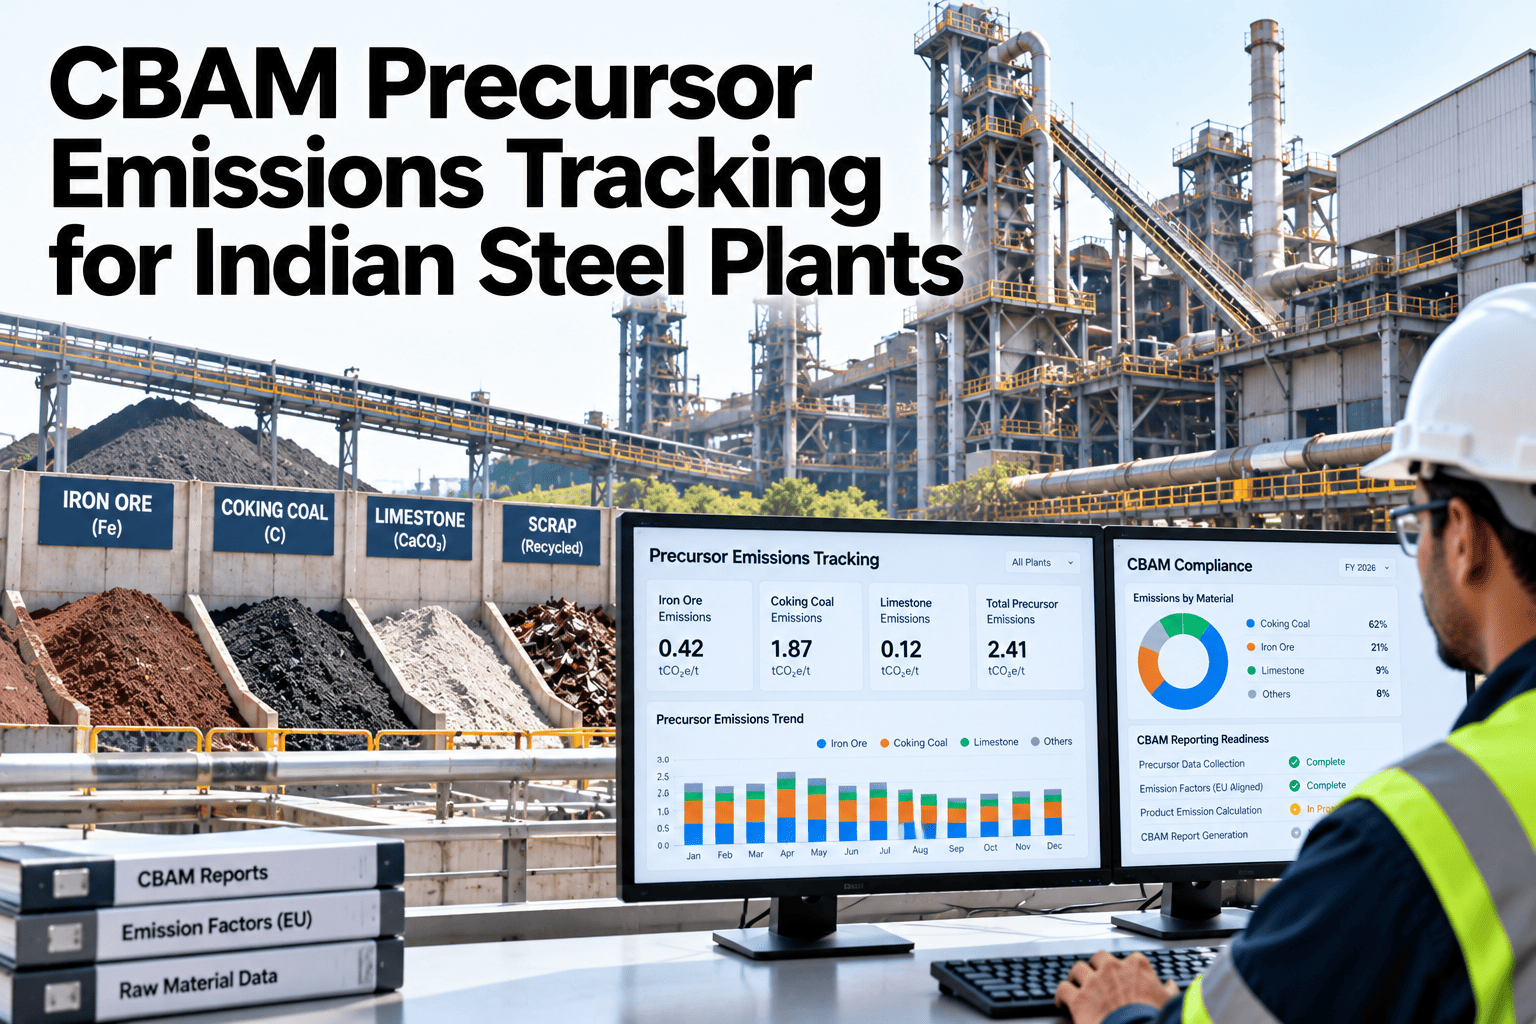
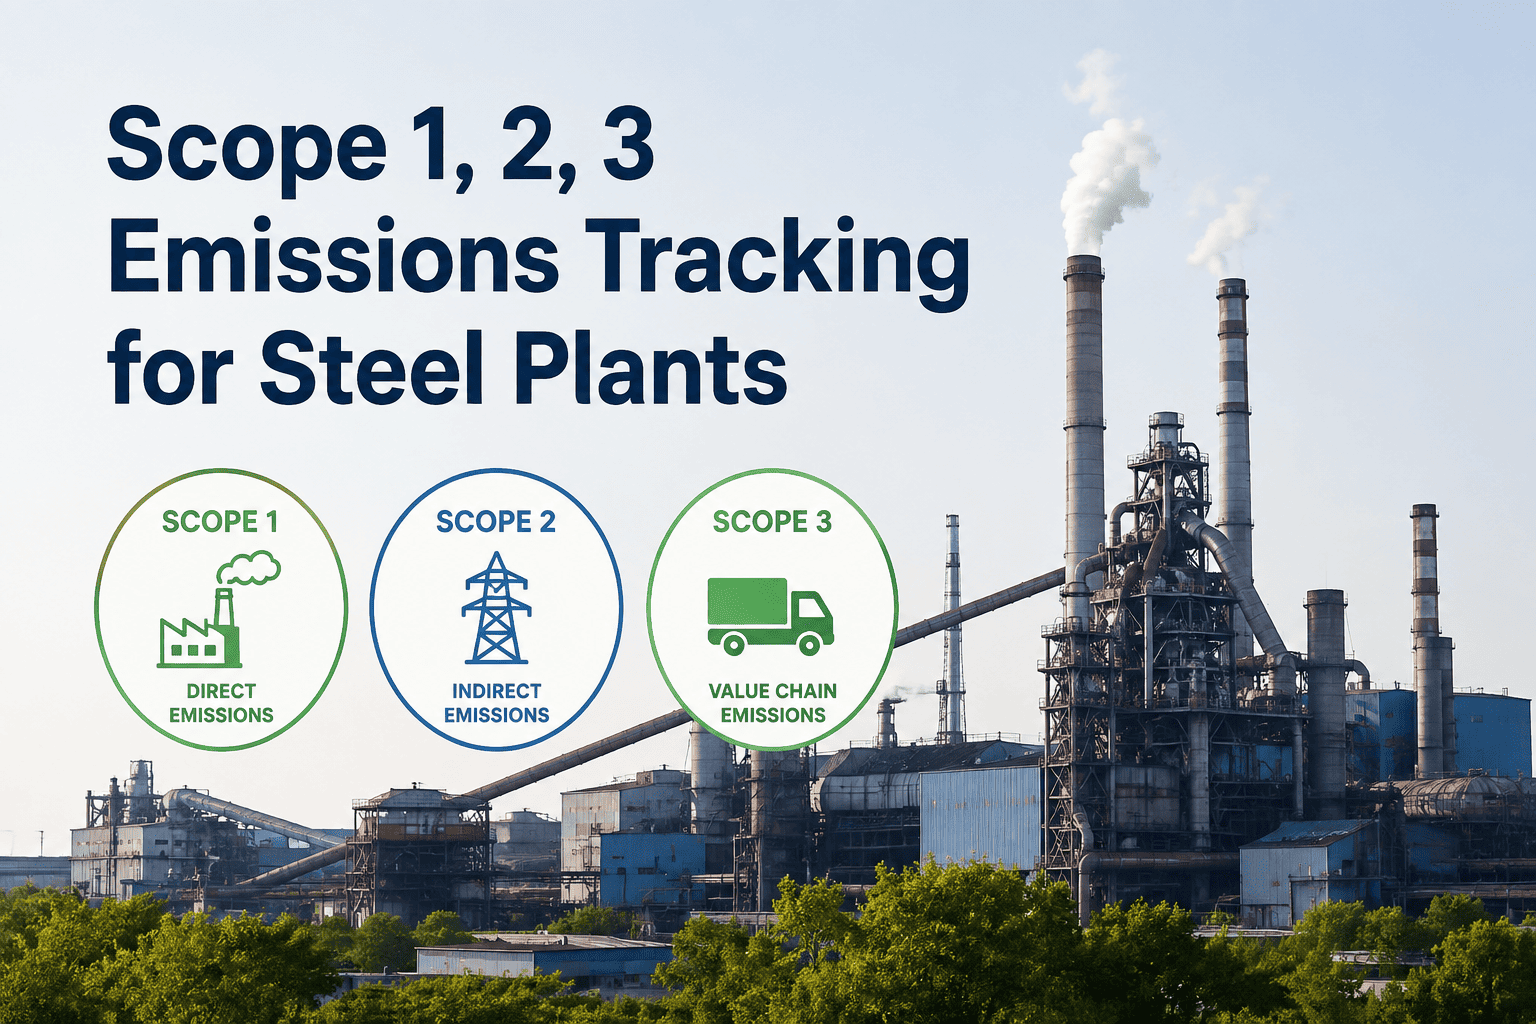
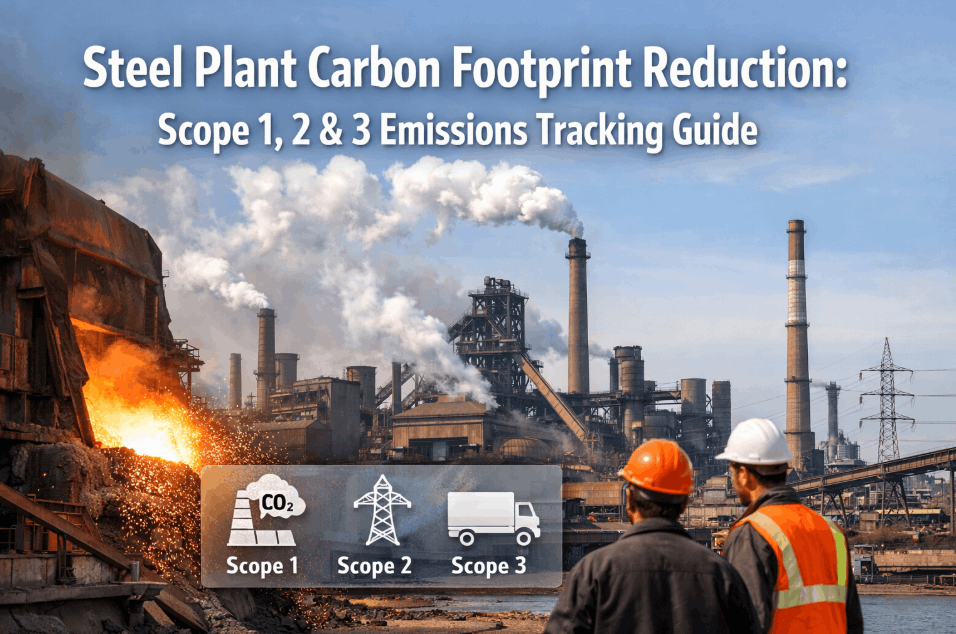
The EU carbon border mechanism, known as CBAM, counts the emissions embedded in imported steel, and that includes emissions from the materials and intermediate products used to make it. For Indian steel plants, this means tracing carbon through sinter, pellets, coke, hot metal, direct reduced iron and crude steel, then carrying it into every downstream product. Plants that can do this with reliable data protect their margins and their EU customers. To see how this could work in your plant, you can review a precursor tracing approach with our team.
CBAM embedded emissions for Indian steel exporters
Trace Precursor Emissions Through Your Plant So Every Product Carries an Accurate Carbon Figure
iFactory AI links production, energy and material data so precursor emissions flow correctly into the products you export to Europe.
Materials whose emissions must be traced
Iron ore and pelletsCokeSinterHot metalDirect reduced ironCrude steel
Where CBAM standsThe Definitive Period Has Started and Data Quality Now Matters
CBAM moved from a reporting phase into its definitive period on 1 January 2026. EU importers now need to account for embedded emissions in what they bring in.
2026
Definitive period began
Actual
Verified plant data can replace defaults
Default
Fallback values apply without verified data
Direct
Only direct emissions count for iron and steel
CBAM rules and deadlines have been amended more than once. Confirm current details with your EU customers and official guidance.
The steel chainEmissions Pile Up as Material Moves Through the Plant
Each stage adds emissions, and each stage feeds the next. Tracing means following the material and its carbon together.
Raw materials
Iron ore, pellets, coal and fluxes enter the plant
Intermediate products
Sinter, coke, hot metal or direct reduced iron are made
Steelmaking
Crude steel is produced from the intermediates
Rolling and finishing
Downstream products inherit the carbon of earlier stages
CBAM treats certain intermediate products as precursors, and their embedded emissions flow into the goods made from them. Confirm which materials count under the current regulation.
What to trackPrecursor, Emission Source and Data Needed
| Stage or precursor | Main emission source | Data you need |
|---|
| Sinter and pellets | Fuel and process emissions in agglomeration | Fuel use, production tonnes, carbon content |
| Coke | Coal carbonisation and fuel | Coal input, coke output, by-product streams |
| Hot metal or pig iron | Reduction in the blast furnace | Ore, coke and fuel inputs, tonnes produced |
| Direct reduced iron | Reductant and process fuel | Reductant use, product tonnes, fuel |
| Crude steel | Furnace fuel, electrode and flux use | Charge mix, additives, tonnes cast |
| Rolled products | Reheating furnace and process heat | Fuel per tonne, yield, product tonnes |
See Your Plant's Carbon Flow in One Picture
Share your process route and data sources and see how iFactory AI would trace emissions from raw material to finished product.
Calculation stepsFour Steps From Plant Data to a Product Figure
1
Define the boundary
Set which processes and materials belong to each product.
2
Measure and calculate
Collect fuel, material and emission data and apply factors.
3
Allocate
Share emissions between products using agreed rules.
4
Carry forward
Add precursor emissions into downstream products.
Write the method down. Verifiers and EU customers will ask how each number was produced.
Where the data livesBring Plant Systems Into One Emissions Layer
Most of the needed data already exists, but in separate systems.
Process and energy metersProduction and MES recordsLab and laboratory data
Emissions tracking layer
Product carbon figuresVerifier evidenceEU customer reports
Keep raw data, calculations and approvals together. An evidence trail saves weeks during verification.
Layers of boundariesFour Levels That Keep the Calculation Organised
Installation
The plant or site as a whole, with all its processes.
Production process
Each process such as sintering, ironmaking or steelmaking.
Precursor
Intermediate products moving between processes.
Final product
The goods shipped to the EU customer.
Working from the top down helps make sure no emission is missed and none is counted twice.
Measure or calculateTwo Ways to Obtain the Numbers
Calculation-based
Uses activity data and emission factors
Common for fuels and materials
Needs good records of quantities
Cheaper to run day to day
Measurement-based
Uses direct gas measurement
Needs certified analysers and procedures
Can improve accuracy for some sources
Costs more to install and maintain
Most plants combine both, using whichever is practical and acceptable for each source.
Indian plant realitiesFive Issues Plants Often Face
1
Multiple production routes
Blast furnace, coal-based DRI and scrap-based steelmaking can sit on one site.
2
Captive power and shared utilities
Allocating shared fuel and steam needs clear rules.
3
Variable raw materials
Ore, coal and scrap quality changes affect emissions.
4
Manual records
Paper logs slow down evidence collection.
5
Product mix complexity
Many grades and sizes need consistent allocation.
Starting with the biggest route and product groups gives results sooner. To plan your first scope, ask our team about phased precursor tracking.
RolloutFive Steps to a Working Tracking System
1
Map the process
Draw material and energy flows for each route.
2
Check the data
Find gaps in meters, records and laboratory results.
3
Set the method
Write boundaries, factors and allocation rules.
4
Run a trial period
Calculate a past period and compare with expectations.
5
Prepare for verification
Organise evidence and invite a verifier to review.
Process and material flow diagram
Meter and data gap list
Emission factors and sources documented
Allocation rules between products
Calculation sheets with version control
Evidence folder organised by process
Owner named for each data source
Trial calculation reviewed by a verifier or expert
Evidence typesSix Kinds of Evidence Verifiers Expect
Every figure in your calculation should link to something a verifier can inspect.
Meter records
Fuel, gas and power readings with calibration records.
Purchase and delivery documents
Invoices and weighbridge records for materials.
Laboratory results
Carbon content of fuels, ores and products.
Production records
Tonnes made at each process step.
Method documents
Written boundaries, factors and allocation rules.
Change logs
Records of method or system changes over time.
Organise evidence by process and period. A clear folder saves days during verification.
Where emissions come fromAn Illustrative Split by Production Stage
The split differs widely between routes. This example shows why tracing stages matters. It is illustrative only.
15 percent: Sinter and pellets
Agglomeration fuel and process emissions.
50 percent: Coke and ironmaking
The largest source in an integrated route.
20 percent: Steelmaking
Furnace fuel, electrodes and fluxes.
15 percent: Rolling and finishing
Reheating furnace fuel and process heat.
Direct reduced iron and scrap-based routes have very different shapes. Each route needs its own map.
Data qualityKnow How Reliable Each Source Is
A simple grid shows where to invest in better data first.
Data source
Reliable meter
Estimated value
Documented method
Strong
Ready for verification
Document it
Good data, weak explanation
Undocumented method
Improve measurement
Method exists but data is weak
Fix first
Neither data nor method is reliable
Concentrate effort on large emission sources. Perfecting a tiny source adds little.
Data tiersThree Levels of Emission Data Quality
Estimated
Based on averages or default-style assumptions.
Calculated
Based on plant activity data and recognised factors.
Measured and verified
Based on reliable measurement and independently checked.
The aim is to move the largest sources up a tier first. EU buyers value verified actual data most.
Who owns whatFour Teams Share Responsibility
Operations
We keep production and material records complete.
Energy and utilities
We keep meters calibrated and readings available.
Finance
We link purchase documents to quantities and costs.
Sustainability or compliance
We own the method, calculations and verifier contact.
Name one person accountable for the whole calculation. Shared responsibility without an owner leads to gaps.
Twelve-week startA Practical Plan for the First Quarter
Weeks 1 to 4
Map one route, list data sources and find gaps.
Weeks 5 to 8
Fix key meters, write the method and test the calculation.
Weeks 9 to 12
Review with an expert or verifier and prepare the evidence folder.
Expert reviewWhat a Steel Sustainability Lead Would Check First
Expert review
Strong CBAM data starts with clear boundaries and reliable meters. Fancy software cannot rescue a calculation built on unclear allocation or missing records.
VerdictStrong when the process map, method and evidence are agreed before reporting.
Watch forEstimates that cannot be traced back to a meter, invoice or laboratory result.
Do nextMap one production route end to end and calculate one product's carbon figure.
Frequently asked questionsWhat Indian Steel Plants Ask About CBAM Precursors
What is a precursor in CBAM?
A precursor is an input material that is itself made in a carbon-intensive process and whose embedded emissions pass into the final product. In steel, intermediates such as pig iron and direct reduced iron are examples. Confirm the current list with official guidance.
Review your precursors.
Do we have to use actual emissions or can we use defaults?
EU importers can use default values, but these are typically conservative and may raise costs. Using actual plant data requires verification by an accredited verifier. Many exporters aim for verified actual data.
Ask about actual versus default data.
Do indirect emissions from electricity count for steel?
Under the current definitive rules, only direct emissions are counted for iron and steel. Rules can change, so check current guidance and keep electricity data anyway for other reporting needs.
Discuss reporting scope.
How do we handle plants with several routes?
Treat each production route as its own flow, with clear boundaries and allocation rules between products and shared utilities. Documentation matters most for shared fuels and mixed charges.
Ask about multi-route plants.
How long does it take to set up tracking?
A first working version for one route and a few products can take weeks to a few months, depending on data quality. Plan extra time for meter fixes and for verifier feedback.
Plan a first scope.
Trace the carbon, protect the margin
Give Every Export Tonne a Carbon Figure You Can Defend
Book a session with iFactory AI to map your process routes, trace precursor emissions and prepare evidence that EU customers and verifiers will accept.