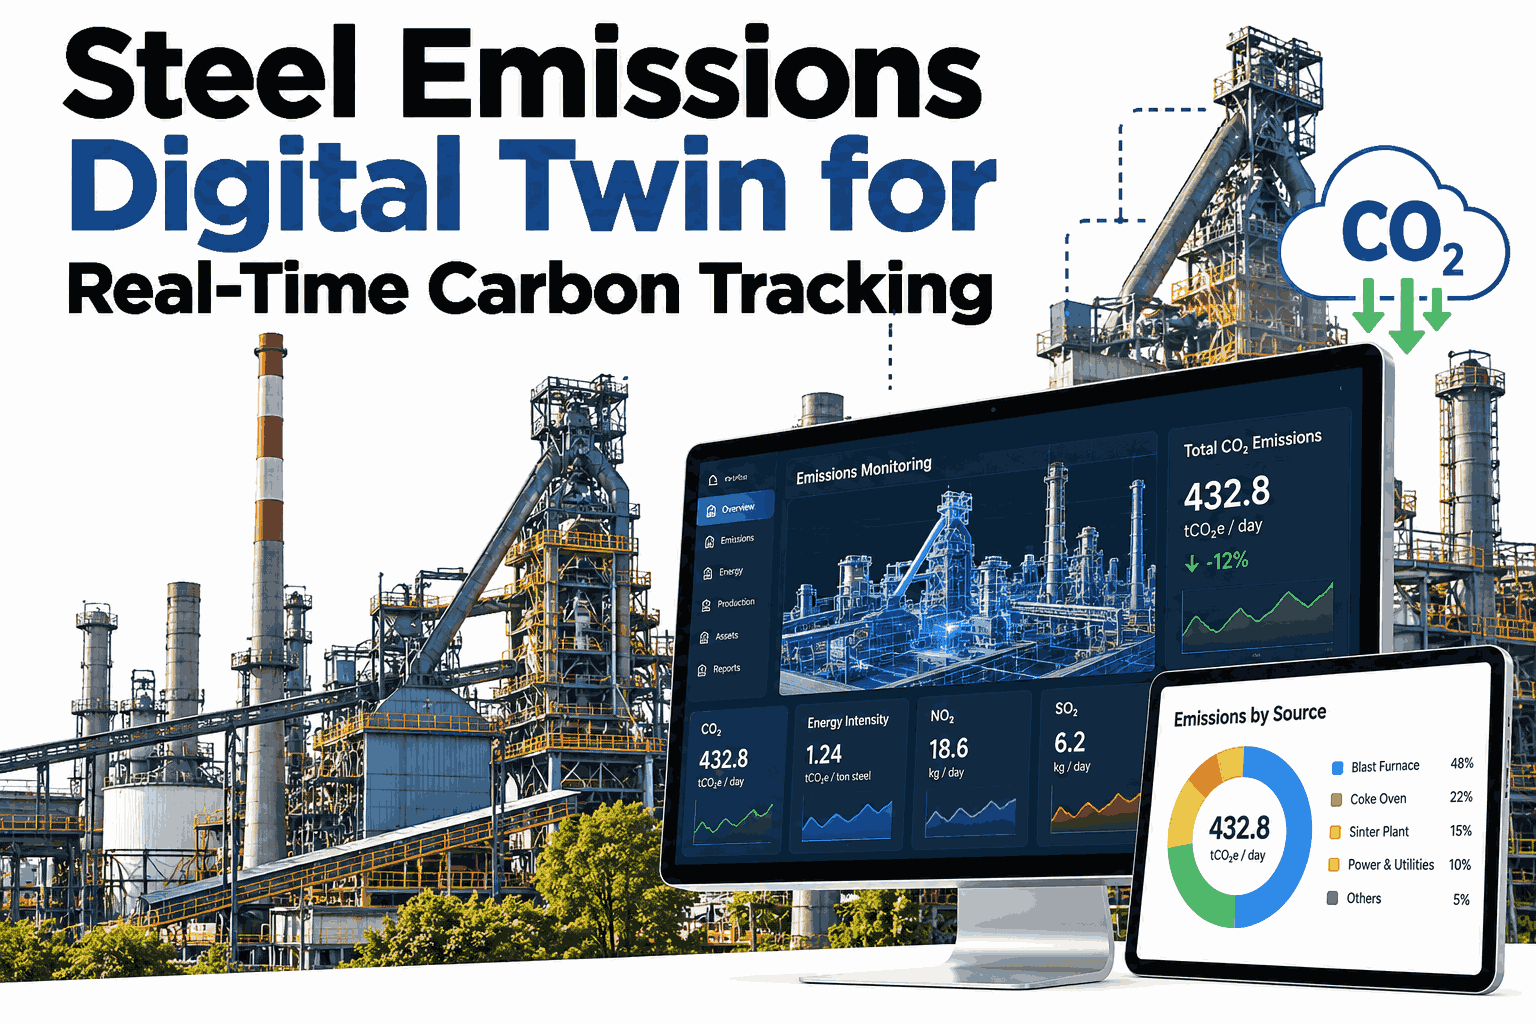
Most steel plants still calculate their carbon footprint the same way they calculate monthly production costs, by exporting numbers at the end of the month and reconciling them by hand. By the time a Scope 1 emissions figure reaches a sustainability report, the heat that produced it finished weeks earlier, and nobody can trace a spike back to a specific furnace, shift, or fuel mix. A digital twin changes that order entirely. Instead of reporting carbon after the fact, it models the plant's flow of energy and material as production happens, so a melt shop supervisor can see today's CO2 output the same way they see today's tonnage, and plants exploring this shift can review how a live emissions model maps onto their own furnace and utility data.
A Digital Twin That Turns Production Activity Into Live Emissions Data
iFactory AI builds a plant-wide flow model that ties every heat, shift, and fuel reading to a CO2 figure the moment it happens, replacing month-end spreadsheets with daily emissions tracking.
Why a Spreadsheet Can't Track Carbon the Way Production Needs It To
Carbon accounting built on month-end exports was never designed to answer the questions a plant actually asks day to day. It was built for an annual disclosure, not for a melt shop supervisor trying to understand why today's heat ran hotter than yesterday's. Three gaps show up again and again once a sustainability team tries to move faster than a monthly cycle.
No Link to a Specific Heat
A monthly total tells you the plant emitted a certain tonnage of CO2, but not which furnace, grade, or shift drove it, so a spike has nowhere to be traced back to and nobody has the context to explain it when a customer or auditor asks.
Scope 2 Lags the Grid
Purchased electricity carries a carbon intensity that shifts hour by hour with the grid mix, yet most plants apply one static factor across an entire month of production, overstating some shifts and understating others without anyone realizing it.
Reports Arrive Too Late to Act On
By the time a monthly figure is compiled, reviewed, and reported, the process conditions that drove it are long gone, leaving no window to correct course mid-month or coach a shift on what actually changed.
A digital twin closes all three gaps at once by modeling the plant as a live system instead of a monthly ledger, which is why it becomes the backbone of carbon tracking rather than another report layered on top of production software that already exists.
How the Emissions Digital Twin Is Built, Layer by Layer
The twin is not one piece of software sitting on top of the plant. It is five connected layers, each turning a different kind of signal into a piece of the emissions picture that updates as production runs.
Each layer depends on the one before it staying accurate, which is why the twin is modeled against the plant's real equipment list rather than dropped in as a generic carbon calculator.
Mapping the Twin to Scope 1, Scope 2, and Scope 3
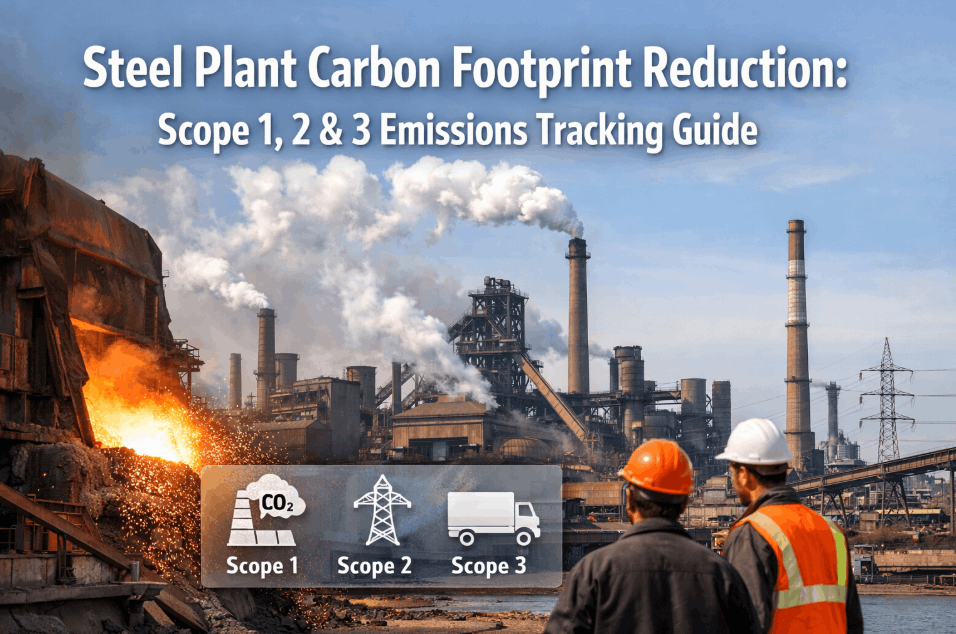
Steel emissions reporting has to separate what the plant burns directly from what it buys and from what happens upstream in the supply chain. The twin is structured to keep those three categories distinct from the first calculation onward.
| Scope | Source in a Steel Plant | How the Twin Tracks It | Update Frequency |
|---|---|---|---|
| Scope 1 | Natural gas at reheat furnaces, EAF electrode consumption, process gas flaring | Direct fuel flow meters feed the flow model as combustion happens | Live, by heat and shift |
| Scope 2 | Purchased electricity for EAF transformers, rolling mill drives, compressors | Power meters paired with a time-matched grid emission factor | Live, hourly grid intensity |
| Scope 3 | Purchased scrap, alloy additions, inbound and outbound freight | Procurement and logistics data joined to production volume | Daily to weekly, by shipment |
Keeping the three scopes structurally separate in the model is what lets a plant answer a Scope 1 question and a Scope 3 question from the same system without reconciling two spreadsheets, and teams can walk through how their own scope boundaries would map into the twin.
See a Live Emissions Figure Calculated From Your Own Plant Data
Book a 30-minute session and watch Scope 1 and Scope 2 CO2 get calculated in real time from furnace, power, and fuel readings structured the way your plant actually runs.
What Changes When Carbon Reporting Moves From Monthly to Daily
The figures below are an illustrative composite from a mid-size steel plant that replaced a month-end carbon export with a live digital twin. Each tile shows the measure after the move, relative to where it started.
Results vary by plant, meter coverage, and existing data maturity. The pattern that holds across plants is that a live twin turns carbon reporting from a periodic project into a number any shift supervisor can check alongside tonnage, instead of a figure that only surfaces once a month and only after someone has reconciled three separate spreadsheets.
Who Actually Uses the Live Emissions Data
A monthly carbon report mostly serves one audience: whoever signs the sustainability disclosure. A live digital twin changes who checks the number and how often, because the data finally arrives fast enough to be useful to people running the plant day to day.
Melt Shop Supervisor
Checks EAF emissions intensity alongside tonnage and power draw at the end of every shift, catching a drifting electrode or fuel reading before it compounds across a week of heats.
Sustainability Lead
Pulls a defensible Scope 1 and Scope 2 figure for any date range without waiting on a month-end export, and can explain a spike using the same production context the plant floor already tracks.
Plant Manager
Reviews emissions intensity next to OEE and cost per tonne on one dashboard, treating carbon as an operating metric rather than a separate compliance exercise reviewed once a quarter.
Compliance & Reporting Team
Exports an audit-ready trail showing exactly which meter, factor, and production record produced each figure, instead of reconstructing the calculation from memory when an auditor asks.
Common Mistakes That Undermine an Emissions Digital Twin
Plants that struggle with digital twin accuracy usually trip over the same handful of issues, not a shortage of sensors. Knowing these in advance saves months of rebuilding trust in a number that should have been reliable from day one.
Emissions Data Integrity Checklist
A digital twin is only as trustworthy as the data feeding it. These checks catch the gaps that quietly turn a live emissions figure into a guess dressed up as precision.
None of these checks require new hardware. They require the twin to be built with the same discipline applied to the production data it already sits beside.
What the Twin Needs to Connect To Before It Goes Live
A flow model is only as good as the systems feeding it. Most steel plants already have the raw data somewhere, the work is connecting it into one model instead of leaving it spread across four systems that never talk to each other.
Historian or SCADA
Fuel flow, power draw, and process gas tags already being logged for operations become the backbone of the emissions calculation, so no parallel data collection system is needed just for carbon tracking.
ERP and MES
Heat records, grade, shift schedule, and production volume from the ERP or MES give every emissions figure its production context, so a CO2 number is never floating without a link back to what was actually made.
Utility Billing and Grid Data
Electricity billing data and, where available, grid operator carbon intensity feeds keep the Scope 2 factor current instead of locked to a single value pulled once a year from a utility statement.
Once these three sources are connected, the flow model has everything it needs to turn a reading into a traceable emissions figure without a manual handoff between departments, and plants can confirm which of these systems are already in place before scoping a rollout.
What iFactory AI Adds to Emissions Digital Twin Design
iFactory AI is smart manufacturing and industrial software built for carbon-intensive steel plants. It pairs the digital twin with the same platform already tracking production, quality, and maintenance, so emissions never sit in a separate system.
Plant-Specific Flow Modeling
The twin is built against your actual process routing and equipment list, not a generic steel plant template.
Scope-Separated Calculation
Scope 1, 2, and 3 sources run through distinct calculation paths, so each can be reported and audited on its own.
Shift-Level Traceability
Every CO2 figure can be traced back to the heat, shift, and equipment that produced it, not just a daily total.
Grid-Aware Scope 2
Purchased electricity is matched to the grid's carbon intensity at the time it was drawn, not a flat monthly factor.
Deviation Alerts
Emissions intensity drifting above baseline is flagged the same day, instead of surfacing in next quarter's report.
One Platform, Not a Side Tool
Emissions data sits alongside production and maintenance data already captured, so a spike can be explained by what else was happening on the floor.
iFactory AI arrives pre-configured on an NVIDIA server that ships racked and ready with software pre-loaded. Rack it, connect power and Ethernet, and meter mapping begins. Scope covers cabling, network, historian integration, ERP and MES connections, team training, and 24x7 remote monitoring.
Frequently Asked Questions
How is a digital twin different from standard carbon accounting software?
Standard carbon accounting software totals emissions after production data is exported. A digital twin models the plant's live flow of fuel, power, and material, so the CO2 figure updates as the heat runs. See this difference on a live model walkthrough.
What equipment and meters does a steel plant need before starting?
Most plants already have fuel flow meters and power meters on major equipment. The twin is built around existing coverage first, with gaps identified and prioritized rather than requiring a full re-instrumentation. Ask the iFactory AI team to review your current meter coverage.
Can Scope 3 emissions from scrap and freight really be tracked daily?
Scope 3 updates at the pace procurement and logistics data arrives, typically daily to weekly by shipment, which is still far faster than a quarterly supply chain estimate. Plan a Scope 3 data mapping session for your own suppliers.
How does the twin handle a missing or faulty sensor reading?
A missing or out-of-range reading is flagged rather than silently treated as zero, so a sensor fault shows up as a data quality alert instead of quietly understating emissions. Talk through sensor fault handling with the iFactory AI team.
How long does it take to get a live emissions dashboard running?
iFactory AI is delivered turnkey and is typically live in 6 to 12 weeks, with emissions dashboards following initial meter mapping and flow model configuration. Plan a rollout timeline for your plant in a short session.
Replace Month-End Carbon Exports With a Live Digital Twin
iFactory AI models your plant's flow of fuel, power, and material to deliver Scope 1 and Scope 2 CO2 your team can check daily, by shift. Book a walkthrough using your own meter list.