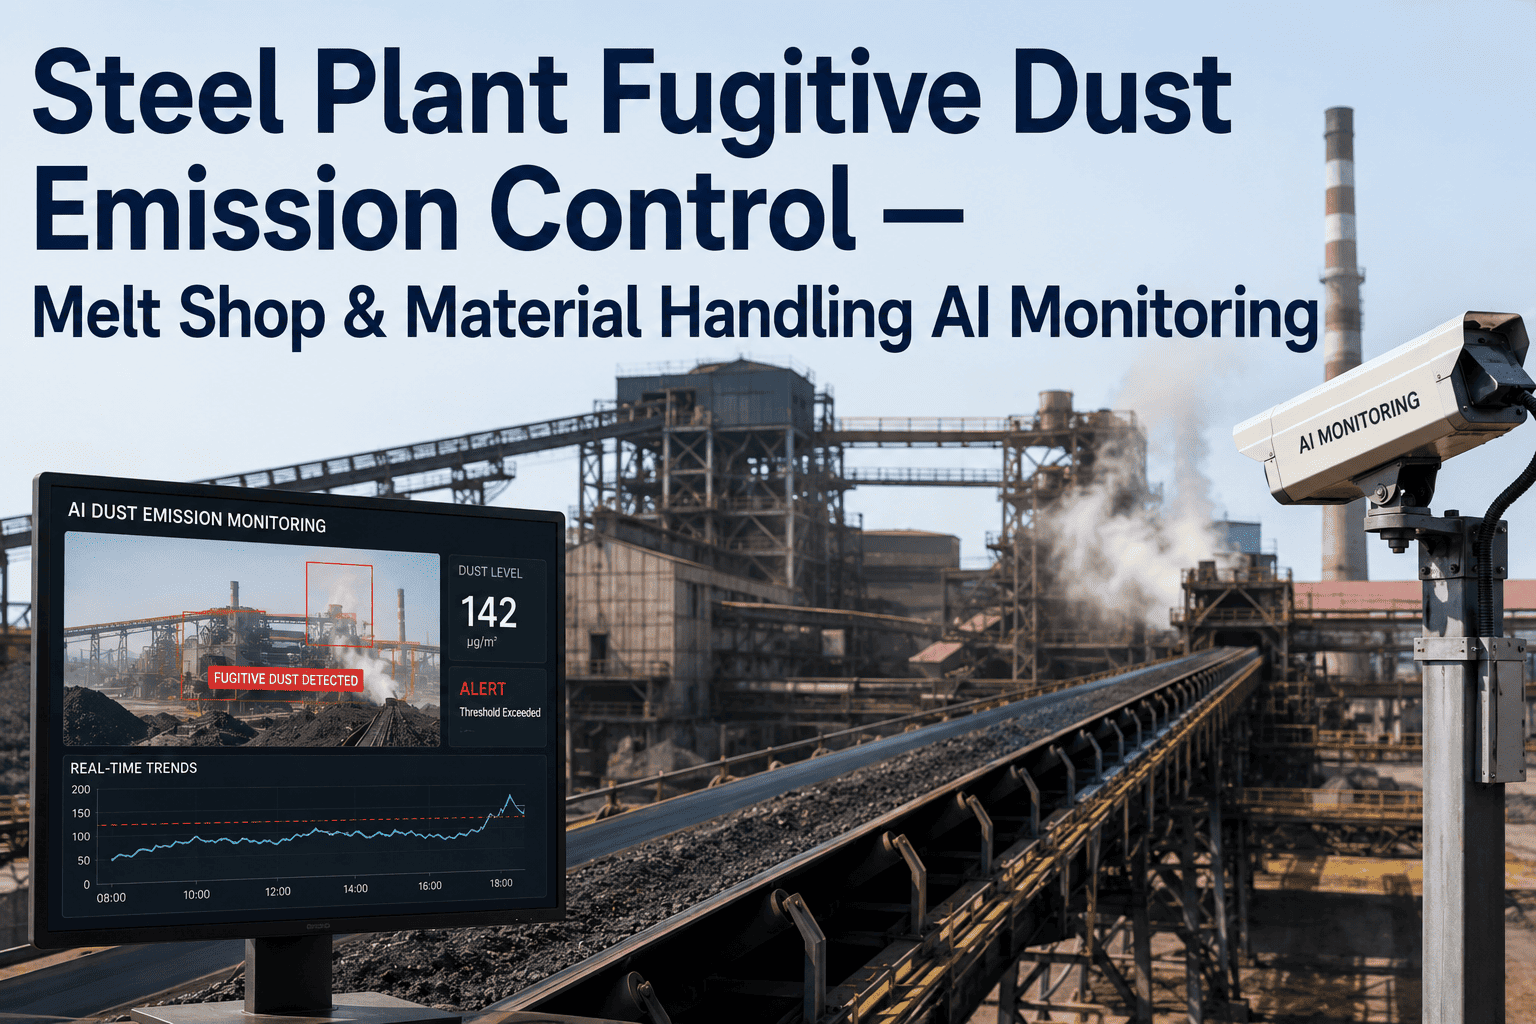
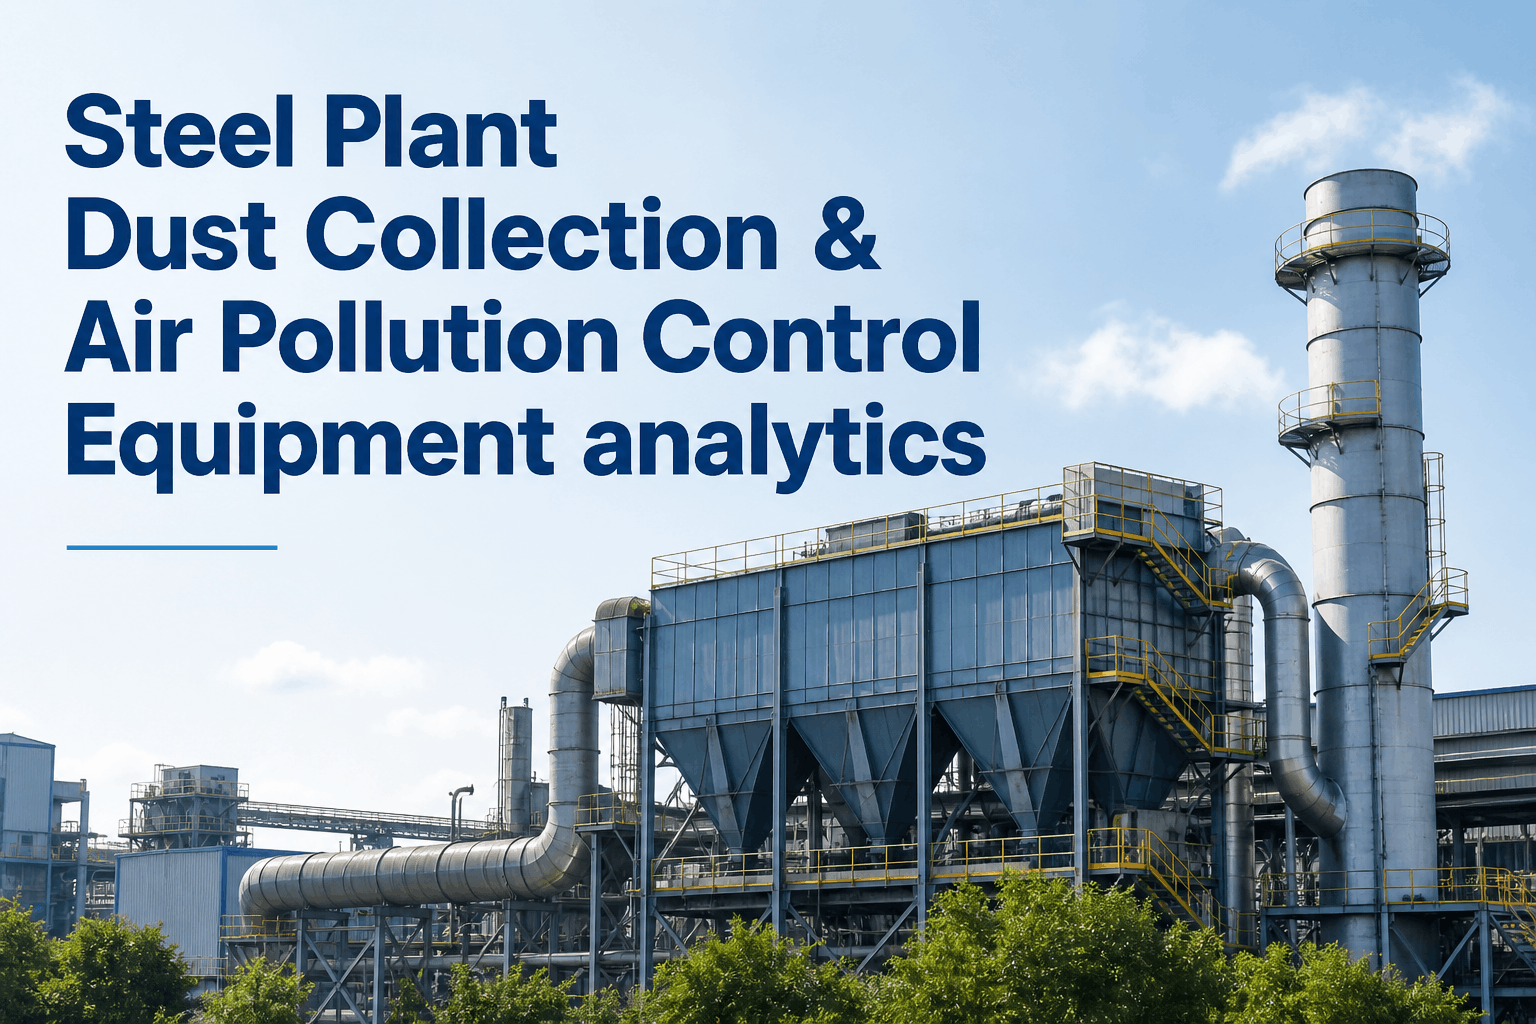
Steel plants operating blast furnaces, electric arc furnaces, and sintering lines release millions of cubic metres of particulate-laden gas every hour. A single baghouse module failure can spike PM2.5 readings past regulatory limits within minutes — exposing your plant to EPA, Environment Agency, or CPCB enforcement action before your shift supervisor even knows there's a problem. iFactory's dust collection and air pollution control analytics connects PLC differential pressure sensors, AI camera feeds, and SAP PM work order data into one live dashboard — giving your EHS team the early warning system that replaces clipboard-based rounds with continuous automated monitoring across every baghouse, ESP and scrubber in your plant.
Dust Collection & Air Pollution Control Analytics for Steel Plants
Real-time baghouse, ESP & scrubber monitoring — catch failures before they become regulatory violations.
Live Equipment Efficiency — Baghouse, ESP & Scrubber
iFactory ingests differential pressure, outlet opacity, and flow rate data from your PLC and SCADA systems in real time. Each equipment type is benchmarked against its design efficiency — deviations trigger alerts before visible stack emission changes occur.
From Source to Stack — Where Particles Are Captured
AI-powered digital twin modelling maps every metre of your ductwork — identifying leakage points, velocity losses, and bypass risks that manual inspection cannot detect. Integrating your continuous emission monitoring system (CEMS) with iFactory gives a full capture-path view in one screen.
AI, Sensors & ERP — All Connected to One Platform
iFactory connects AI camera vision systems at baghouse hopper outlets and ESP fields with PLC-sourced differential pressure data, SAP PM work order history, and OBD-linked mobile inspection records — creating the first true digital twin for dedusting systems in steel manufacturing.
AI camera vision detects torn filter bags, blinded hoppers, and hopper snow-loading without manual inspection. The predictive maintenance engine uses pressure-drop trend analysis to forecast filter bag replacement 3–6 weeks ahead — eliminating emergency shutdowns for bag change-outs.
Regulatory Pollutant Levels vs Permitted Limits
iFactory tracks PM2.5, PM10, NOx, and SO₂ against your EPA, IED, or CPCB permit limits — flagging threshold breaches to EHS teams instantly via mobile and email, with auto-generated regulatory report exports in EPA Method 5 and EU IED formats.
What iFactory Monitors — Out of the Box
Every iFactory dust collection deployment covers the following monitoring points, wired directly to your existing PLC infrastructure via MODBUS RTU, PROFIBUS, or OPC-UA — no additional hardware required for most steel plants.
Before iFactory, we discovered baghouse failures during the monthly stack test — not before them. Now we get a WhatsApp alert 4 days before a filter row fails. In 14 months we have had zero EPA limit exceedances.
Frequently Asked Questions
Does iFactory work with existing PLC brands like Siemens, Rockwell, or ABB?
Yes — iFactory connects via MODBUS RTU, PROFIBUS, OPC-UA, and Ethernet/IP. No PLC replacement is required and most plants are live within 3 weeks.
Can iFactory predict filter bag failure before it causes an opacity exceedance?
Yes. The predictive model uses ΔP trend, cleaning cycle response, and historical bag life data to flag likely failures 3–6 weeks ahead with 87% accuracy.
Does iFactory generate EPA-compliant emission reports automatically?
Yes — iFactory exports reports in EPA Method 5, EU IED, and CPCB formats on a scheduled or on-demand basis directly to your EHS team inbox.
How does AI camera vision improve on traditional opacity monitors?
Cameras provide visual context — identifying which specific bag row is failing — while opacity monitors only give a single aggregate reading for the whole unit.
What is the ROI timeline for dust collection analytics?
Most plants recover implementation cost within 8–12 months through avoided fines, reduced emergency bag change-outs, and lower compressed-air consumption from optimised pulsing.
Get Your Free Dust Collection Analytics Demo
We connect to your PLC data and build your first compliance dashboard in 3 weeks — at zero infrastructure cost.