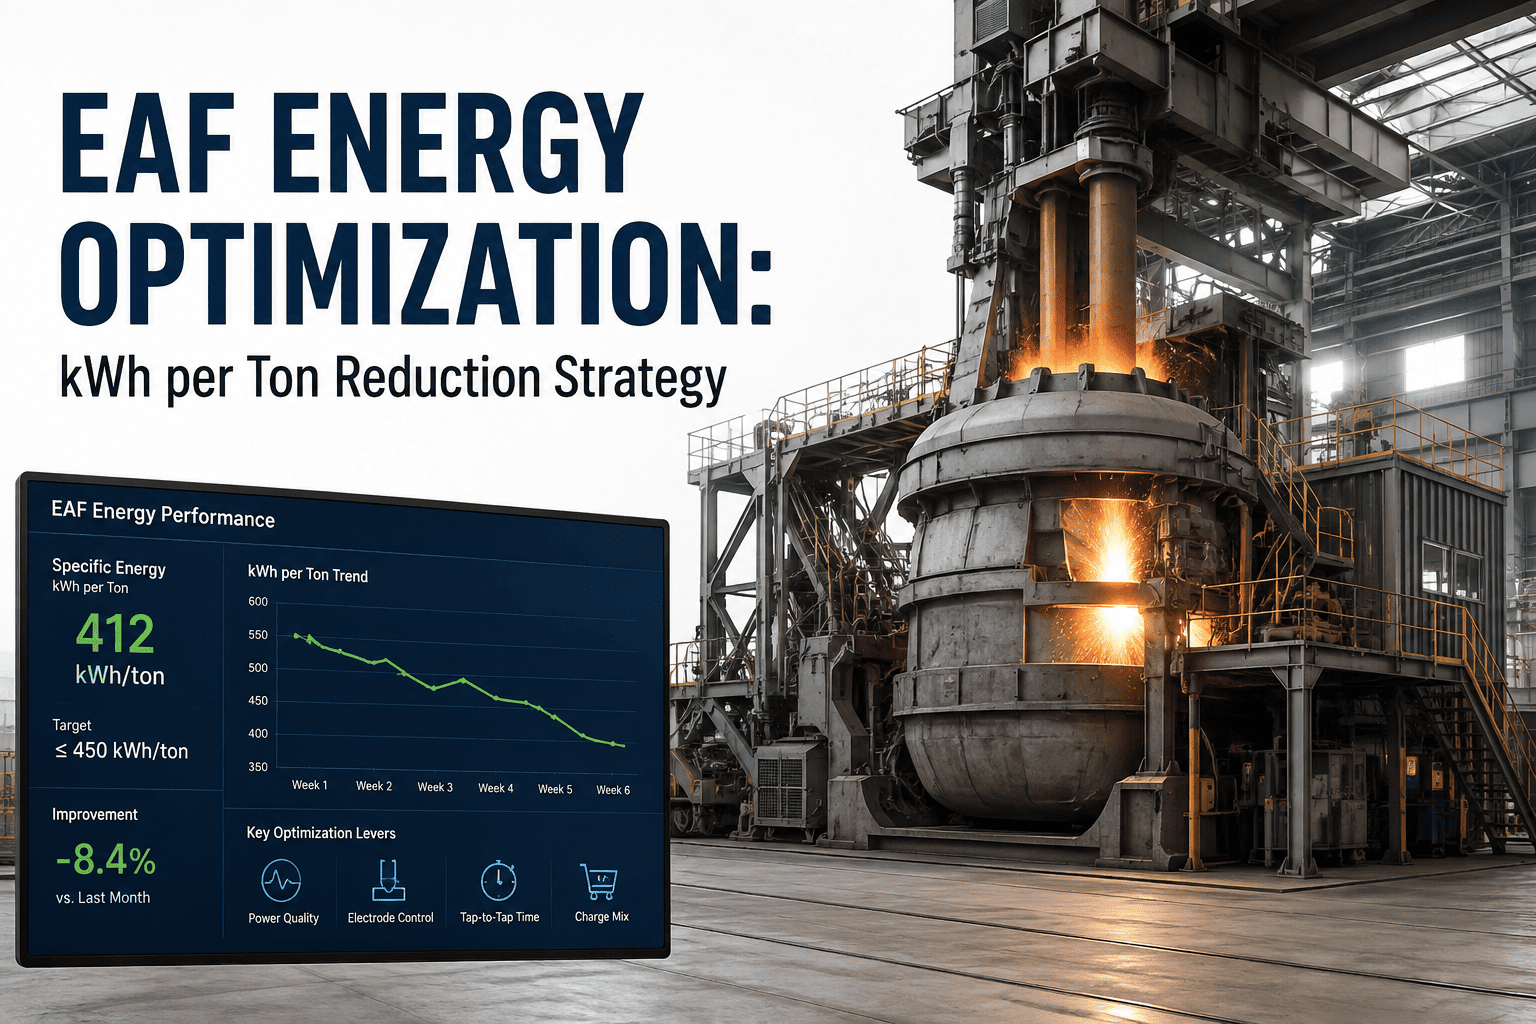
Electricity is usually the single largest controllable cost line on an EAF operation's P&L, and most mills running 380-450 kWh/ton assume that number is mostly fixed by scrap mix and furnace design. In practice, a meaningful share of that consumption comes from power curve timing, foamy slag practice, and electrode regulation that drift slightly out of tune shift after shift without anyone noticing until the utility bill lands. AI models trained on your furnace's own power, chemistry, and timing data close that gap by tuning the power curve and slag practice heat by heat rather than relying on a fixed recipe. Mills applying this approach typically cut 20-40 kWh/ton without adding a single minute to tap-to-tap time, and you can see the specific levers on a furnace like yours by visiting this scheduling link.
380-450 kWh/Ton Isn't a Law of Physics. It's a Number AI Can Move
iFactory's AI tunes your EAF power curve, slag foaming, and electrode regulation heat by heat, cutting 20-40 kWh/ton without sacrificing tap-to-tap time.
Where the Extra 20-40 kWh/Ton Actually Goes
No single cause explains excess EAF energy use. It accumulates across small inefficiencies in power application timing, slag coverage, and electrode positioning that each look minor on their own.
How the Model Cuts Energy Without Slowing the Heat
Dynamic Power Curve Tuning
The model adjusts power input in real time based on scrap melt state rather than following a fixed curve built for an average heat.
Slag Foaming Optimization
Carbon and oxygen injection timing is tuned to maintain foam coverage that shields the arc and reduces radiant heat loss to the shell.
Electrode Regulation Stability
Arc stability improves as electrode position responds faster to bath conditions, reducing flicker-related energy waste.
Flat Bath Time Reduction
Chemistry and temperature trends are tracked continuously so refining ends closer to the actual target rather than running past it.
Every kWh/Ton Saved Compounds Across Every Heat
A 20-40 kWh/ton reduction on a high-heat-count furnace adds up to a meaningful annual electricity line item without touching production volume.
Standard Power Curves vs Heat-by-Heat AI Tuning
| Practice | Basis for Adjustment | Typical kWh/Ton Impact |
|---|---|---|
| Fixed Power Curve | Average heat profile, rarely revisited | Baseline, no active reduction |
| Operator Manual Adjustment | Experience and visual judgment | Inconsistent, shift-dependent |
| iFactory AI Power Tuning | Live melt state, chemistry, and arc data | 20-40 kWh/ton reduction |
Measured Outcomes After AI Power Optimization
How a Typical Energy Optimization Rollout Is Sequenced
Most mills phase the rollout so the model proves itself on measured data before operators are asked to trust its recommendations for live power curve decisions.
Baseline Period
Current kWh/ton and cycle time are measured across a representative set of heats before any model changes are applied.
Shadow Mode
The model runs alongside existing operator practice, generating recommendations without controlling the furnace directly.
Supervised Control
Recommendations move to active control with an operator able to override, building trust in the model's adjustments.
Full Deployment
The model runs continuously across all heats, with performance tracked against the original baseline period.
Questions EAF Operations Managers Ask About Energy AI
Will optimizing for lower kWh/ton slow down our tap-to-tap time?
Does this require replacing our existing electrode regulation system?
How quickly do we see energy savings after the model goes live?
Can the model account for different scrap mixes across shifts and heats?
Does this work on both AC and DC electric arc furnaces?
Your Furnace Is Already Telling You Where the Energy Is Going
See how iFactory's AI reads your live power, chemistry, and arc data to cut 20-40 kWh/ton without changing your production schedule.