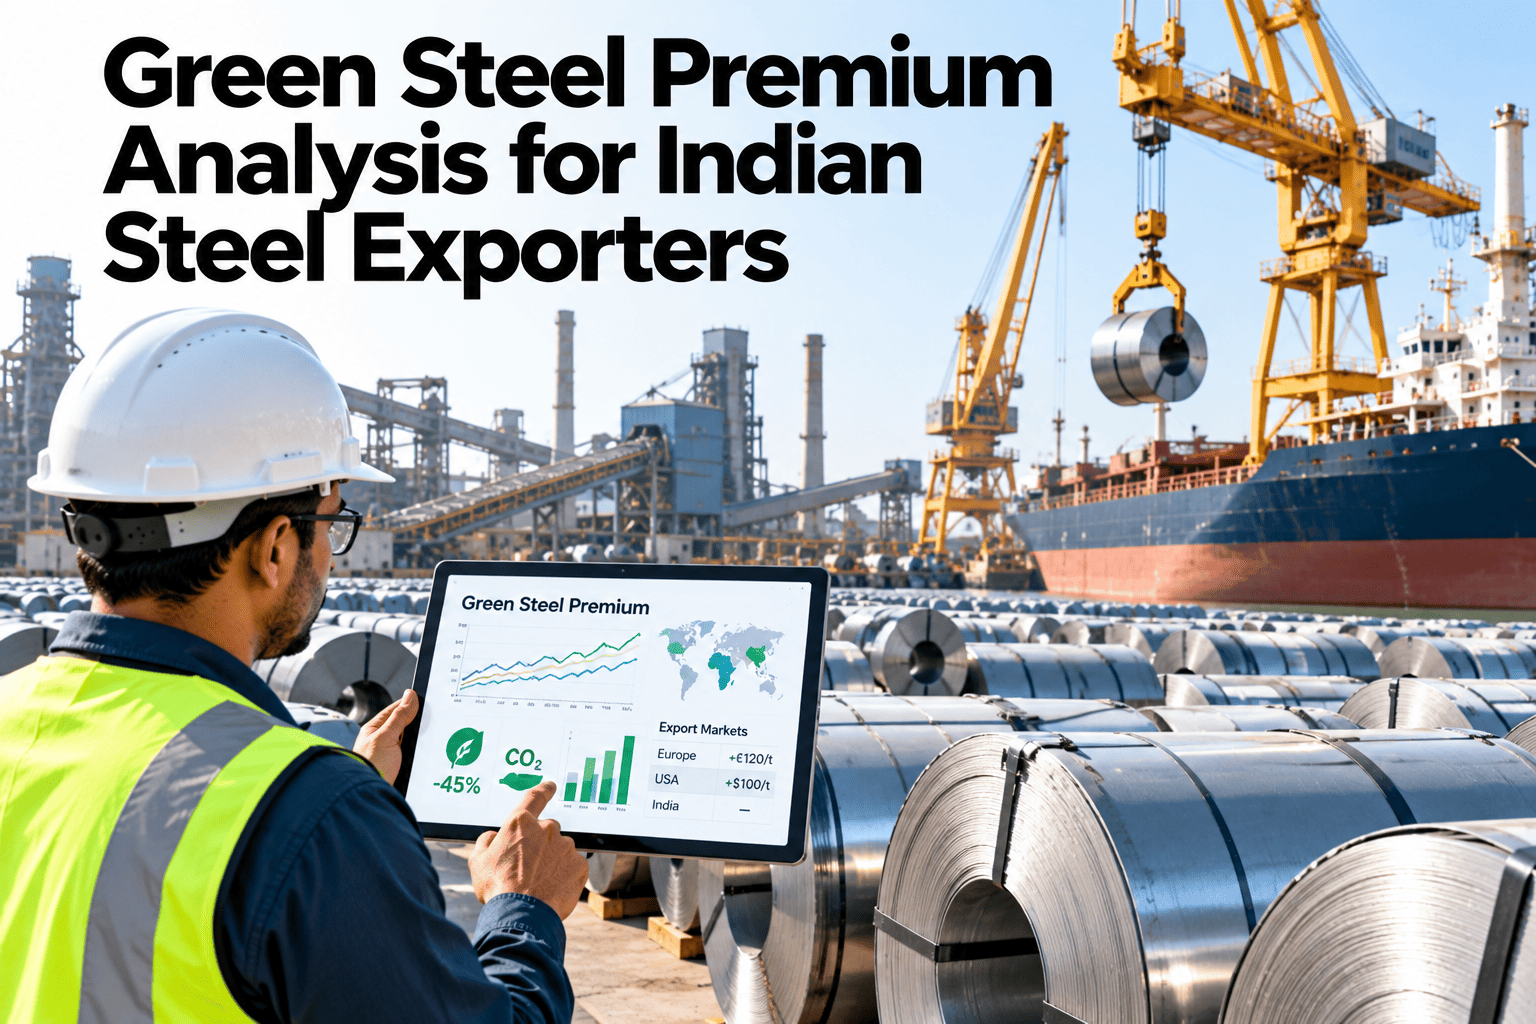
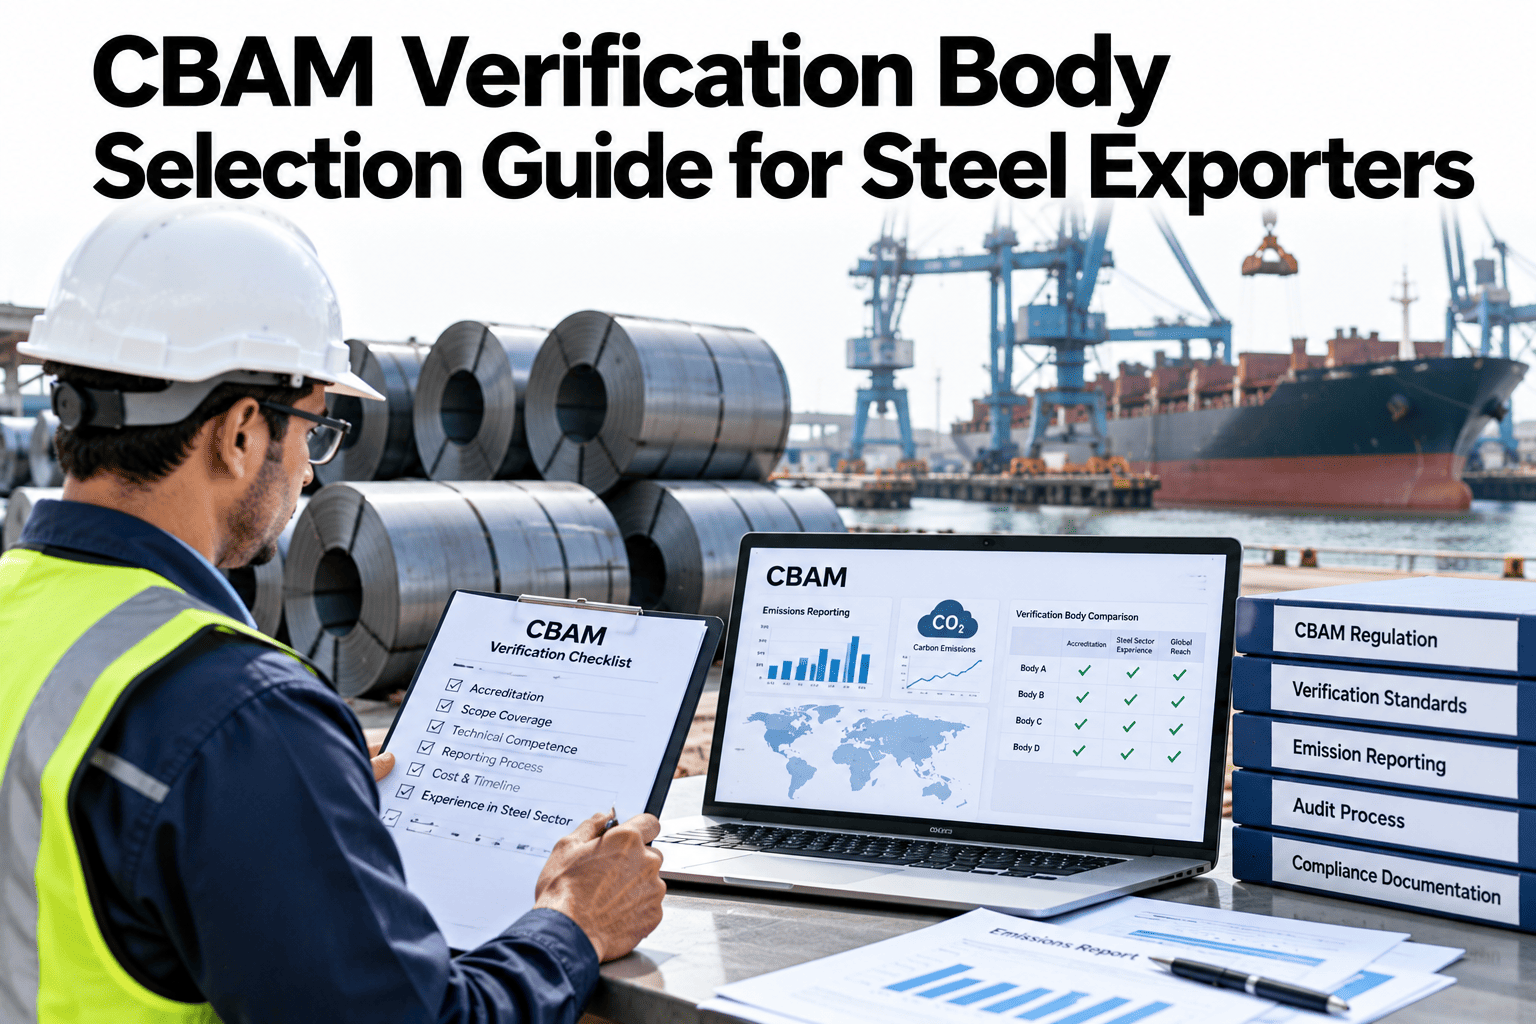
European buyers are paying more attention to the carbon footprint of the steel they buy, and some are willing to pay more for lower-emission products. For Indian exporters, a premium is not automatic. It depends on measured and verified emission intensity, product qualification and a story the buyer can use in their own reporting. India now has an official green steel taxonomy, which gives exporters a common language. To explore your own position, you can discuss a premium positioning plan with our team.
CBAM and green steel positioning for Indian exporters
Turn Lower Emissions Into a Price Advantage With European Buyers
iFactory AI helps Indian steel exporters measure emission intensity, build verified evidence and present low-carbon products in the terms buyers expect.
India taxonomy emission limits in tCO2e per tonne
India's taxonomyA Common Language for Green Steel
India's Ministry of Steel published a green steel taxonomy in December 2024. It defines green steel by emission intensity and rates products with stars.
2.2
Maximum tCO2e per tonne of finished steel for a green rating
3-star
Between 2.0 and 2.2
4-star
Between 1.6 and 2.0
The taxonomy covers Scope 1, Scope 2 and limited Scope 3 emissions up to finished steel. CBAM counts different emissions, so the two figures will not match.
Rating ladderEach Star Level Tells a Buyer Something Different
3-starMeets the green threshold
4-starClearly lower emissions
5-starAmong the lowest emission intensities
BeyondNear-zero or certified low-carbon pathways
Star ratings are an Indian reference. EU buyers may also ask about verified product carbon footprints, environmental product declarations and CBAM data.
What buyers askSix Things European Buyers Look For Before Paying More
1
Verified emission intensity
A number checked by an independent body, not just a claim.
2
Clear system boundary
What is included and what is not, in plain terms.
3
Product qualification
Same mechanical properties and quality as conventional steel.
4
Chain of custody
How low-carbon product is kept separate from standard product.
5
Reliable supply
Volumes, delivery and consistency over time.
6
Documents they can reuse
Declarations that fit the buyer's own reporting.
Find Out What Your Emission Data Can Support
Share your plant data and see how iFactory AI could estimate emission intensity and the evidence buyers expect.
Where the money comes fromA Simple Way to Think About Shared Value
A lower verified emission intensity can reduce the CBAM cost the EU importer faces. That gap is the starting point for price talks. All figures below are illustrative.
Value gap per tonne = (default intensity - actual intensity) x carbon price
0.8
tCO2e per tonne lower than the default
70
Illustrative carbon price per tCO2e
56
Value gap per tonne before other adjustments
Share
Exporter and buyer agree how to split it
Real CBAM costs depend on current rules, free allocation phase-out, any carbon price paid at origin and what verified data shows. Use current guidance for real negotiations.
QualificationCriteria to Meet Before a Premium Is Possible
| Criterion | What buyers expect | What the exporter needs |
|---|
| Emission intensity | Lower and verified | Plant-level data and independent verification |
| Product performance | Same as conventional grades | Test results and consistent quality |
| Traceability | Clear link between product and low-carbon route | Mass balance or segregation system |
| Documentation | Usable certificates and declarations | Digital records and report templates |
| Supply security | Dependable deliveries | Capacity planning and communication |
Buyer segmentsDifferent Customers Value Low Carbon in Different Ways
Automotive
We want to cut the carbon footprint of vehicles and need traceable data.
Construction
We use product declarations in building assessments.
Appliance makers
We need steady supply and credible carbon claims.
Traders and distributors
We pass information to many customers and need simple documents.
Choose two or three segments to lead with, and tailor the evidence to what each segment needs.
PositioningCommodity Pricing Versus Premium Positioning
Commodity approach
Competes mainly on price
Carbon data is an afterthought
Buyers apply default values
No clear story for sustainability teams
Premium approach
Competes on verified value
Carbon data is a sales asset
Buyers can use actual verified values
Clear, documented low-carbon proposition
Premium positioning works only when evidence is strong. To plan your approach, ask our team about low-carbon product positioning.
The pathwayFive Steps to Premium-Tier Positioning
1
Measure
Establish plant and product emission intensity from reliable data.
2
Reduce
Cut emissions through efficiency, fuel and process choices.
3
Verify
Have the numbers independently checked.
4
Document
Prepare declarations and buyer-ready reports.
5
Negotiate
Agree how value from lower emissions is shared.
ReadinessChecklist for Exporters Pursuing a Premium
Plant emission intensity measured and understood
Reduction roadmap with dates and owners
Independent verification planned
Product quality data ready for buyers
Chain of custody method defined
Documents match buyer reporting needs
Target buyer segments chosen
Pricing logic agreed internally
Ways to cut intensitySix Levers Steel Plants Use to Lower Emissions
Lower emission intensity comes from many choices. Most plants combine several.
More scrap
Using more scrap in electric furnaces reduces ore-based emissions.
Cleaner reduction
Shifting reductants in iron production, including future hydrogen readiness.
Energy efficiency
Better heat use, hot charging and combustion control.
Cleaner power
Lower-carbon electricity for electric furnaces and plant loads.
Process optimisation
Fewer rejects, higher yield and steadier operation.
Heat recovery
Capturing waste heat from furnaces and gases.
Efficiency measures often pay back fastest and are a sensible starting point.
Where intensity can fallAn Illustrative View of Reduction Potential
Different levers contribute different shares. This split is illustrative and differs by plant.
30 percent: Process efficiency
Lower fuel and power per tonne.
30 percent: Material mix
More scrap or lower-carbon inputs.
25 percent: Power source
Cleaner electricity supply.
15 percent: Other measures
Heat recovery and innovation projects.
A roadmap needs your own numbers. Start by measuring the current intensity of each product route.
The evidence packFour Layers Buyers Expect to See
Headline figure
A clear emission intensity per tonne for the product.
Method
Boundaries, factors and allocation explained in plain terms.
Verification
An independent report supporting the figure.
Supporting records
Meters, invoices and lab data that back each number.
Buyers will rarely read all of it, but they must be able to find any part quickly.
Readiness levelsThree Stages of Premium Readiness
Starting
Intensity roughly known, no verification yet.
Credible
Method documented, data reliable, verification planned.
Premium-ready
Verified figures, traceability and buyer documents in place.
Be honest about your stage. To assess it, ask our team for a readiness assessment.
Working with a buyerFour Steps in a Premium Conversation
1
Choose the buyer
Pick a customer with a clear need for lower-carbon steel.
2
Share the evidence
Provide figures, methods and verification.
3
Agree specifications
Confirm product quality, volumes and delivery.
4
Agree the price logic
Define how value from lower emissions is shared.
Start with one buyer and one product. A successful first deal creates a template for others.
Negotiating positionHow Evidence Changes the Conversation
Strong evidence shifts discussions from price alone to total value. This view is illustrative.
Unverified offer
Ability to use actual values
Verified low-carbon offer
Ability to use actual values
These bars are illustrative. Buyers differ, and some will not pay a premium regardless of evidence.
Expert reviewWhat a Commercial Sustainability Director Would Check First
Expert review
A premium is earned through evidence and relationships. Treat any quoted premium as a hypothesis to test with specific buyers rather than a number to bank.
VerdictStrong for exporters with verified data and clear traceability.
Watch forMarketing claims that cannot survive a buyer's audit.
Do nextPick one product and one buyer, build the evidence pack and test the conversation.
Frequently asked questionsWhat Indian Exporters Ask About Green Steel Premiums
How large is the green steel premium?
It varies widely by product, buyer, contract and market conditions, and it is not guaranteed. Treat reported figures as a range to test with your own customers rather than a number to assume in a business case.
Test a premium scenario.
Does the Indian taxonomy count for EU buyers?
It gives a clear national definition and star rating, which helps conversations, but EU buyers often also ask for verified emission data, product footprints and CBAM-compatible information. Prepare both.
Ask about aligning evidence.
What is the difference between taxonomy and CBAM figures?
The Indian taxonomy covers Scope 1, Scope 2 and limited Scope 3 emissions up to finished steel, while CBAM for steel counts direct emissions under current rules. Maintain both calculations clearly.
Discuss the two figures.
How do we prove low-carbon product is separate from standard product?
Use a documented chain of custody, such as segregation or a mass balance approach agreed with the buyer and the verifier. Records should link batches to routes and emission data.
Ask about traceability options.
Where should we start?
Measure plant and product emission intensity with reliable data, then pick one product and one buyer for a pilot evidence pack. Learn from that before scaling.
Plan a pilot with one buyer.
Evidence first, premium second
Make Your Lower Emissions Count in the Price
Book a session with iFactory AI to measure emission intensity, build a verified evidence pack and plan conversations with European buyers.