Steel manufacturing in 2026 is a game of razor-thin margins and extreme operational density, where the difference between a market leader and a struggling mill is measured by Overall Equipment Effectiveness (OEE). While the global steel industry average hovers between 55% and 65%, world-class facilities are consistently pushing into the 75–85% range. This 20% gap represents more than just a metric; it is the difference between $15M and $50M in annual EBITDA for a typical integrated mill. Achieving these targets requires moving beyond manual production logs and end-of-shift spreadsheets. iFactory's OEE Tracking and Analytics platform provides an unblinking, real-time view into the "Hidden Factory"—automatically capturing Every micro-stop, speed loss, and yield variance. By integrating directly with PLC data and AI-driven quality inspection, iFactory gives steel producers the precision they need to eliminate the "invisible" losses that steal capacity and erode profitability.
Steel Industry OEE Benchmarks: World-Class Performance in 2026
How does your mill compare? Master the benchmarks for world-class OEE—availability, performance, and quality standards that define the top 5% of steel producers globally.
Top 5 OEE Performance Gaps — Where Steel Mills Lose Capacity
Most steel plants lose 20-30% of their theoretical capacity to losses that go unrecorded in traditional logbooks. iFactory's AI engine categorizes these losses in real-time — identifying precisely "where the time went" and how to recover it.
Unplanned Equipment Downtime
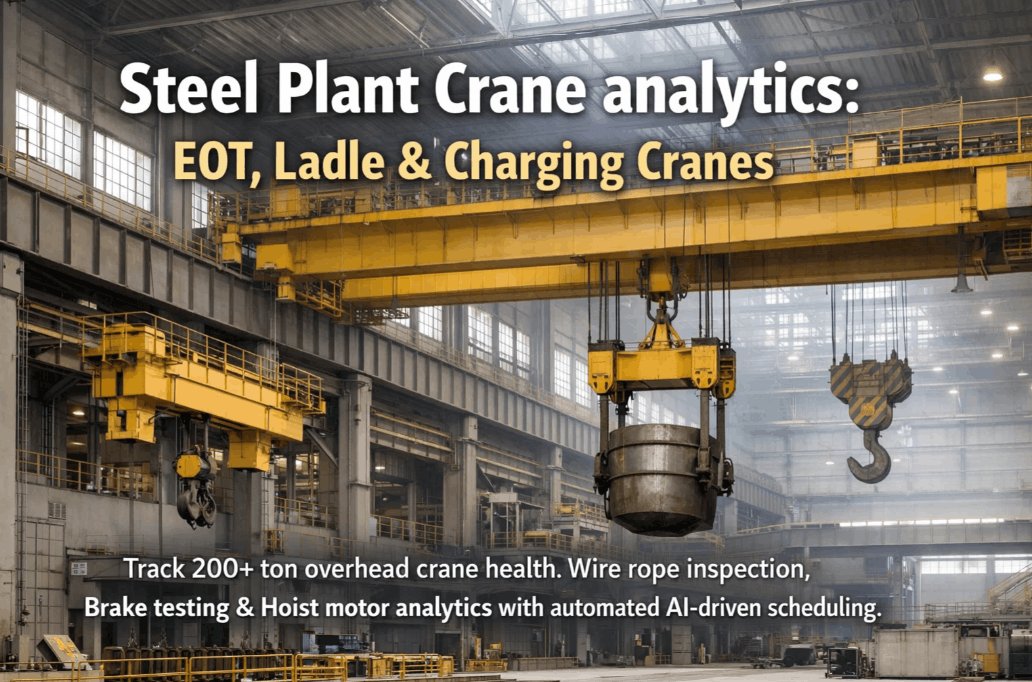
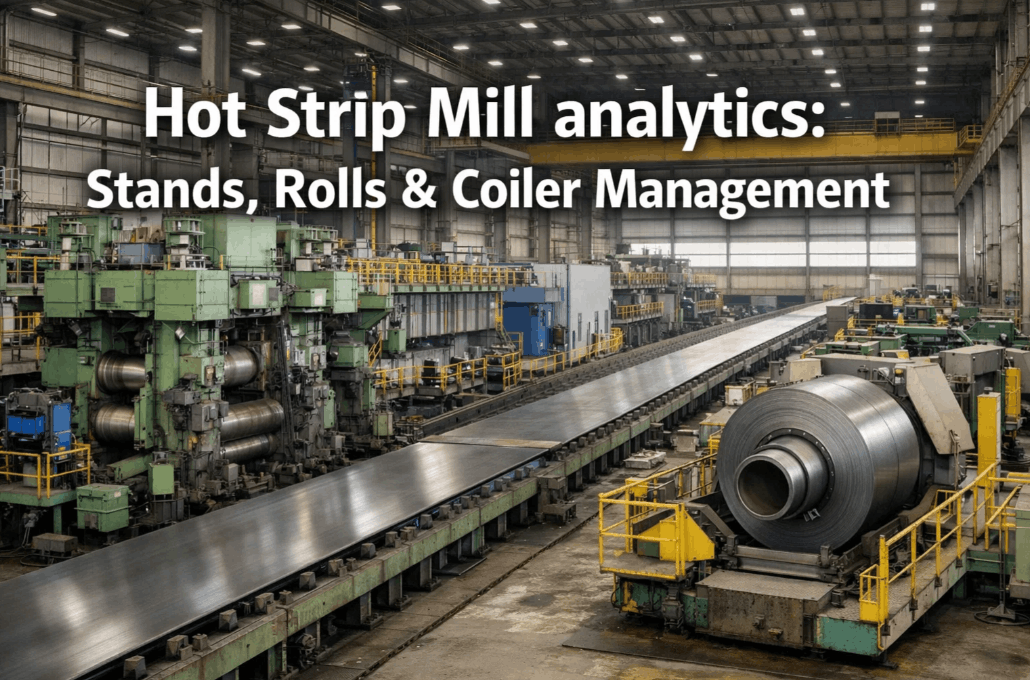
The most visible loss. Hydraulic failures, motor burnouts, and sensor faults. 1 hour of downtime on a hot strip mill can cost $100K in lost throughput.
Speed Loss (Reduced Rates)
Running below nameplate capacity to "protect" tired equipment or compensate for material variability. Often the largest "hidden" loss.
Micro-Stops & Idling
Frequent, short interruptions (< 5 mins) that operators rarely log. iFactory's PLC integration captures every second of lost time.
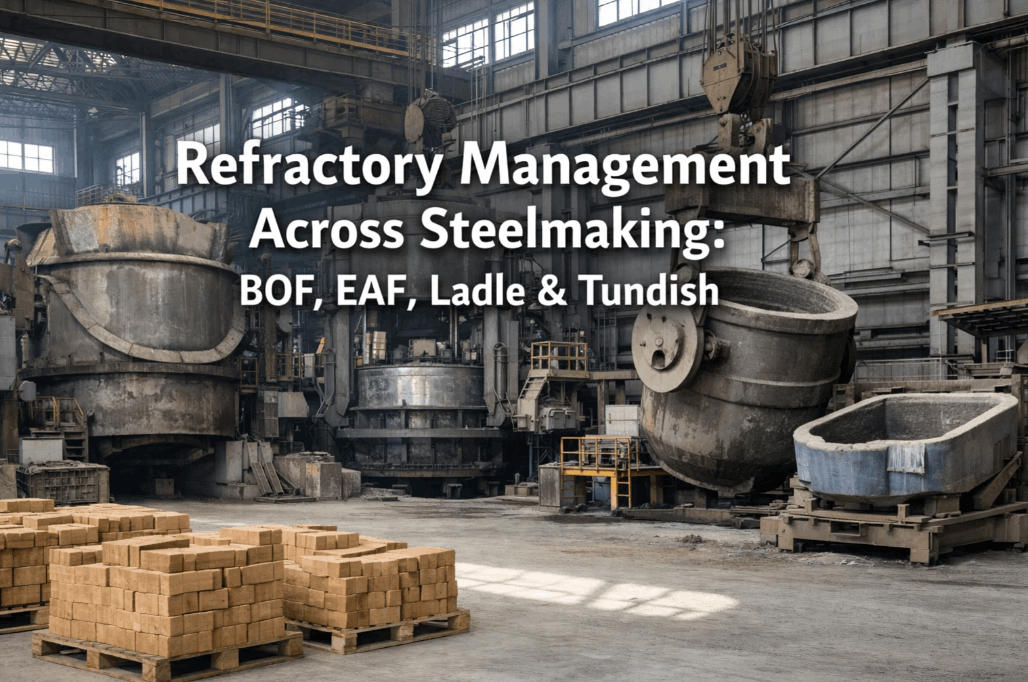
Scrap & Process Yield Loss
Material rejects from off-spec chemistry, surface defects, or dimensional variance. High rework rates drastically lower the final OEE score.
Setup & Changeover Time
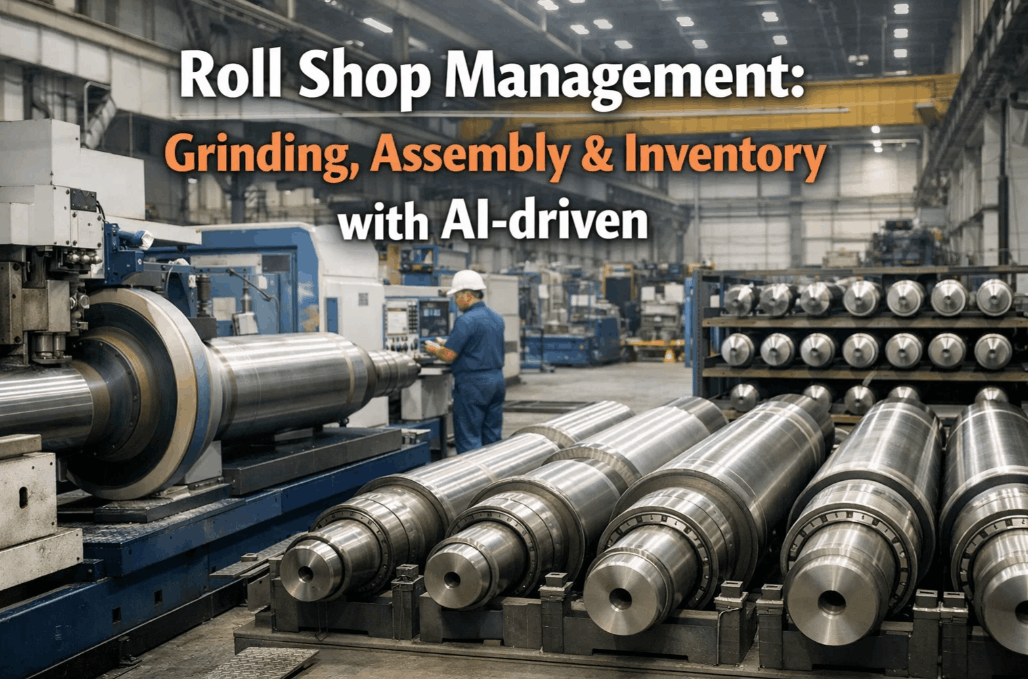
Roll changes and grade transitions. World-class plants use iFactory to track "Last Good Out" to "First Good In" to benchmark changeover speed.
Steel Plant OEE Zones — Benchmarking Your Mill's Health
Where does your facility sit? OEE benchmarking isn't just about the final number; it's about identifying the specific "Health Zone" that determines your plant's competitive position in the global market.
Maximum profitability. Automated systems. High agility.
Good performance. Opportunity in speed optimization.
Frequent stops. Manual logs. High variance.
Mill is bleeding money. Chronic unavailability.
OEE Optimization Journey — From Manual Logs to AI Analytics
The transition to world-class OEE is a phased evolution. iFactory manages each stage of this lifecycle — ensuring your digital transformation delivers measurable ROI at every step. Consult with our steel specialists to map your OEE journey.
Baseline Setup
Connect PLC/SCADA. Capture every downtime event. Eliminate manual reporting logs.
Root Cause Mapping
Identify the "6 Big Losses." Categorize reasons for stops. Find the hidden factory bottlenecks.
Aimed Actions
Targeted maintenance. Speed optimization. SMED projects for roll changes.
Future-Proofing
AI-driven predictive maintenance. Autonomous performance tuning. Global excellence.
How iFactory Powers World-Class Steel OEE Scores
Unblinking State Logic
Downtime events are auto-triggered from motor current and strip tension. No more "pencil-whipping" logs or hidden 5-minute coffee breaks as unplanned downtime.
AI Performance Index
Machine learning analyzes the gap between your design speed and operating speed — automatically surfacing the root causes for "running slow" like pump cavitation or bearing heat.
Quality Sync Engine
Integrates directly with spectrometer data and surface inspection cameras. iFactory auto-deducts off-spec material weight from OEE in real-time for an accurate yield score.
Shift Variance Reporting
Automatically compares performance across shifts and crews. Identify best practices from your top teams and standardize them across the whole mill.
Steel OEE Benchmark Matrix — 2026 Standards
| Metric Component | Average | Good | World-Class | Goal |
|---|---|---|---|---|
| Availability Rate | 75% | 85% | 92% | 95% |
| Performance Rate | 80% | 88% | 95% | 98% |
| Quality/Yield Rate | 92% | 96% | 99% | 99.5% |
| Planned Setup Time | 15% | 10% | 5% | < 3% |
| Unplanned Stop Frq. | High | Med | Low | Zero-Fail |
| Final OEE Score | ~55% | ~72% | > 85% | Continuous |
What a Continuous Casting Supervisor Said
Our mill had an 18% 'Hidden Performance' gap that we didn't even know existed until we integrated iFactory. We were over-lubricating based on old timers' advice, which was actually causing speed losses at high torque. iFactory's AI identified the correlation and by adjusting the lube cycles, we recovered 4% OEE—or roughly $4.8M in annual capacity—with zero capital investment.
Frequently Asked Questions
What is considered a "good" OEE score for a steel plant?
Most high-performing steel plants achieve an OEE of 65-75%. Anything above 80% is considered world-class and typically requires fully automated digital tracking systems.
Why is steel OEE benchmarked lower than other discrete industries?
The extreme heat, chemical volatility, and continuous heavy loading in steel mills make availability more challenging than in a clean automotive or consumer goods plant.
Does iFactory identify speed loss root causes?
Yes — iFactory correlates PLC speed signals with power draw and chemistry data to determine if slow running is a technical fault or a feedstock quality issue.
How long does it take to see OEE improvements after installation?
Most iFactory users identify their top 3 "Loss Bottlenecks" within the first 30 days. Actionable improvements usually lead to a 2-4% OEE lift by Month 3.
Close Your Performance Gap with iFactory
Turn your losses into millions in additional capacity.