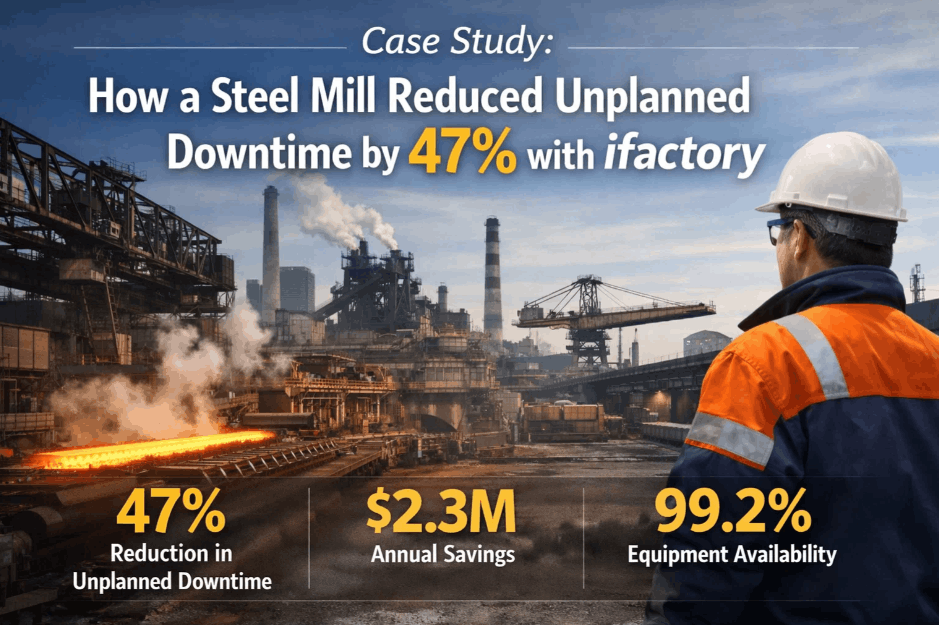
When the maintenance and operations leadership of a 2.2 MTPA integrated flat-steel producer in central India commissioned iFactory's OEE Tracking and Analytics platform in January 2024, their hot strip mill was running at 58% OEE — a figure that placed them 20 percentage points below world-class benchmark and was costing the business an estimated $18.4 million in recoverable production value annually. The plant's management team had two previous failed attempts at OEE improvement: one through a manual logsheet digitisation programme that operators abandoned within 60 days, and one through a standalone MES module that produced weekly reports nobody acted on. What made this attempt different was the decision to connect directly to the PLC — automating 100% of downtime classification without operator input — and to make OEE data visible on the shop floor in real time, not in a weekly PDF. Nine months later, the plant's hot strip mill OEE stood at 82%: a 24-point improvement representing $11.2 million in additional production value, achieved entirely from existing installed capacity. This case study documents the exact methodology, the specific actions that drove the largest OEE improvements, and the lessons that apply to any steel plant beginning a similar journey.
OEE Improvement Case Study: Steel Plant Achieves 82% OEE from 58% in 9 Months
A 2.2 MTPA flat-steel producer improved OEE by 24 percentage points — recovering $11.2M in annual production value — using iFactory's integrated analytics and real-time OEE tracking platform.
The 58% Starting Point — What Was Broken and Why
Before diagnosis, leadership assumed the primary losses were equipment breakdowns. Real-time PLC data told a completely different story. The largest losses were invisible in the manual reporting system entirely — because they occurred in durations under 5 minutes that no operator recorded.
The 9-Month OEE Journey — Month by Month Progress
The transformation followed a deliberate phase sequence — Visibility first, then targeted action, then optimisation. Each phase built on the data generated by the previous one. OEE was not improved by doing more maintenance — it was improved by doing the right maintenance, on the right assets, at the right time.
Before vs After — 9-Month Results Verified by Plant Finance
All results below were validated by the plant's finance and operations teams at Month 9 audit. Production values use the plant's internal realisation rate of $482/tonne for hot-rolled coil.
How the $11.2M Was Built — Value Source by Source
The $11.2M recovery was not a single large intervention — it was the accumulation of many targeted improvements, each identified by the OEE data. Here is how the value stacked up by category.
What the VP Operations Said at Month 9 Review
We tried OEE improvement twice before and failed both times. The difference with iFactory was that we finally saw the real losses — not the losses that operators were willing to write in a logsheet. 9.4 OEE points were disappearing in micro-stoppages under five minutes that had never been recorded in our 14 years of operation. That data — and only that data — made the right improvement priorities obvious. Month 3 alone recovered $1.8M that we had been leaving on the table every single month.
Frequently Asked Questions
How long does it take to see the first OEE improvement after iFactory goes live?
In this plant, the first 3pp OEE improvement came in Month 1–2 — before any physical improvements were made. This gain came purely from more accurate measurement: removing incorrectly claimed planned downtime and making micro-stoppages visible for the first time. Physical improvements that drove further gains followed in Month 3 once the top loss causes were clear.
Is 82% OEE achievable without investing in new equipment?
Yes — 100% of this plant's OEE improvement came from existing installed capacity. No new equipment was purchased. The gains came from eliminating losses that already existed but were invisible: micro-stoppages that no one counted, speed reductions that no one measured, and defects whose root causes no one had data to address. iFactory makes the invisible visible — and then actionable.
What was the single biggest lever in this OEE improvement?
Micro-stoppage elimination — eliminating the 9.4pp invisible loss in stops under 5 minutes — contributed $4.6M and +6.6pp OEE on its own. The key enabler was PLC micro-stop capture, which revealed 387 stops per week that never appeared in any manual log. Targeting the top three causes (descaler nozzles, looper control, crop shear) delivered the bulk of that improvement within 60 days.
How does this case study apply to my specific steel plant or production line?
The specific loss breakdown will differ by plant — some plants have more quality loss, some more breakdown loss. But the methodology is universal: connect to your PLC to see real losses, Pareto the losses to find the highest-value targets, and execute targeted improvement in sequence. iFactory builds your plant's specific OEE loss waterfall within 48 hours of PLC connection, so you can see exactly which version of this journey applies to you.
See Your Plant's Real OEE Loss Map in 48 Hours
We'll connect to your PLC and show you exactly where your OEE is going — micro-stop by micro-stop — in the first 48 hours.