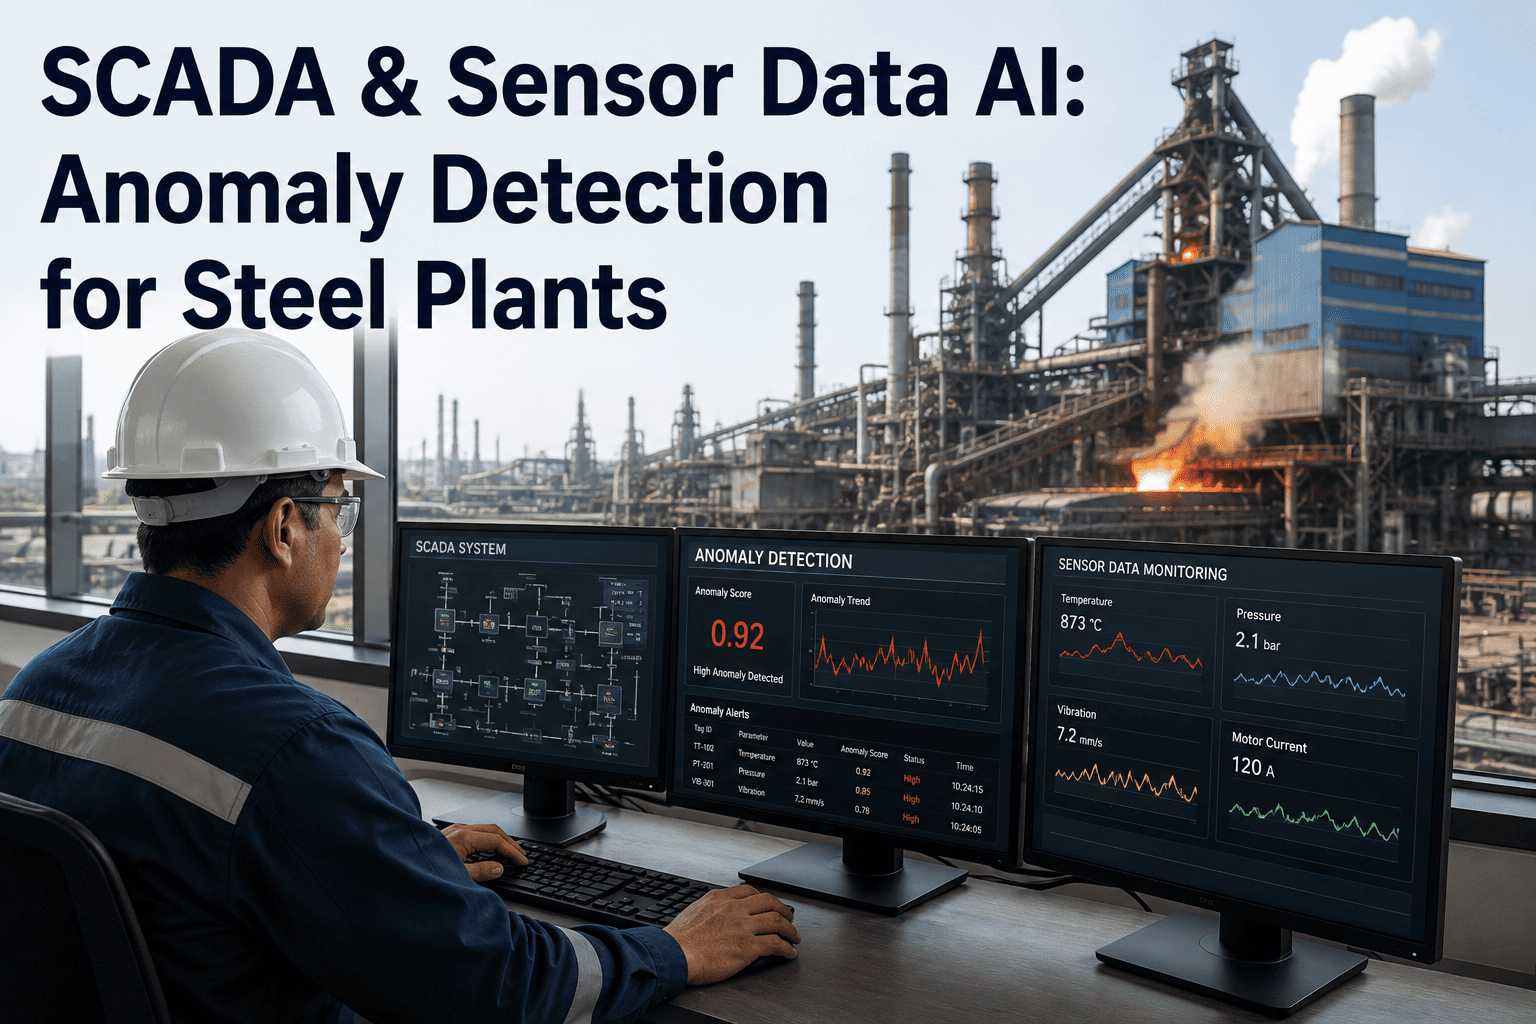
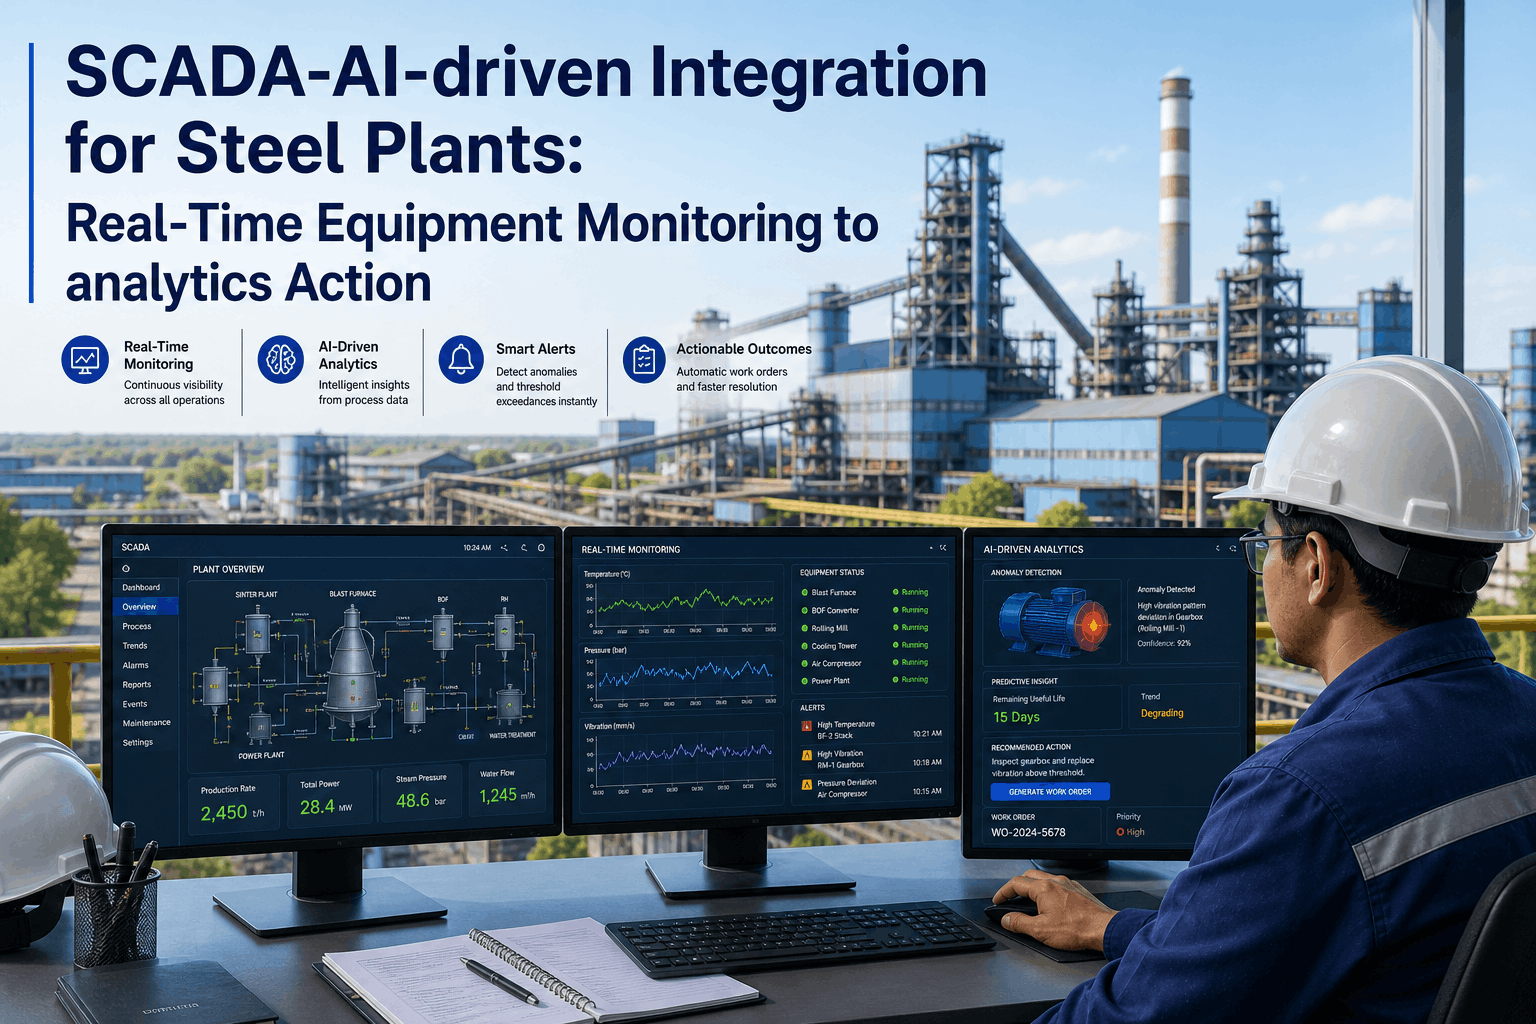
A SCADA system in an integrated steel plant can hold thousands of live tags, and every one of them is watched by the same basic logic: is this single value above or below a fixed threshold. That logic catches the failures that announce themselves loudly, a bearing that overheats past its limit, a pressure that spikes past its trip point. It structurally cannot catch the failures that develop as a change in the relationship between several sensors, none of which individually crosses any alarm limit. A cooling water flow at 92 percent of nominal, a temperature differential at 88 percent, a pressure drop at 95 percent — each looks fine alone, yet together they can be the exact signature of a developing fouling condition weeks before any single tag would ever alarm. iFactory's AI anomaly detection layer sits on top of your existing SCADA and sensor infrastructure specifically to catch that second category of failure — book a demo to see it run against your own plant's tag history.
STEEL PLANT AI · PREDICTIVE ANALYTICS · SCADA & SENSOR DATA
The Failure Was Never in One Sensor, It Was in How Three Sensors Stopped Agreeing
iFactory learns the normal relationships between every sensor pair across your steel plant's SCADA and IIoT data, then flags the moment those relationships break, catching degradation weeks before any single tag would cross a threshold alarm.
A WALKTHROUGH
What a Multi-Variable Failure Actually Looks Like Before It Fails
The clearest way to understand why threshold alarms miss so much is to walk through a real degradation pattern the way it actually develops, one week at a time, across three sensors that individually never leave their normal operating range.
WEEK 1
Flow: 98% · ΔT: 97% · ΔP: 98%
All three readings sit comfortably inside normal range. No alarm exists that would even register this as worth watching.
→
WEEK 2
Flow: 95% · ΔT: 93% · ΔP: 96%
A slight drift in all three, still individually unremarkable. A threshold system sees three healthy numbers.
→
WEEK 3
Flow: 92% · ΔT: 88% · ΔP: 95%
Still inside every individual alarm limit, but the correlation between the three variables has now broken in a specific, recognizable pattern.
→
WEEK 6+
A threshold finally trips
By the time any single sensor crosses its fixed limit, the underlying condition, commonly fouling or a developing blockage, has had weeks to progress unaddressed.
The multivariate anomaly engine catches this exact pattern at week three, not week six, because it is not asking whether any one number is out of range. It is asking whether the mathematical relationship between flow, temperature differential, and pressure drop still matches what normal operation looks like for this specific piece of equipment, and it flags the moment that relationship changes even while every individual reading stays technically healthy.
WHY THRESHOLDS STRUCTURALLY MISS THIS
The Alarm Logic Built Into Most SCADA Systems Was Never Designed for This Problem
This is not a criticism of SCADA systems or the engineers who configured their alarms. Fixed-threshold alarming is the right tool for the job it was built for, catching a value that has already crossed a known danger point, and it does that job reliably. The gap exists because a different category of failure needs a fundamentally different kind of detection logic.
01
One Tag, One Rule
A threshold alarm evaluates each sensor tag in isolation, with no awareness of how it relates to any other tag in the plant.
02
No Concept of "Normal for This Asset"
A fixed limit applies the same threshold regardless of production grade, ambient conditions, or the specific equipment's own historical baseline.
03
Blind to Gradual, Correlated Drift
A slow, multi-week drift across several related variables produces no single crossing event for a threshold system to react to.
04
Reacts After the Fact, Not Before
By design, a threshold alarm fires only once the dangerous condition has already fully developed, leaving no advance warning window.
None of these four limitations are a flaw in SCADA architecture, they are simply outside what fixed-threshold logic was ever meant to do. Multivariate anomaly detection is not a replacement for threshold alarming, it is the layer that catches what threshold logic was structurally never designed to see. A plant that layers both approaches together gets the best of each: immediate reaction to a value that has clearly crossed a known danger line, and early warning for the slower, correlated drift that never produces a single crossing event at all.
See what your SCADA tags are already telling you
iFactory's anomaly engine runs against your historical tag data to show which sensor relationships have already started drifting, before you commit to a full deployment.
HOW THE MODEL LEARNS "NORMAL"
Building a Baseline That's Specific to Your Equipment, Not a Generic Average
The anomaly engine's usefulness depends entirely on how well it understands what normal actually looks like for a specific asset under specific conditions, and that understanding is built directly from your plant's own historical data rather than an industry-generic assumption.
1
Ingest Historical SCADA, PLC, and Historian Data
Existing tag history is pulled in as the starting foundation, so the model learns from your plant's actual operating record rather than starting from zero.
2
Establish Per-Asset Baselines Across Production Grades
Normal operating relationships are learned separately for each asset and, where relevant, for each production grade, since "normal" for one grade can look like a warning sign for another.
3
Filter Out Self-Correcting Transients
Short-lived fluctuations that resolve on their own are recognized and suppressed, which is what keeps the system from flooding the team with false positives in its early weeks.
4
Score Live Data Against the Learned Relationships
Every new reading is evaluated not in isolation but against how it fits the learned correlation pattern across its related sensors, producing a deviation score rather than a pass-or-fail check.
5
Generate a Work Order on Confirmed Deviation
Once a deviation score crosses a configured confidence threshold, a work order is created automatically, populated with the telemetry curve that triggered it rather than a generic alert.
This baseline period typically runs several weeks of normal operating data before the model is confident enough to flag deviations reliably, which is why the deployment timeline below treats baseline establishment as its own distinct phase rather than something that happens instantly at go-live. Skipping or rushing this phase is the most common reason an anomaly detection rollout underdelivers in its first quarter — a model trained on too little historical variation mistakes normal seasonal or grade-driven fluctuation for a genuine anomaly, and the resulting false-positive rate is what erodes a maintenance team's trust in the system before it has had a fair chance to prove itself.
WHERE THIS APPLIES ACROSS THE PLANT
The Equipment Categories Where Correlated Drift Matters Most
Multivariate anomaly detection adds the most value on equipment where a single-point failure is expensive and where the degradation pattern genuinely shows up as a multi-sensor signature rather than a single clean threshold crossing.
Blast Furnace Refractory and Cooling
Stave cooler temperature arrays and cooling water flow analysed together reveal refractory wear and channel blockage patterns well before a single sensor would trip.
Caster Mold and Segment Rollers
Mold thermocouple correlation patterns can flag breakout precursors, and segment roller vibration analysed against load and speed catches quality-affecting drift early.
Rolling Mill Drive and Bearing Systems
Vibration, motor current, and thermal signatures analysed jointly catch bearing degradation and chatter conditions that account for a large share of unplanned hot strip mill downtime.
Plant Utility and Rotating Equipment
Compressors, pumps, fans, and cooling towers show degradation across vibration, current draw, and temperature together well before any one reading alone looks abnormal.
SENSOR HEALTH IS PART OF THE PICTURE
Catching a Failing Sensor, Not Just a Failing Machine
An underappreciated benefit of correlation-based detection is that it does not only catch equipment degradation, it also catches a sensor that is quietly failing. A thermocouple drifting out of calibration or an intermittent flow meter produces readings that can each look individually plausible while breaking the expected relationship with neighboring sensors on the same asset.
This distinction matters operationally: a maintenance team dispatched on a false equipment alarm caused by a bad sensor wastes time and erodes trust in the system, while a genuinely degrading sensor left uncorrected can eventually mask a real equipment problem behind unreliable readings. Flagging the correlation break lets a process engineer distinguish between the two cases early, rather than discovering the difference only after an unnecessary teardown or a missed real failure. This dual capability is also why the anomaly engine's value compounds over time rather than staying flat: every sensor replacement or recalibration event feeds back into the model's understanding of that asset, sharpening future deviation scores rather than requiring a fresh baseline from scratch each time.
TURNKEY DELIVERY
How iFactory Builds This Into Your Plant's Existing SCADA Environment
The anomaly detection layer connects to what you already have rather than requiring a rip-and-replace of your control system. The rollout is staged so value shows up well before the entire plant is instrumented.
What Gets Built
Direct connection to existing SCADA, PLC, and historian tag data
Per-asset, per-grade baseline models trained on your own operating history
Multivariate deviation scoring with automatic work order generation
Sensor health monitoring alongside equipment condition monitoring
24×7 remote monitoring with alerting on confirmed deviation events
Deployment Timeline
Weeks 1–4: SCADA and historian connection, Tier 1 asset selection, data pipeline setup
Weeks 5–8: Baseline establishment from 2–4 weeks of normal operating data, initial model tuning
Weeks 9–12: Go-live with deviation alerting, validation against real maintenance outcomes
FREQUENTLY ASKED QUESTIONS
What Steel Plants Ask Before Adding AI Anomaly Detection to SCADA Data
Does this replace our existing SCADA alarms, or work alongside them?
It works alongside your existing threshold alarms rather than replacing them, since fixed-threshold alarming remains the right tool for catching a value that has clearly crossed a known danger point. The anomaly detection layer adds the category of detection threshold alarms were never designed to provide — catching a multi-sensor correlation break while every individual reading still sits inside its normal range. Both systems keep running, each catching the failure type it is actually suited for.
Book a demo to see how the two layers work together on your specific tag configuration.
How much historical data do we need before the anomaly model actually works?
Baseline establishment typically draws on two to four weeks of normal operating data per asset to produce a reliable initial model, though plants with rich existing historian records can often accelerate this by feeding in a longer historical window from the start. The model continues refining its understanding of normal behavior as more live data accumulates after go-live, so early alerts get progressively more precise rather than staying fixed at their initial accuracy.
Contact our support team to review what your existing historian data would support for baseline speed.
Won't a system this sensitive just flood our team with false alarms?
This is exactly what the transient-filtering step in baseline training is designed to prevent — short-lived fluctuations that resolve on their own are recognized and suppressed during model training, rather than treated as deviations worth flagging. The system is also tuned to score a confidence-weighted deviation rather than firing on any minor correlation wobble, and that confidence threshold is configurable based on how conservative or aggressive your team wants the alerting to be during the early tuning period.
Book a demo to review real deviation-scoring examples against false-positive rates.
Do we need to instrument our entire plant before seeing any results?
No, the recommended approach starts with a focused set of Tier 1 critical assets, typically ten to twenty pieces of equipment selected for where unplanned failure costs are highest and where degradation signatures are most detectable in advance, rather than requiring full-plant instrumentation before go-live. Results and ROI from that initial scope inform where to expand next, so the deployment grows based on proven value rather than a large upfront commitment.
Contact our support team to identify which assets in your plant would make the strongest starting scope.
Can this also tell us when a sensor itself is failing, not just the equipment?
Yes, this is a direct consequence of how correlation-based detection works — a drifting thermocouple or an intermittent flow meter breaks its expected relationship with neighboring sensors on the same asset in a recognizable way, distinct from the signature of genuine equipment degradation. Being able to tell the two apart early prevents both an unnecessary teardown chasing a phantom equipment fault and the risk of a failing sensor masking a real problem behind unreliable readings.
Book a demo to see a sensor-health deviation example alongside an equipment-degradation example.
SEE THE PATTERN YOUR THRESHOLDS ARE MISSING
Find the Correlation Breaks Hiding in Your Own SCADA Data
iFactory's anomaly engine learns the relationships between every sensor pair on your critical assets, then flags the moment those relationships change, weeks before any single tag would ever cross a threshold alarm.