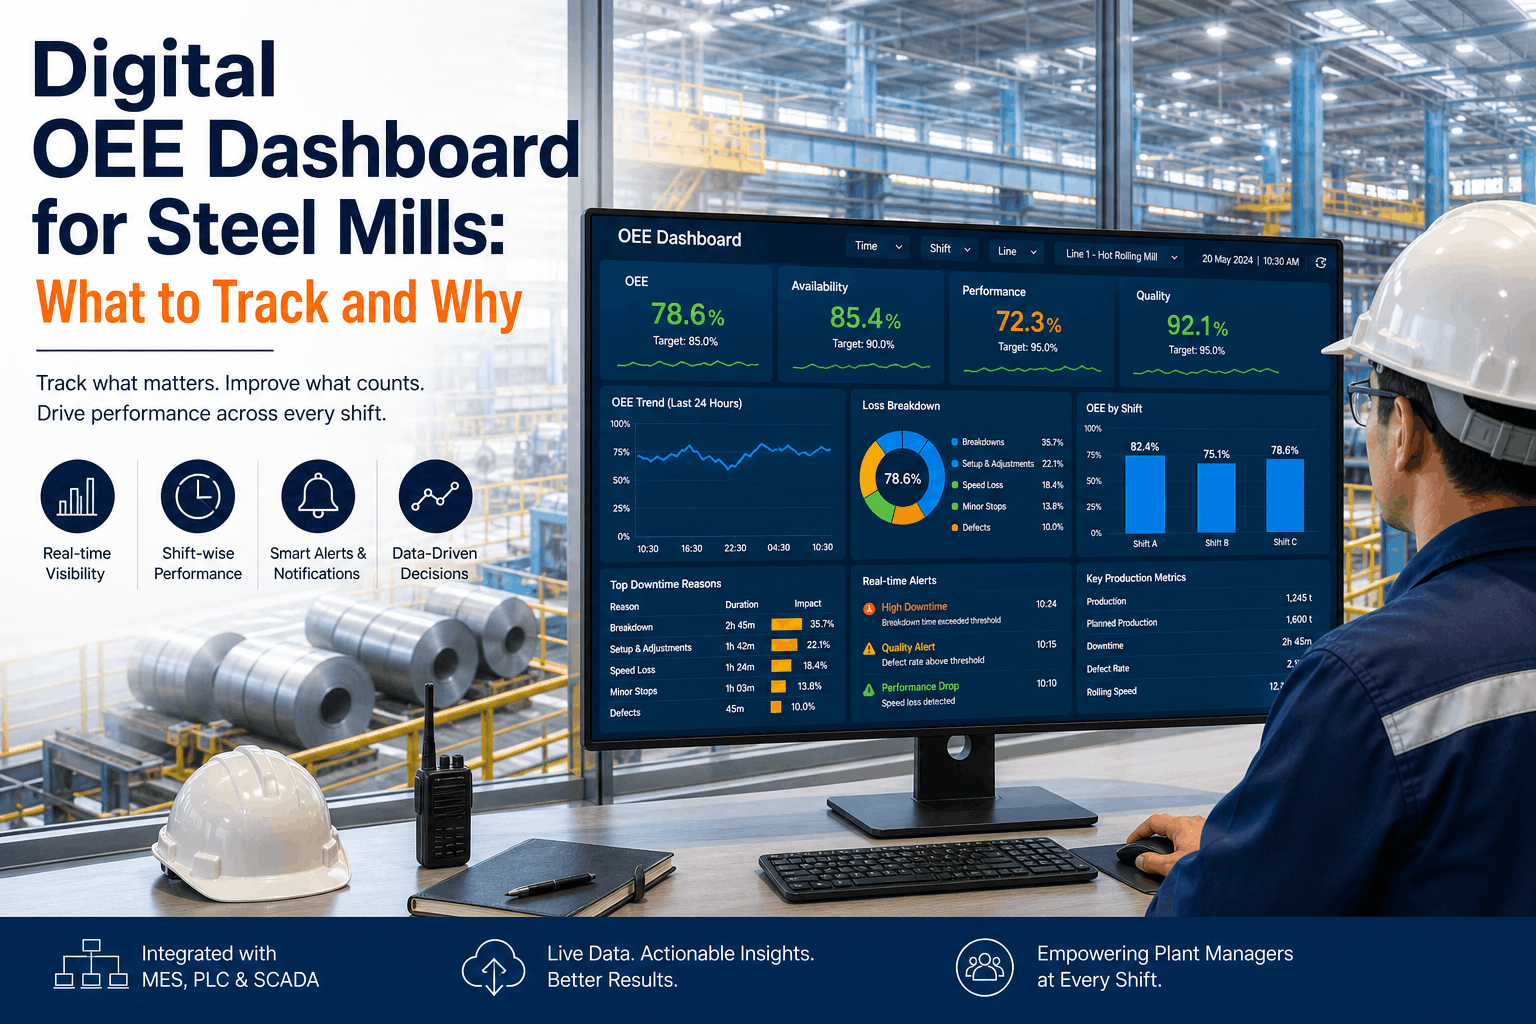
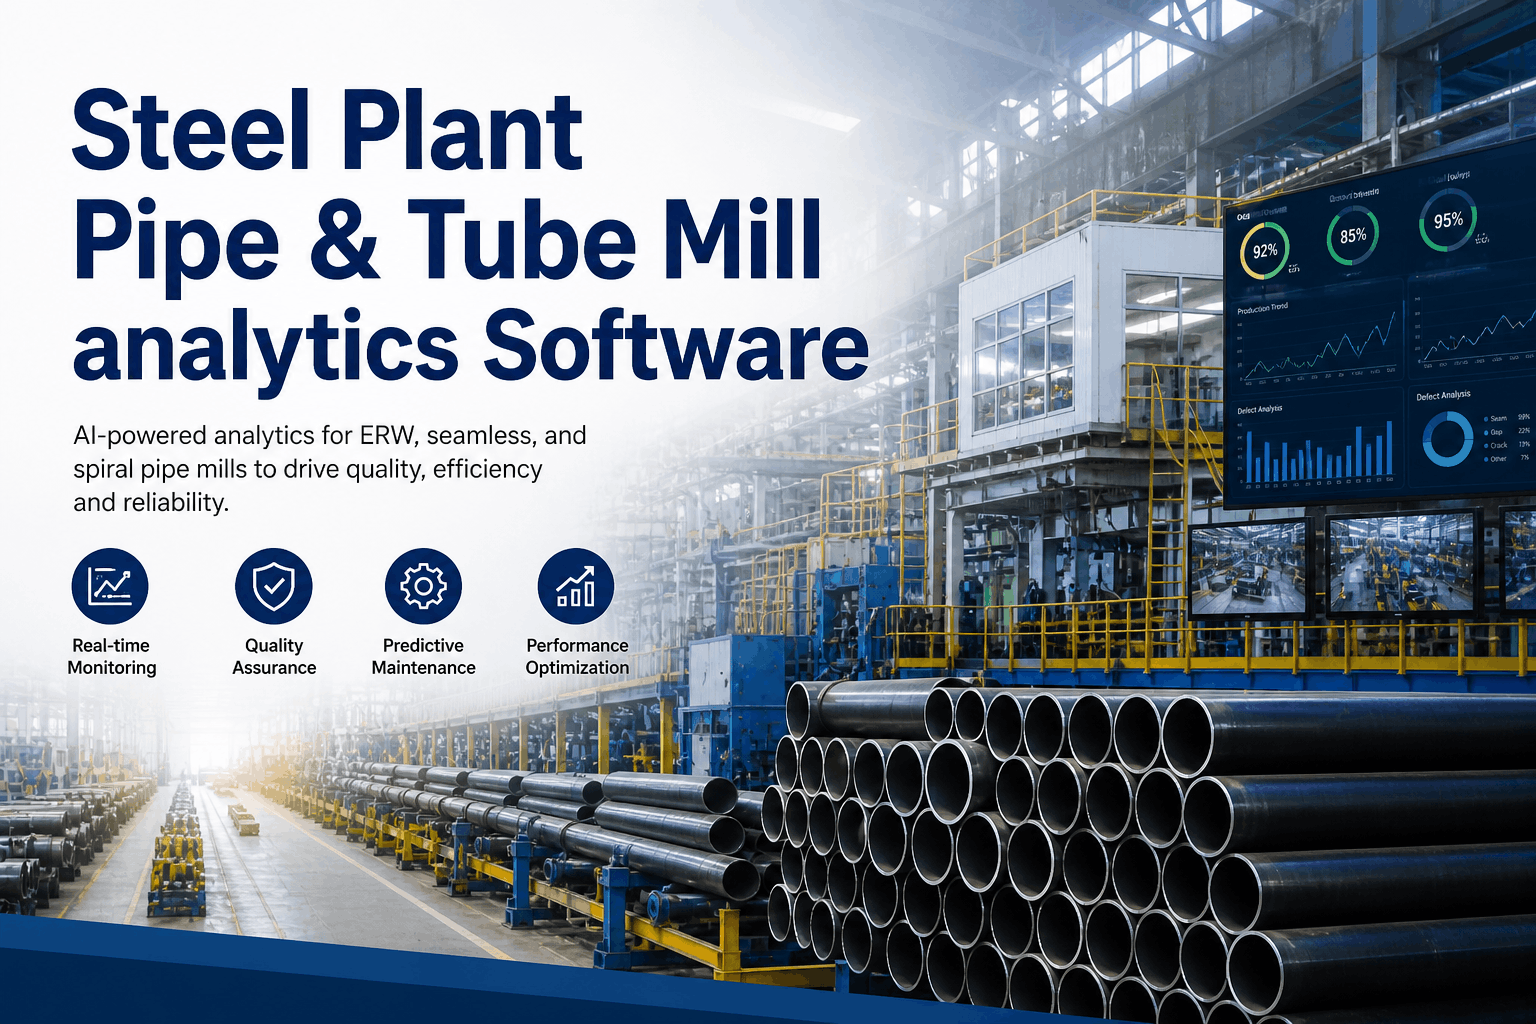
India's steel industry is the second largest in the world by volume — and the competitive pressure that comes with that scale is not abstract. With 140+ million tonnes of annual production capacity a domestic market that swings between infrastructure-led demand surges and price-correction cycles, and an export environment shaped by global overcapacity, Indian steel mills — from SAIL's integrated plants at Bhilai and Bokaro to JSW's coastal EAF operations at Dolvi and Vijayanagar to Tata Steel's blast furnace complex at Jamshedpur — compete on the thinnest margins in the global steel trade. The difference between a profitable quarter and a loss-making one, at current domestic HRC pricing between ₹52,000 and ₹58,000 per tonne, is frequently measured in the efficiency of the production equipment the mill already operates. Overall Equipment Effectiveness — the single metric that captures Availability, Performance, and Quality loss in one number — is the lever Indian steel producers control that iron ore import pricing, railway freight rates, and power tariff structures do not. The industry median OEE for Indian steel facilities sits near 62 to 67%. World-class performance is 85%. That gap, at a facility producing 3 to 5 million tonnes annually at current pricing, represents $12 to $22 million in annual production value sitting in equipment that is running below its engineered capability. iFactory's AI-driven analytics platform is purpose-built for Indian steel operations: CPCB compliance integration, multi-language support including Hindi, India-specific regulatory templates, and an OEE tracking and predictive maintenance architecture calibrated to the specific equipment mix, raw material variability, and operational environment of Indian steel mills. Facilities deploying iFactory's analytics platform achieve 9 to 15 percentage point OEE improvements within 12 months, recover $10 to $20 million in annual production value, and build the data infrastructure that supports Make in India competitiveness requirements at every scale of operation.
Why Indian Steel Mills Need Analytics Software Built for India — Not Adapted from Western Platforms
The analytics platforms that dominate steel industry software in North America and Europe were architected for the operating environment of those markets: stable power grid connectivity, predictable raw material quality from contracted domestic sources, regulatory frameworks built around EPA and OSHA compliance structures, and English-language interfaces designed for workforces with graduate-level technical training at every shift supervision tier. Indian steel operations present a fundamentally different set of conditions that generic analytics platforms were not designed to handle. Power grid variability at Indian steel locations — particularly in Odisha, Chhattisgarh, and Jharkhand, where a significant share of integrated mill capacity is concentrated — creates load-shedding events and voltage fluctuations that a standard OEE Availability calculation treats incorrectly if the platform does not distinguish planned power outages from equipment failures. Raw material variability in Indian iron ore — with Fe content ranging from 58% to 67% across domestic supply sources and significant moisture and size variation — creates process parameter ranges that require India-calibrated process control benchmarks, not the narrower tolerances appropriate for Australian or Brazilian ore-fed operations. CPCB (Central Pollution Control Board) compliance reporting requirements create a data collection and aggregation obligation that runs parallel to production analytics but must be integrated into the same data infrastructure to be manageable at scale. And multi-language workforce interfaces — Hindi, Odia, Chhattisgarhi, Telugu, Tamil — are not a localization nicety for Indian steel mills; they are an operational requirement for shift-level data entry accuracy that directly affects OEE measurement quality.
iFactory's India-specific analytics platform addresses each of these conditions with purpose-built functionality rather than workaround configurations. The platform distinguishes grid-sourced power interruptions from equipment-caused Availability losses in OEE calculations. Process benchmarks are calibrated to Indian ore quality ranges. CPCB reporting templates are built into the compliance module. And the full operator interface — work order entry, equipment status reporting, shift handover notes — is available in Hindi with additional Indian language support for regional workforce requirements. Book a Demo to see how iFactory's India-specific configuration maps to your mill's operating environment.
India Steel Analytics Benchmark: OEE by Production Unit and Mill Type
OEE performance and the dominant loss category differ significantly between India's integrated blast furnace mills, EAF mini mills, and secondary rolling operations — and the improvement strategy that works at a SAIL-scale integrated plant is different from the one that produces the fastest results at a 1.5 million tonne EAF operation. The table below maps current Indian industry OEE performance, the world-class target for each production unit, the dominant loss category in India's specific operating environment, and the iFactory analytics focus area that drives the highest-value improvement for each unit type. Book a Demo to see your mill's production units benchmarked against this data.
| Production Unit | India Industry Range | World-Class Target | Dominant India-Specific Loss | iFactory Analytics Focus | 12-Month OEE Gain |
|---|---|---|---|---|---|
| Blast Furnace | 68–79% | 88%+ | Availability — ore quality variability causing burden irregularity and unplanned blow-downs | Ore quality correlation analytics, burden distribution trending, tap hole condition monitoring | +7–10 pts |
| EAF / Induction Furnace | 60–73% | 84%+ | Performance — power interruptions extending heat cycle time and electrode consumption | Grid event OEE separation, heat time analytics, electrode management dashboard | +9–13 pts |
| Continuous Caster | 65–76% | 86%+ | Quality + Availability — breakout risk from scrap quality variability in EAF feed | Breakout prediction, segment wear analytics, steel chemistry correlation to quality loss | +8–12 pts |
| Hot Rolling Mill | 62–73% | 83%+ | Performance — cobbles and speed reductions from billet quality variation and roll wear patterns | Cobble prediction, billet quality tracking, roll wear analytics, speed loss attribution | +9–13 pts |
| Cold Rolling Mill | 59–71% | 81%+ | All three — strip breaks, AGC drift, roll change frequency from high-sulphur domestic coil | Strip break root cause, AGC condition monitoring, roll change optimization by coil grade | +10–14 pts |
| Galvanizing / CGL Line | 58–69% | 80%+ | Quality — coating weight variation from strip surface variation and pot chemistry drift | Coating weight analytics, pot chemistry trending, surface defect classification by origin | +10–15 pts |
| Secondary Rolling (TMT) | 55–68% | 78%+ | Availability + Quality — billet rejections and roll pass wear driven by scrap mix variability | Scrap mix correlation, roll pass wear tracking, billet rejection root cause analytics | +11–15 pts |
India-Specific Features That Generic Analytics Platforms Cannot Provide
The technical requirements for an analytics platform that genuinely serves Indian steel operations go beyond language localization and compliance checklists. They reflect the structural operating conditions of Indian steelmaking — the raw material supply chain, the power infrastructure, the regulatory environment, and the workforce composition — that shape every production decision from blast furnace burden design to finishing line quality control. iFactory's India-specific feature set addresses these requirements at the platform architecture level, not as configuration add-ons to a Western-market product.
iFactory vs. Generic Analytics Platforms: What Indian Steel Mills Actually Get
The decision between an India-purpose-built analytics platform and a generic international product is not primarily a feature comparison — it is a question of which platform produces accurate, actionable data in the specific operating conditions of an Indian steel facility, and which produces data that looks correct until a process engineer tries to act on it. The comparison below maps the functional differences that determine real-world analytics value in Indian steel operations.
- OEE calculation treats grid power outages as equipment Availability failures — distorting maintenance performance data
- No CPCB compliance module — environmental reporting managed in separate system with duplicate data entry
- English-only operator interface — Hindi-speaking shift operators enter data in a second language, degrading data quality
- Process benchmarks calibrated to Western ore quality ranges — Indian ore variability appears as process instability rather than input variation
- Deployment costs sized for Tier 1 global producers — inaccessible to mid-size Indian mills without enterprise IT budgets
- SAP integration requires custom development — 6 to 12 month integration project at additional cost before analytics is operational
- Support in US/EU time zones — critical production issues cannot be resolved during Indian working hours
- Grid power OEE separation built into the data model — equipment OEE and power infrastructure loss tracked independently
- CPCB compliance module integrated with production data infrastructure — no separate data entry, audit trail included
- Hindi and regional language operator interface — data entry accuracy matches workforce language capability
- Indian ore quality variability analytics — Fe, Al2O3, moisture correlation with process performance built in
- India-specific pricing from $18,000 deployment — accessible to mid-size mills producing 0.5 to 3 million tonnes annually
- Pre-built SAP S/4HANA and ECC integration — operational at deployment, no custom development required
- India-based support team in IST time zone — production issues resolved within business hours, not overnight
The iFactory India Deployment Process: From Contract to Live OEE Dashboard in 4 to 6 Weeks
Indian steel mills deploying analytics for the first time — or replacing a generic platform that has not delivered actionable data — face a deployment timeline question that is often the deciding factor in the go/no-go decision. A 12 to 18 month implementation project is not compatible with the operational urgency of an analytics deployment that is meant to address current production efficiency gaps. iFactory's India deployment methodology is engineered for the 4 to 6 week timeline that matches the operational decision cadence of Indian steel management.
Expert Perspective: What Indian Steel Operations Leaders Say About Analytics in the Make in India Environment
The narrative around Make in India and the Production Linked Incentive scheme for specialty steel has created a real strategic opportunity for Indian producers — but capturing that opportunity requires building the operational capability to produce to the quality standards and delivery reliability that automotive, defence, and energy sector customers require. You cannot do that without real-time production analytics. What iFactory brought to our operation was not just an OEE number — it was the ability to see, in the same shift that it happens, exactly which equipment event caused which quality deviation, and which process parameter shift was responsible for the rejection that would otherwise show up three days later in a customer complaint. The Hindi interface made a meaningful difference in data entry quality from our operator teams — the downtime reason codes they were entering before were often approximate because they were working in a language they used functionally but not naturally. With Hindi interface, the specificity of the data improved immediately, and the analytics became more actionable. The CPCB integration removed what was essentially a parallel reporting burden for our environment team — the data was already being collected for production analytics, and building the compliance report from the same data eliminated the reconciliation work that was consuming two days per month. For Indian steel producers thinking about analytics investment: the ROI is not marginal. In our case, the first three improvement actions identified by the OEE loss Pareto recovered more production value in six months than the total platform investment. The question is not whether the investment pays — it is whether your organisation has the management discipline to act on what the data shows."
Conclusion
India's steel industry is at an inflection point where the operational capability gap between data-driven and intuition-driven producers is becoming a structural competitive disadvantage — not just a performance benchmark. The PLI scheme for specialty steel, the infrastructure investment driving demand for high-grade structural and flat products, and the export opportunity created by global market realignments all require Indian steel producers to demonstrate quality consistency, delivery reliability, and cost competitiveness that cannot be achieved at 62 to 67% OEE. The analytics capability that closes the gap between current Indian industry performance and world-class OEE is not a Tier 1 producer luxury — it is a competitive requirement for every Indian mill that intends to serve the higher-value market segments that Make in India policy is designed to build.
iFactory's India-purpose-built analytics platform — with Hindi and regional language interfaces, CPCB compliance integration, grid power OEE separation, domestic ore quality analytics, SAP integration, and India-calibrated pricing — delivers that capability at the scale and cost structure that matches the full range of Indian steel operations. The 9 to 15 percentage point OEE improvement and $10 to $20 million annual production value recovery documented at comparable Indian facilities are the outcomes of treating analytics not as a reporting tool but as the operational decision infrastructure that drives daily improvement actions at every level of the production organisation. Book a Demo to see iFactory's India analytics platform configured for your specific mill type, production units, and improvement priorities.
Frequently Asked Questions
Yes — iFactory's India pricing is specifically structured for mills producing 0.5 to 3 million tonnes annually, with deployment costs from $18,000 and annual licensing that scales with production units rather than enterprise minimums.
iFactory's CPCB module pulls stack emission, effluent, and solid waste data from the same sensor infrastructure feeding OEE analytics, generating submission-ready reports with full audit trail documentation. No separate data entry is required.
iFactory provides pre-built SAP S/4HANA and ECC 6.0 integration, certified for the SAP environments operated by major Indian steel producers. PM work orders, MM materials, and PP production orders synchronize automatically.
Yes — this is a core India-specific feature built into the OEE data model, not a workaround configuration. Grid power events are classified separately from equipment Availability losses, giving plant managers an accurate equipment OEE for maintenance decisions.
Comparable Indian steel facilities achieve 9 to 15 percentage point OEE improvements within 12 months, recovering $10 to $20 million in annual production value from existing assets. Book a Demo