The transition from manual whiteboards to a real-time Digital OEE Dashboard is the single most impactful move a steel plant can make toward operational maturity. In the high-stakes environment of a modern mini-mill, where a 5-minute delay in the melt shop can ripple into a $50,000 production loss, "Decision Latency" is the ultimate profit killer. A high-fidelity dashboard doesn't just display numbers; it creates a "Glass Mill" architecture—democratizing performance data from the EAF mast to the slitting line and providing every supervisor with the metallurgical decision support they need to maintain a zero-breakdown pulse. For manufacturers ready to eliminate paper-log friction, book a demo to see how iFactory's digital dashboarding platform synchronizes your entire production floor.
The "Telephone Game" of shift handovers—where critical performance nuances are lost between spoken reports and smudged paper logs—is a systemic risk that many mills accept as normal. iFactory eliminates this risk by providing a single, immutable source of truth that is accessible on every ruggedized tablet and command center screen in the facility. By correlating First-Pass Yield (FPY) with Asset Availability in a unified visual environment, mill directors can finally align their mechanical reliability programs with their financial growth targets, moving from reactive fire-fighting to proactive production engineering.
Build a High-Performance Glass Mill
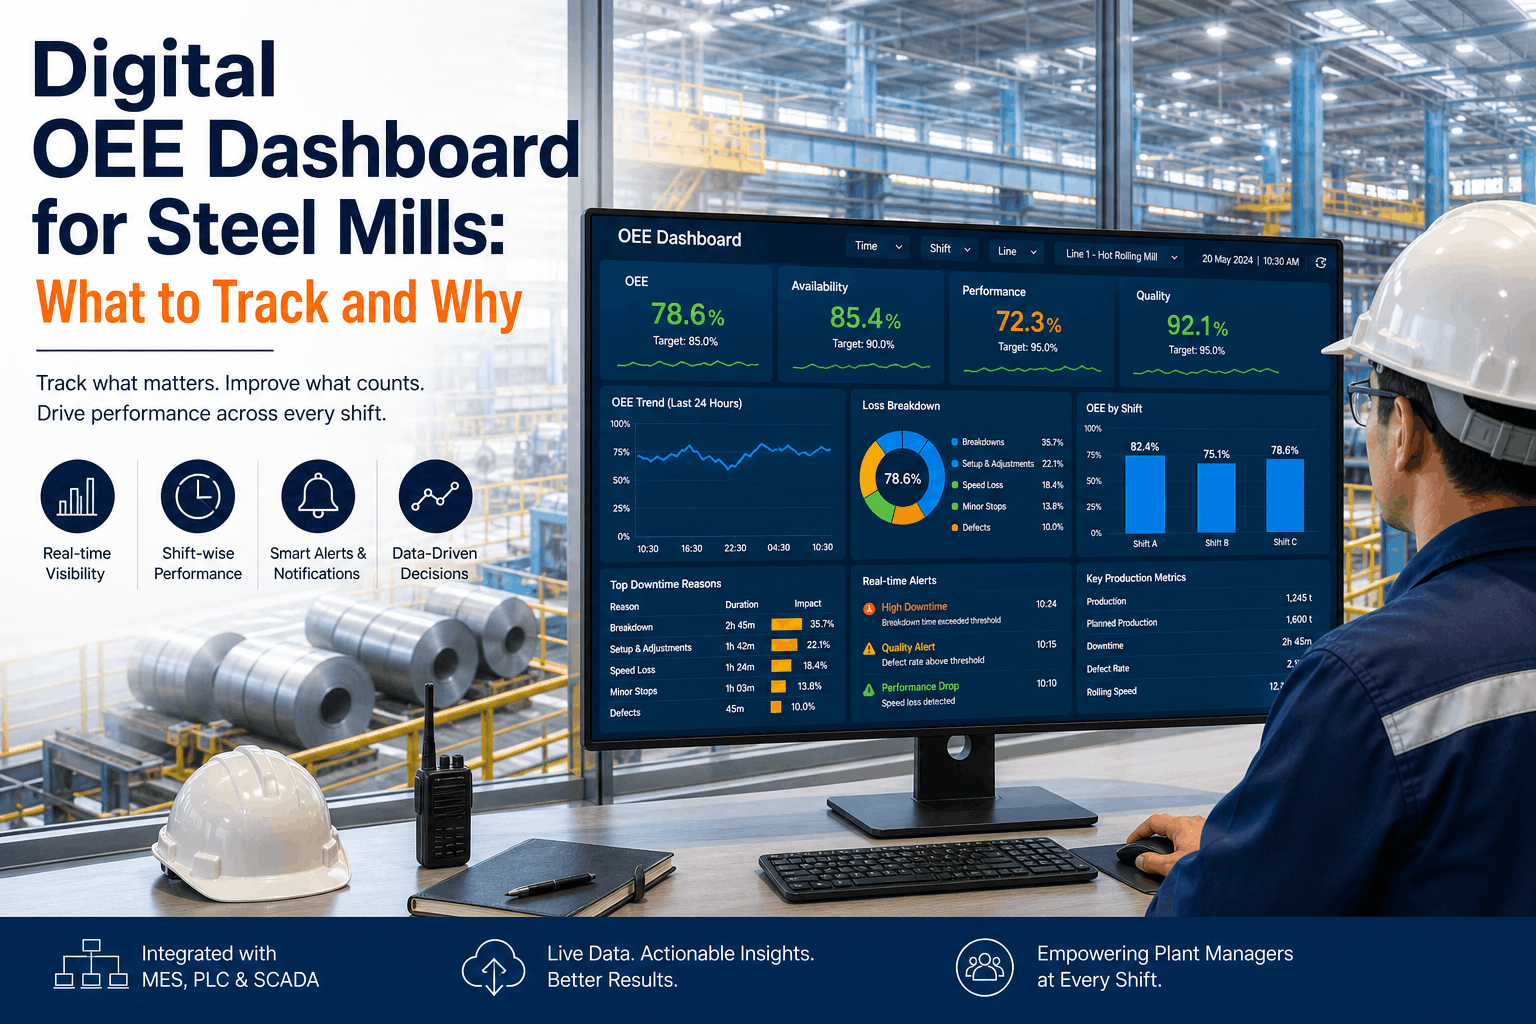
iFactory's digital OEE dashboards integrate directly with your PLCs, MES, and SCADA to deliver real-time visibility, predictive alerts, and automated performance reporting.
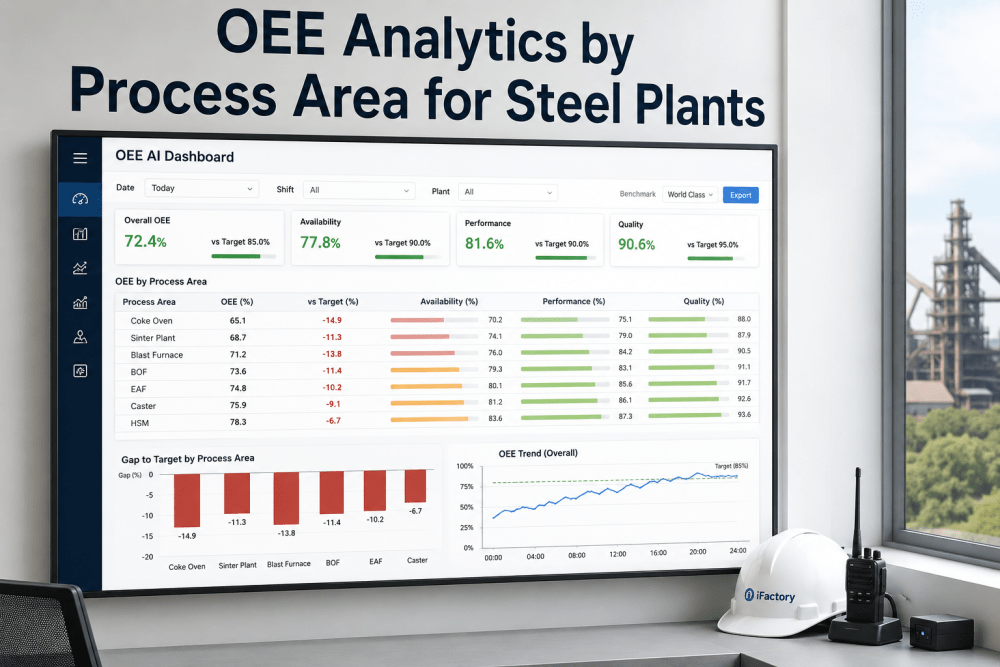
The Anatomy of a Steel Mill OEE Dashboard
A dashboard for a steel plant must be more than a collection of gauges. It must serve as a Causal Inference Engine—identifying not just that OEE is down, but exactly where the loss is occurring in the metallurgical chain. To achieve this, the dashboard must orchestrate data from the edge (PLCs) and the top-floor (MES/ERP) into a unified view. Whether you are tracking the "Tap-to-Tap" cycle in the melt shop or the "Feet-per-Minute" on a cold rolling mill, understanding which widgets drive action is the difference between a pretty dashboard and a high-performance production tool.
Modern steel plant directors use book a demo to understand how persona-based dashboarding ensures that every stakeholder—from the maintenance tech in the grease pit to the CFO in the boardroom—sees exactly the data they need to optimize EBITDA per ton.
Essential Dashboard Widgets for Steel Operations
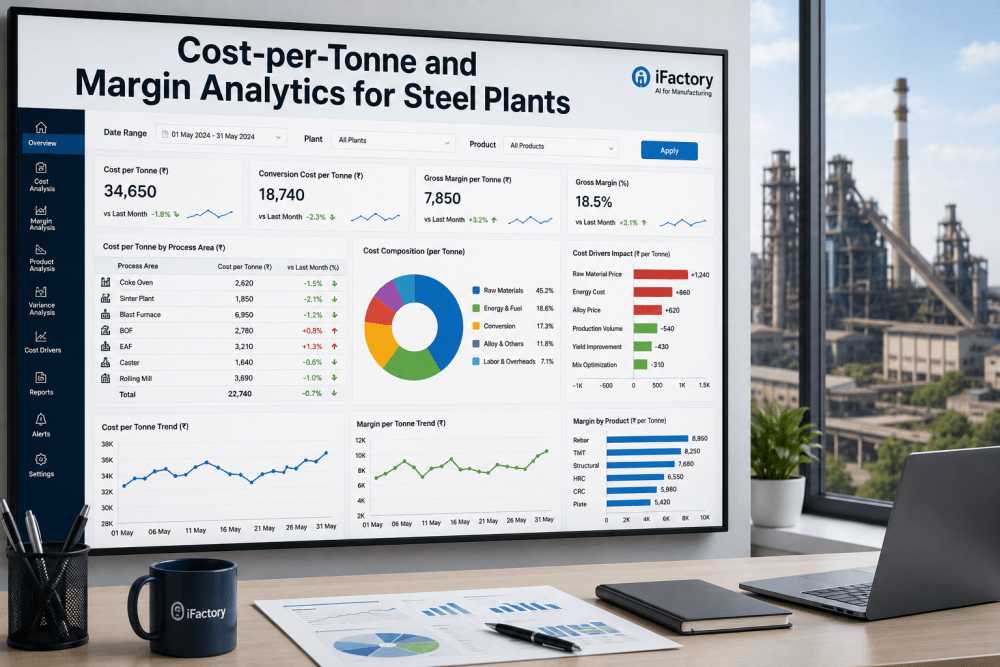
Plant EBITDA & TEEP Gauges
A high-level widget for plant managers that correlates OEE with Total Effective Equipment Performance (TEEP). It reveals how much of the plant's ultimate capacity is being converted into profit, providing the "North Star" metric for CapEx planning and investor reporting.
Live Waterfall Loss Analysis
A real-time visualization of the "Six Big Losses." It categorizes downtime, speed losses, and quality defects as they happen, allowing supervisors to see exactly how many tons were lost to "EAF Power-Off Time" vs. "CCM Breakout Risk" in the current shift.
Predictive Asset Health Score
A diagnostic widget that pulls data from vibration, thermal, and electrical sensors. It ranks every asset (Furnaces, Casters, Mills) by its "Risk of Imminent Failure," allowing maintenance teams to prioritize interventions before a shutdown occurs.
Arc Stability & Power Curve Analytics
Specifically for the melt shop, this widget tracks the electrical harmony of the EAF. It identifies "Arc Jitter" and transformer harmonic distortion, predicting when unoptimized power curves are wasting energy and accelerating electrode wear.
The Semantic Data Layer: Turning Tags into Intelligence
The greatest failure of generic dashboarding platforms in steel is their inability to understand the Physics of the Melt. A raw PLC tag indicating a "Pressure Drop" is meaningless without the context of the production cycle. iFactory's dashboard utilizes a Semantic Data Layer that maps thousands of PLC tags to specific metallurgical events. For example, if a pressure drop occurs during a ladle swap, the dashboard automatically logs it as a "Scheduled Process Change" rather than an "Unplanned Equipment Failure." This contextual intelligence ensures that your OEE scores are accurate, auditable, and actionable. Book a demo to see our semantic engine in action.
"Before iFactory, our shift handovers were a chaotic game of telephone. By deploying the Digital OEE Dashboard across the floor, every supervisor now walks into a 100% accurate view of the previous shift's performance. We've seen a 22% increase in performance consistency simply because everyone is now operating from the same 'Glass Mill' data."
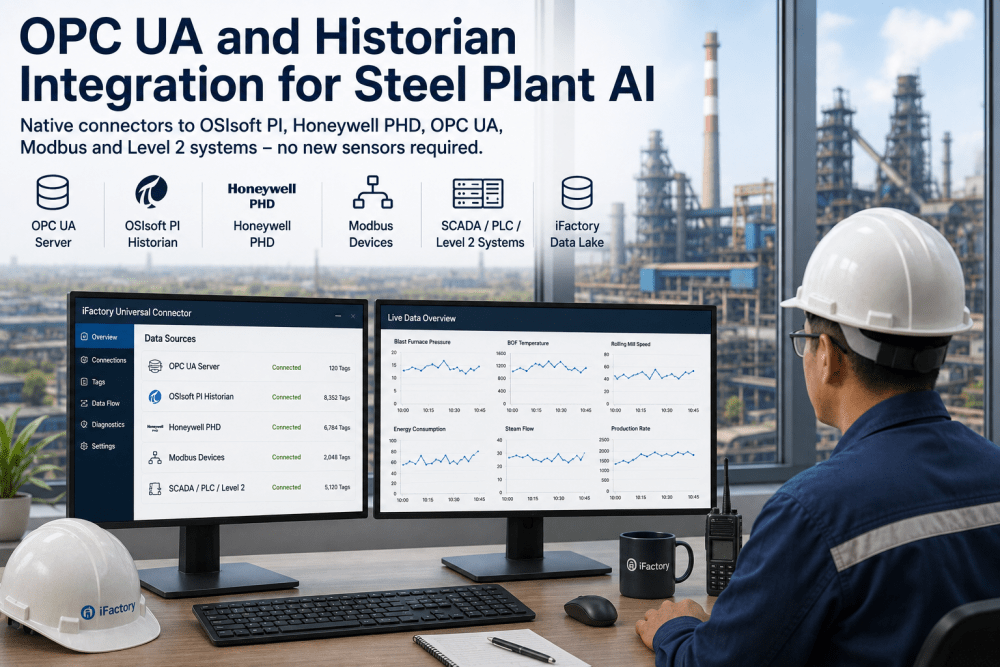
Data Orchestration: Beyond PLC Integration
Integrating a dashboard with a steel mill's technology stack requires more than a simple Modbus connection. It demands a Semantic Data Layer that can contextualize PLC tags into production events. For example, a "Motor High Amperage" tag in the SCADA system must be automatically translated by the dashboard as a "Slag Imbalance" or "Electrode-Tip Overload" event in the melt shop. This contextualization is what transforms raw data into actionable production intelligence. Talk to our engineers about how we handle high-frequency data from legacy SCADA and MES systems.
Eliminating the "Supervisor's Burden"
The average steel plant supervisor spends 30-45 minutes per shift manually logging downtime. iFactory's dashboard automates this by pulling state data directly from the PLC. When the mill stops, the dashboard asks for a "Reason Code" via a ruggedized tablet, ensuring 100% accurate downtime categorization with zero paperwork.
Alert Thresholds for "Metric Drift"
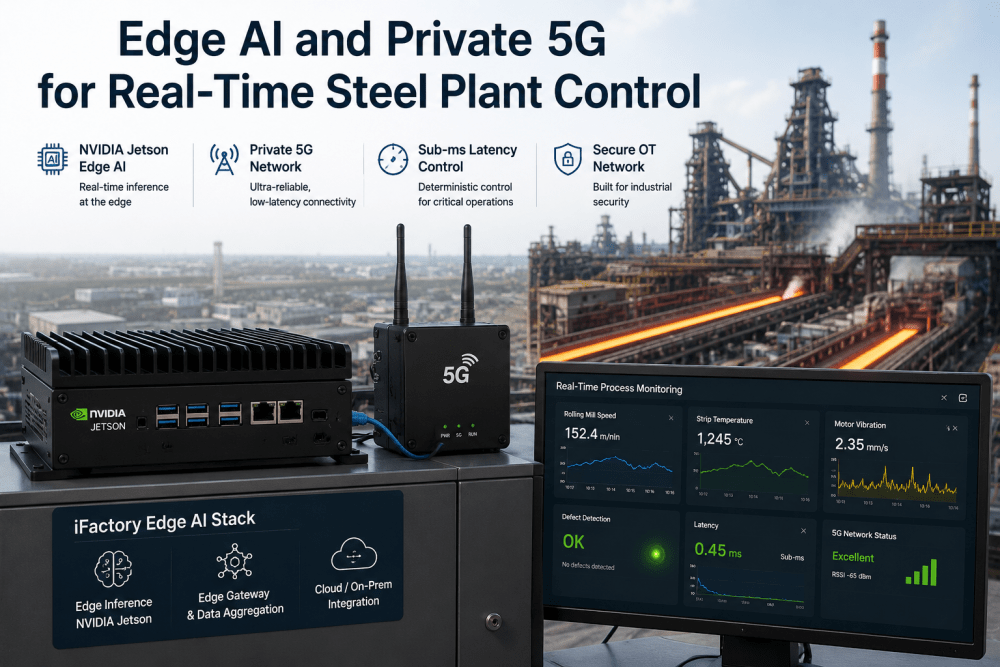
A dashboard shouldn't just show you that you missed your target. iFactory's predictive thresholds alert supervisors when a metric is drifting toward a loss. If the rolling mill speed drops 5% below the metallurgical setpoint, a "Drift Alert" is issued immediately, allowing for a mid-shift correction.
Steel Dashboard Maturity Matrix: Features & Capabilities
| Capability | Essential Dashboard | Advanced iFactory Dashboard | Operational Impact |
|---|---|---|---|
| Data Latency | Shift-end batch updates | Real-time (millisecond) sync | 18% reduction in MTTR |
| Downtime Logging | Manual paper entry | Automated PLC state capture | 100% data reliability/audit-ready |
| Loss Categorization | Generic "Machine Fail" codes | Metallurgical "Root Cause" logic | Eliminates recurring process bottlenecks |
| Alerting | None / Visual on-screen | Predictive SMS/Email notifications | Proactive rather than reactive maintenance |
| Maintenance Sync | Manual work orders | Automated CMMS/SAP Integration | Reduction in emergency parts procurement |
| Decarbonization | Monthly utility bills | Real-time Carbon Intensity widget | Ready for CBAM & ESG reporting |
| Financial Recon | Weekly spreadsheets | Live EBITDA-per-ton widget | Direct alignment between shop-floor & CFO |
| Multi-Site View | Manual spreadsheet consolidation | Unified Global Fleet dashboard | Standardized benchmarking across sites |
The Cultural Shift: Building a Data-Driven Mill Floor
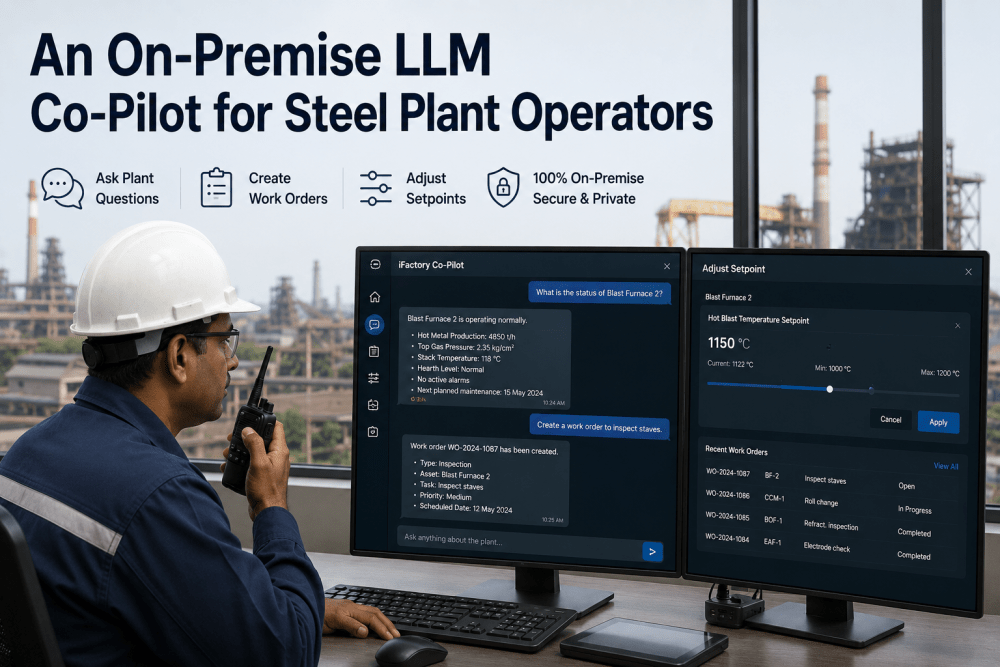
Technology is only 50% of the digital transformation. The other 50% is cultural. iFactory's dashboard is designed to empower the operator, not just the manager. By providing technicians with Real-Time Performance Feedback, the dashboard creates an environment of continuous improvement (Kaizen). When an operator sees a "Performance Drift" alert and can immediately adjust the spray cooling or the electrode position to correct it, they move from being a "Machine Watcher" to a "Production Engineer." This shift significantly reduces employee turnover and increases the collective "Operational IQ" of your workforce. Talk to our experts about our cultural implementation strategies.
Implementation Roadmap: Deploying the "Glass Mill" Dashboard
Edge-to-Dashboard Sync
Identify critical assets and map PLC tags to OEE sub-metrics. Establish high-fidelity data pipes from EAF, CCM, and Rolling Mills. No production interruption required. Timeline: 4–6 weeks.
Logic & Persona Setup
Configure automated downtime reason codes and persona-based widgets. Train supervisors on the "Alert-to-Action" workflow. AI establishes the first performance baselines. Timeline: 6–8 weeks.
Closed-Loop Optimization
Enable predictive alerts and automated performance reporting. Dashboard insights feed directly into CapEx and sustainability planning. ROI reaches 100% within 12 months. Timeline: Ongoing.
Stop Flying Blind — Get Real-Time Mill Visibility
iFactory's digital OEE dashboards give you 100% accurate, real-time visibility into your steel manufacturing operations — from the melt shop floor to the CFO's desk.
Frequently Asked Questions: Steel Digital Dashboards
Can the dashboard pull data from older PLCs and SCADA systems?
Yes. iFactory utilizes non-invasive industrial IoT gateways to ingest data from legacy hardware using protocols like OPC-UA, Modbus, and EtherNet/IP, bringing modern digital visibility to equipment built decades ago.
Does the system require manual downtime entry?
The dashboard automatically captures when the machine stops via the PLC. The supervisor only needs to provide the reason (e.g., "Hydraulic Leak" or "Grade Change") via a one-click mobile interface, eliminating manual paperwork.
How does the Carbon Intensity widget calculate real-time data?
We correlate real-time power meter data (kW) with production throughput (tons) and fuel consumption (gas). The AI then applies carbon emission factors to provide a live "kg CO2 per ton" score for every heat.
Is the dashboard accessible on mobile phones and tablets?
Absolutely. The Entire iFactory platform is built with 17px+ typography and mobile-first design, ensuring that supervisors on the plant floor have the same visibility as managers in the office.
Can we customize the widgets for our specific mill configuration?
Yes. The dashboard is fully modular. You can drag-and-drop widgets for EAF power curves, CCM mold oscillation, or Rolling Mill speed, creating a view that matches your specific metallurgical flow.
How does the dashboard handle multi-site operations?
For enterprise clients, iFactory provides a "Global Fleet" view. This allows corporate directors to benchmark OEE across multiple plants, identifying the top-performing sites and standardizing best practices.
What is the security protocol for our production data?
We utilize enterprise-grade encryption (AES-256) and secure industrial tunnels. Data is stored in SOC2-compliant cloud environments or can be hosted on-premise depending on your facility's security mandates.
How long does it take to see ROI from a digital dashboard?
Most mills see immediate "Decision Speed" improvements. The MTTR reduction and shift-consistency gains typically recover the platform costs within 6-9 months of deployment.