Calculating Overall Equipment Effectiveness (OEE) in a steel rolling mill is the difference between a facility that maximizes its yield and one that bleeds profit through "invisible" performance losses. Most mills treat OEE as a manual reporting exercise — supervisors scribbling downtime codes on paper logs that are typed into spreadsheets 24 hours too late. By the time a 4% performance dip is noticed, the opportunity to correct the roll speed or tension is gone. Every 1% gain in OEE in a high-capacity mill can represent $450,000–$700,000 in additional annual margin. Mills that adopt automatic OEE tracking with iFactory move from guessing to knowing — capturing every micro-stop and speed loss in real-time. This step-by-step guide breaks down the rolling mill OEE formula into its core components (Availability, Performance, and Quality) and provides a repeatable framework for world-class production performance.
Rolling Mill OEE Calculation: The Complete Formula Guide
Master the math of mill efficiency — Availability, Performance, and Quality benchmarks, plus the "6 Big Losses" specific to hot and cold rolling operations.
The 6 Steps to Standardizing Rolling Mill OEE
Inconsistent OEE definitions are the biggest barrier to performance improvement. If "Equipment State" varies between shifts, your data is compromised. iFactory enforces a single, mill-wide digital standard for how every second of the production clock is categorized.
Define Asset State
Classify what constitutes "Running" vs "Idle." iFactory uses PLC logic to auto-detect states based on motor current and product presence.
Set Design Speed
Document the Theoretical Maximum Speed for every SKU. Performance is calculated against this ideal, not a "reduced" historical average.
Loss Mapping
Categorize downtime into the "6 Big Losses" (Breakdowns, Roll Changes, Idling, Speed, Scrap, Rework). iFactory prompts operators for codes only when PLC data is ambiguous.
Data Integration
Connect PLC, Scada, and MES data. iFactory eliminates manual logs by pulling production counts and quality rejects directly from the line.
Visual Reporting
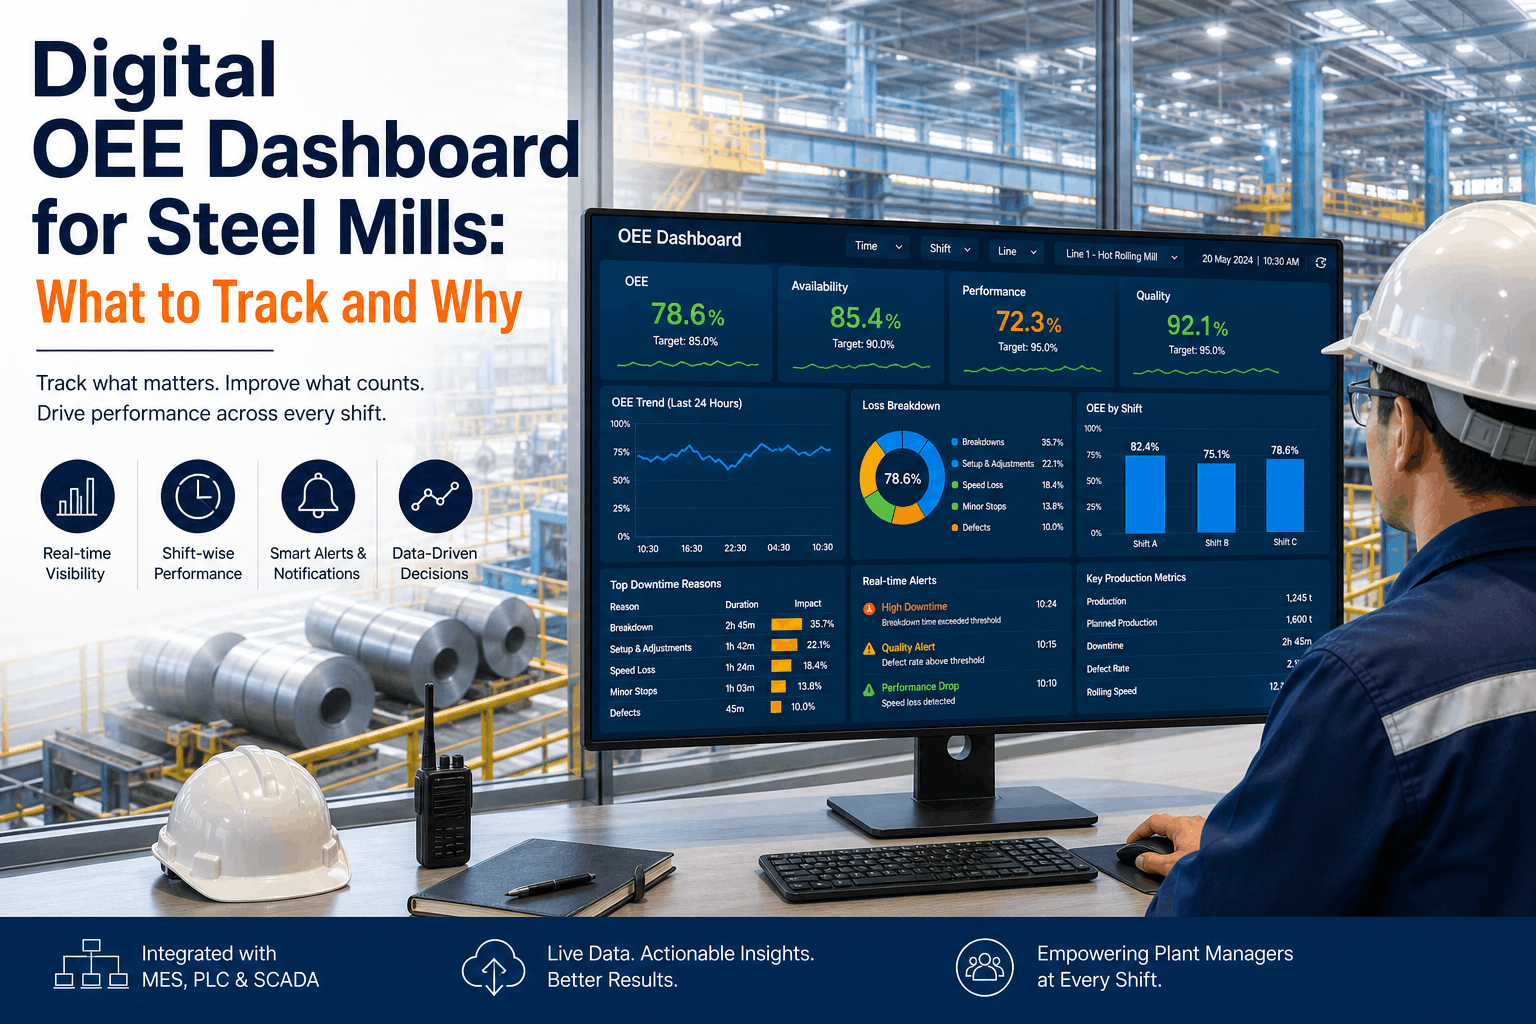
Display real-time OEE on shop-floor "Scoreboards." High visibility drives faster response to performance dips and minor idling.
Cycle of Improvement
Review weekly Pareto charts to target the largest loss category. Plants using iFactory typically see a 5% OEE lift within the first 6 weeks.
Typical Loss Distribution — 500,000 TPY Rolling Mill
Where does the time go? At most mills, "Performance Loss" (speed loss and micro-stops) is larger than "Availability Loss" (breakdowns), but it remains invisible because it's not captured in manual logs. iFactory highlights these subtle losses.
Top 5 OEE Calculation Mistakes — And How iFactory Prevents Each
Ignoring Micro-Stops
Operators don't log stops under 5 mins. iFactory PLC triggers capture every second of idling automatically.
Subjective Rejects
Quality rejects aren't subtracted in real-time. iFactory MES link auto-deducts tonnage from the Quality score.
Wrong Design Speeds
Performance is measured against a "safe" speed. iFactory forces measurement against OEM design speed.
Data Smearing
Lumping all downtime into "Mechanical." iFactory prompts for root-cause (Hydraulic, Tension, Drive) at stop.
Manual Entry Latency
Data is 24h old. iFactory provides live dashboards so teams can react to hourly performance trends.
The iFactory OEE Engine: From Data to Dollars
PLC Auto-Detection
Connect directly to Siemens, Rockwell, or ABB controllers. iFactory reads motor torque and speed to determine equipment health and production state in real-time.
AI Loss Classification
Our machine learning layer analyzes stop patterns to automatically predict the root cause (e.g., "Looping Inconsistency" vs "Drive Fault") with 92% accuracy.
OEE Forecasting
Predict where your shift will end. iFactory's trajectory tool flags when you are falling behind your production target 2 hours before the shift ends.
Mobile WO Sync
When a stop occurs, iFactory auto-generates a work order for the right technician. Mean Time to Repair (MTTR) is reduced by an average of 14%.
What an Operations Manager Said
We always thought our OEE was 75%. Within two weeks of turning on iFactory, we realized it was actually 62%. The difference was 'micro-stops' and subtle speed losses that weren't on any paper logs. Once we saw the data, we optimized the roll-stand tensioning and gained 6% OEE in three months. That's worth $3.6M to us annually.
Frequently Asked Questions
What is the standard OEE formula for a rolling mill?
OEE = Availability (Actual Run Time / Planned Production Time) x Performance (Actual Production / Target Production at Design Speed) x Quality (Good Tonnage / Total Tonnage).
How do roll-changes and setup times affect OEE?
These are categorized as "Availability Losses" (Setup/Adjustment). iFactory captures the exact duration from last-bar-out to first-bar-in to measure changeover efficiency.
Can OEE be tracked on legacy rolling mills without modern PLCs?
Yes. iFactory's IoT gateways can tap into motor current sensors and optical strip counting to calculate OEE without needing complex PLC code changes.
Why is "Speed Loss" often the most difficult OEE metric to fix?
Because it's often deliberate—operators run slower to "protect" a bearing or avoid strip breakage. iFactory surface these "Safe Speeds" vs "Design Speeds" to identify where maintenance or process issues are causing hidden performance drags.
Track Your Real-Time OEE with iFactory
Turn your "Hidden Factory" into visible profit. Setup takes 10 minutes from your PLC data feed.