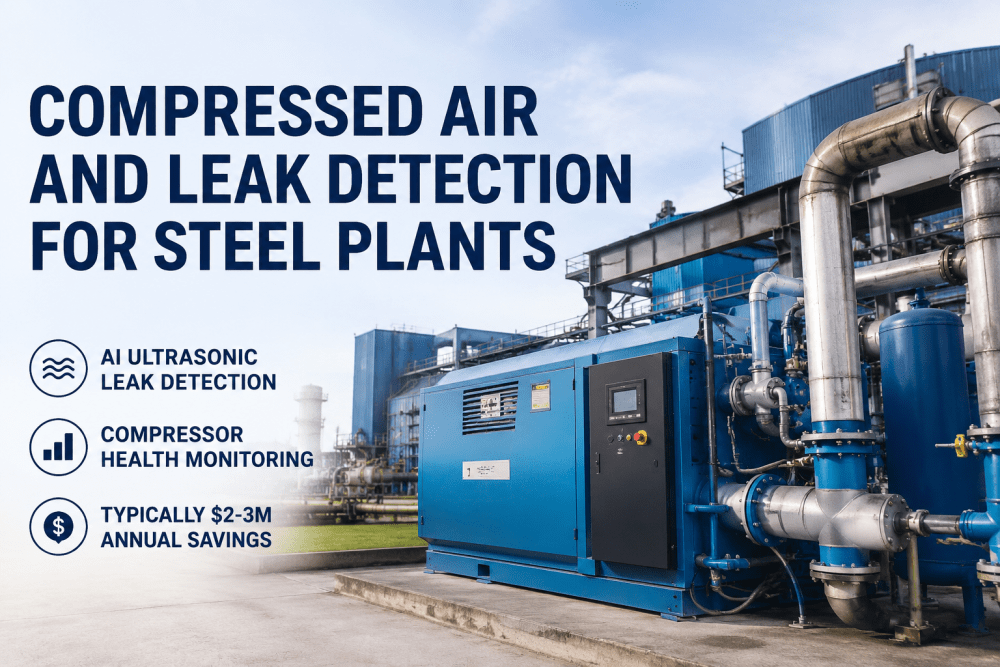
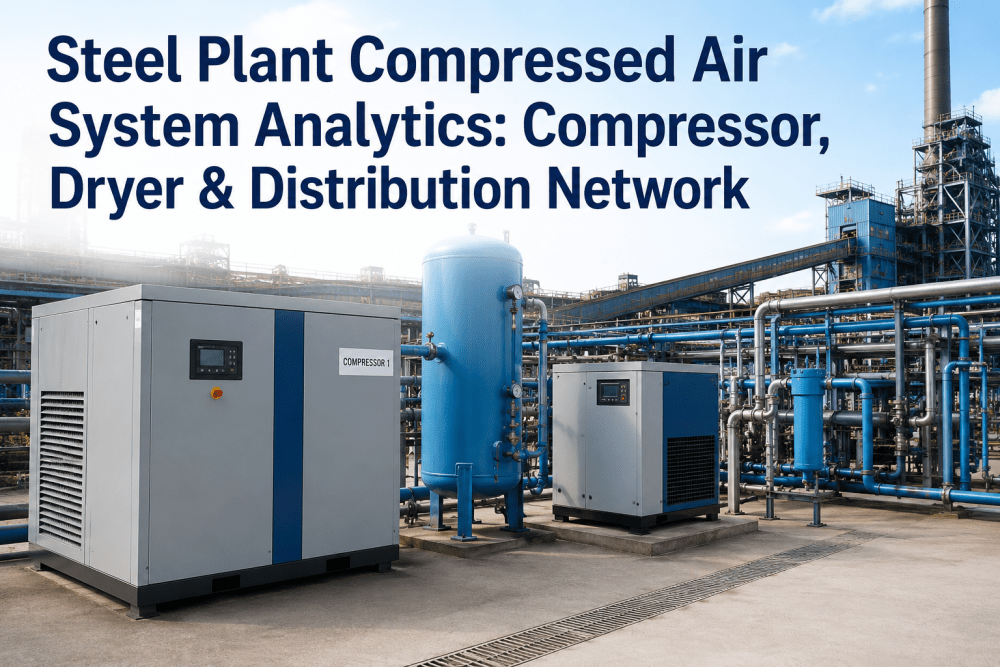
Compressed air and nitrogen are easy to overlook because nobody sees them the way they see a rolling mill or a furnace, yet these systems typically account for a meaningful share of total electricity use across a steel plant. A single leaking fitting rarely triggers alarm on its own, but a plant with dozens of small leaks spread across pneumatic lines, valves, and nitrogen distribution can quietly waste a large amount of compressed air capacity every single day. Compressors also tend to run less efficiently as they age, drawing more power to deliver the same output without anyone noticing until a utility bill review flags it. AI-based monitoring puts a number on this waste in real time instead of waiting for an annual energy audit, which is why operations directors are increasingly requesting a walkthrough of leak detection running against their own air and nitrogen network.
AI MONITORING FOR AIR AND NITROGEN SYSTEMS
Find the Leaks Quietly Driving Up Your Utility Bill
Continuous leak detection, compressor health tracking, and energy analytics target the compressed air and nitrogen waste that typically goes unnoticed until it shows up in the electricity bill.
8-12% of Load
Share of total steel plant electricity typically consumed by air and gas systems
Continuous Scan
Leak detection running around the clock instead of during periodic audits
Compressor Health
Early visibility into efficiency loss as compressors age or drift out of tune
Leak Detection Approaches Compared
How a leak is found, and how quickly, makes a direct difference in how much compressed air capacity a plant loses before the fix happens.
Where Compressed Air and Nitrogen Losses Usually Hide
Pneumatic Valve Fittings
Fittings on pneumatic actuators and control valves loosen gradually with vibration and thermal cycling, creating small but continuous leaks.
Flexible Hose Connections
Hose connections at tool drops and quick-disconnect points wear faster than fixed piping and are a common source of undetected leaks.
Nitrogen Distribution Lines
Long nitrogen distribution runs across a plant floor accumulate joint and seal wear over distance, often in areas rarely inspected closely.
Idle Equipment Left Pressurized
Equipment left pressurized during downtime continues drawing air or nitrogen unnecessarily, adding avoidable load to the whole system.
How Continuous Air System Monitoring Works
1
Network-Wide Flow and Pressure Sensing
Sensors placed across the compressed air and nitrogen network track flow and pressure continuously at key distribution points.
2
Baseline Demand Comparison
Readings are compared against expected demand for current production activity, revealing consumption that does not match actual usage.
3
Leak Location Estimation
Unusual consumption patterns are narrowed down to specific zones, helping maintenance teams find the source faster than a manual survey.
4
Compressor Efficiency Tracking
Compressor power draw relative to output is tracked over time, flagging efficiency decline before it becomes a larger energy cost.
See What Your Air and Nitrogen Network Is Losing
Walk through a monitoring plan built around your compressors, distribution lines, and highest-usage zones.
Fitting Into Existing Energy Management Programs
Energy Dashboard Integration
Air and nitrogen consumption data feeds into existing energy dashboards, giving operations directors one view across all utility systems.
Maintenance Work Order Generation
Confirmed leak locations can generate work orders directly, moving from detection to repair without a separate manual reporting step.
Utility Cost Attribution
Consumption trends can be attributed to specific production areas, supporting more accurate cost accounting across departments.
Frequently Asked Questions
STOP PAYING FOR AIR YOU NEVER USE
Bring AI Monitoring to Your Compressed Air and Nitrogen Systems
Get a monitoring plan built around your compressors, distribution network, and energy cost goals.