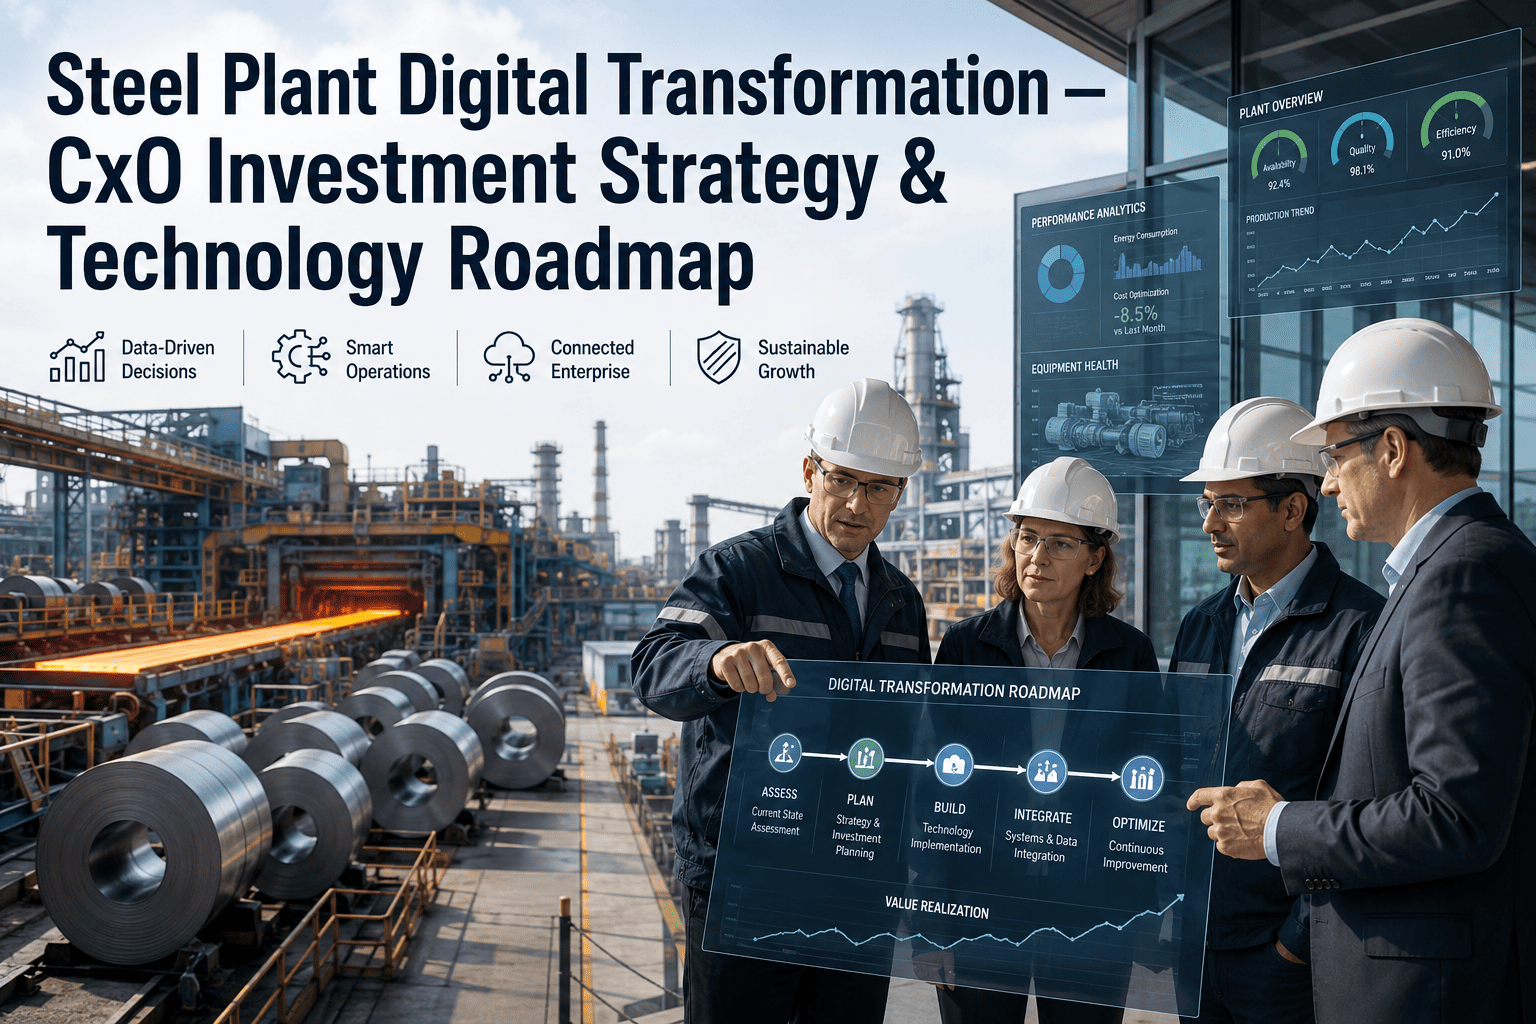
Most steel plant leaders can tell you exactly how many tons they poured last quarter, but ask them to score their own digital maturity and the answer gets vague fast. That vagueness is not a knowledge gap so much as a measurement gap — connectivity, analytics capability, and AI readiness are rarely scored with the same discipline as production output, so plants routinely overestimate where they actually stand. A clear-eyed assessment is what turns "we should modernize eventually" into a phased roadmap with a real starting point. Get your plant's maturity scored in a working session rather than guessing at it internally.
WORKFORCE & DIGITAL — MATURITY ASSESSMENT
Find Out Which Digital Maturity Level Your Steel Plant Is Actually On
Roughly three in four steel producers say they have started a digital transformation initiative, yet most sit closer to the beginning of that journey than their internal narrative suggests. A structured assessment across connectivity, analytics, and AI readiness replaces that guesswork with a specific starting point.
Level 1
Ad Hoc
Level 2
Connected
Level 3
Analytical
Level 4
Autonomous
Most plants that believe they are further along actually sit here
The Three Dimensions Worth Scoring Honestly
A useful maturity assessment does not produce one overall number — it scores each dimension separately, because a plant can be strong on connectivity while being nowhere near ready for AI, and treating the two as the same problem wastes budget on the wrong phase.
Connectivity Scoring
Measures how much of the plant's PLC, SCADA, and sensor data actually reaches a unified data layer rather than sitting isolated in individual control systems. Many plants score reasonably here, since basic connectivity is the first thing most modernization budgets fund.
Not sure what your own connectivity number looks like —
get it scored.
Analytics Capability
Measures whether connected data actually gets turned into usable dashboards, trend analysis, and root-cause tools that operators and engineers use daily, rather than sitting in a historian nobody opens.
AI Readiness
Measures whether the plant has enough labeled failure history, consistent time-stamping, and clean data quality for a predictive model to actually learn from — the dimension where most plants score lowest by a wide margin.
Find out how far your historian data actually is from AI-ready —
have it reviewed.
Why Plants Consistently Overestimate Their Own Score
The overestimation is rarely dishonest — it is a natural byproduct of which parts of a digital program are visible day to day. A live dashboard on the control room wall feels like proof of maturity, even when the model behind it was never trained on clean, consistently labeled data.
Broader manufacturing benchmarking consistently finds a wide gap between ambition and readiness — a large majority of plants describe themselves as exploring AI, but only a small fraction consider their data foundation actually ready to support it. The gap exists because connectivity gets funded and celebrated first, while the harder, less visible work of data quality and labeling gets assumed rather than verified.
Connectivity Mistaken for Maturity
Having sensors installed and dashboards live feels like progress, but it only addresses the first of the three dimensions worth scoring.
Pilot Success Overgeneralized
One successful AI pilot on a single line gets read as plant-wide readiness, when the underlying data quality issues were often specific to that pilot's careful setup.
Historical Data Assumed Usable
Years of historian data often turn out inconsistent in labeling, timestamping, or sensor calibration once a model actually tries to train on it.
The Workforce Gap Most Scorecards Leave Out
A recent survey of steel producers found workforce readiness to be the single most commonly cited implementation obstacle — more mills pointed to a gap between data science skills and metallurgical process knowledge than to any technology limitation.
Nearly half of surveyed mills named that data-to-metallurgy skills gap as their primary barrier to advancing digital initiatives, ahead of budget or hardware constraints. A maturity assessment that only scores systems and skips workforce capability is measuring half the picture.
Closing this gap rarely means hiring a team of data scientists from outside the industry. The more durable fix is giving the metallurgists and process engineers already on staff simplified tools that let them build and interpret models themselves, without needing to become programmers first.
Score Your Plant Across All Three Dimensions in One Session
iFactory runs a structured connectivity, analytics, and AI-readiness assessment against your actual systems and data, not a generic checklist.
The Four-Level Roadmap From Ad Hoc to Autonomous
Once a plant knows its actual score on each dimension, the roadmap stops being a wish list and becomes a sequence — each level builds the foundation the next one depends on.
Level 1 — Ad Hoc
Data lives in isolated PLCs and paper logs. Decisions rely on operator experience and end-of-shift reports rather than live information.
Level 2 — Connected
PLC, SCADA, and sensor data flow into a unified layer with consistent time-stamping. Dashboards exist, but analysis is still mostly manual.
Level 3 — Analytical
Trend analysis, root-cause tools, and OEE tracking are used daily by operators and engineers. The data foundation is clean enough to support modeling.
Level 4 — Predictive & Autonomous
AI models trained on labeled failure history generate alerts and recommendations that close the loop with minimal manual intervention.
What a Real Assessment Actually Checks
| Dimension |
What Gets Checked |
Common Finding |
| Connectivity |
Percentage of critical assets streaming live data into a unified layer |
Melting and rolling often connected; auxiliary systems frequently missed |
| Analytics Capability |
Whether dashboards are used daily versus built once and abandoned |
Tools exist but adoption is uneven across shifts |
| AI Readiness |
Data labeling consistency, timestamp accuracy, and historical depth |
Usually the lowest score and the most underestimated internally |
| Workforce Capability |
Whether operators and engineers can act on the data available to them |
Skills gap frequently cited as the top barrier, ahead of budget |
Frequently Asked Questions
How long does a full digital maturity assessment take?
Most plants complete an initial assessment across connectivity, analytics, and AI readiness within two to three weeks, depending on how many production areas are in scope. The output is a scored profile against each dimension along with a recommended starting phase for the roadmap, not a generic industry benchmark report.
Can a plant skip Level 2 and go straight to AI if the budget allows it?
Technically the software can be purchased at any level, but skipping the connectivity and analytics foundation almost always produces a pilot that cannot scale, because the AI model has nothing reliable to learn from. Most plants that try to shortcut this sequence end up rebuilding their data architecture later at a higher cost than doing it in order the first time.
Is the workforce capability dimension really as important as the technical ones?
Yes — a plant can score well on connectivity and analytics and still fail to capture value if operators and engineers are not equipped to act on what the data shows them. Workforce readiness is frequently the deciding factor in whether a Level 3 or Level 4 initiative actually changes daily operations or just adds another dashboard nobody checks.
What happens if our AI readiness score comes back very low?
A low AI readiness score simply identifies where the roadmap should start — usually with data labeling and timestamp consistency work rather than a delayed AI pilot.
Reach out to our team for a practical view of what that foundational work looks like for your specific systems.
Does this assessment work for plants that already have some legacy automation in place?
Yes — most steel plants have some existing automation, and the assessment is built to score what is already there rather than assume a blank slate. Legacy PLCs can often be retrofitted with edge connectivity rather than replaced outright, which changes both the cost and the timeline of the roadmap significantly.
See what that looks like for your plant.
Replace the Guesswork With an Actual Digital Maturity Score
Connectivity, analytics capability, and AI readiness each tell a different part of the story. iFactory scores all three against your real systems and builds the phased roadmap from wherever you actually stand today.