Wire rod and section mills operate at the absolute frontier of mechanical speed and thermal complexity. In a high-speed finishing block, where the rod travels at over 100 meters per second, a "real-time" dashboard that refreshes every 15 minutes is not an analytics tool—it is a historical archive. The reality is that most mill managers believe they have visibility, but are actually operating within a "decision-latency gap" that hides the early warning signs of mill cobbles, guide failures, and cooling bed misalignments. If your analytics platform cannot identify a vibration anomaly in a finishing block stand before it manifests as a surface defect, you do not have real-time visibility—you have a reporting delay with a modern interface. Implementing iFactory AI-driven wire rod and section mill analytics closes this gap by processing high-frequency sensor data at the edge, synchronizing reheat furnace temperatures with mill stand loads and Stelmor cooling profiles. Book a Mill Strategy Session to learn how true real-time visibility eliminates the "Invisible Yield Gap" and maximizes your prime-grade long product recovery.
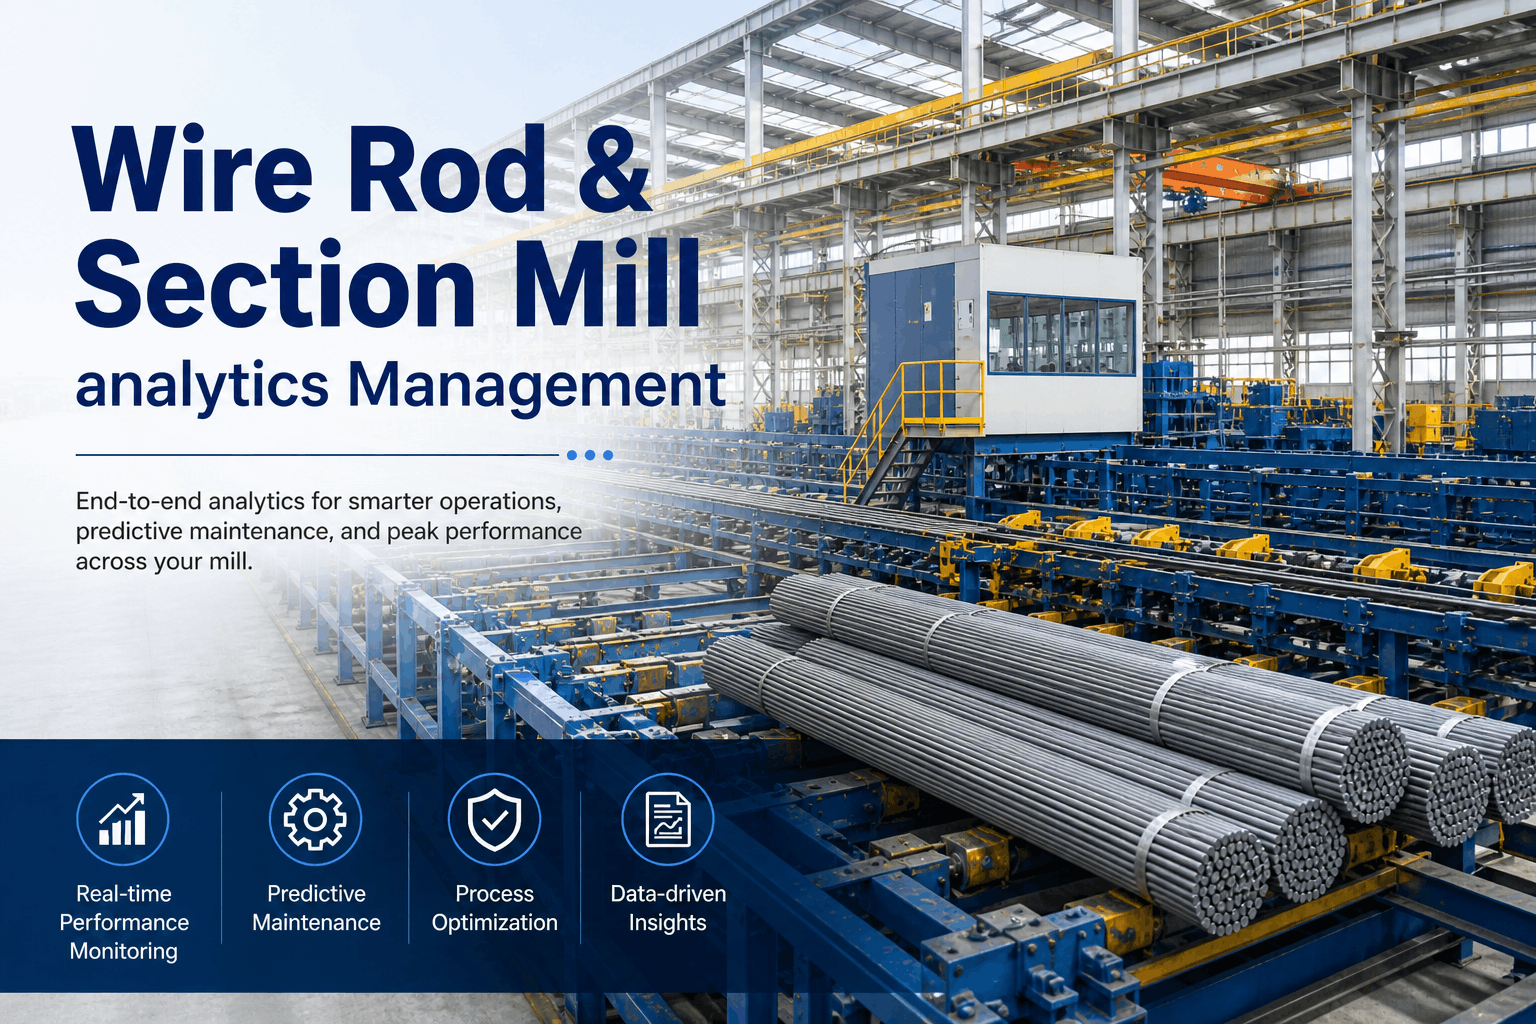
Master High-Speed Rolling with AI-Driven Wire Rod & Section Mill Analytics
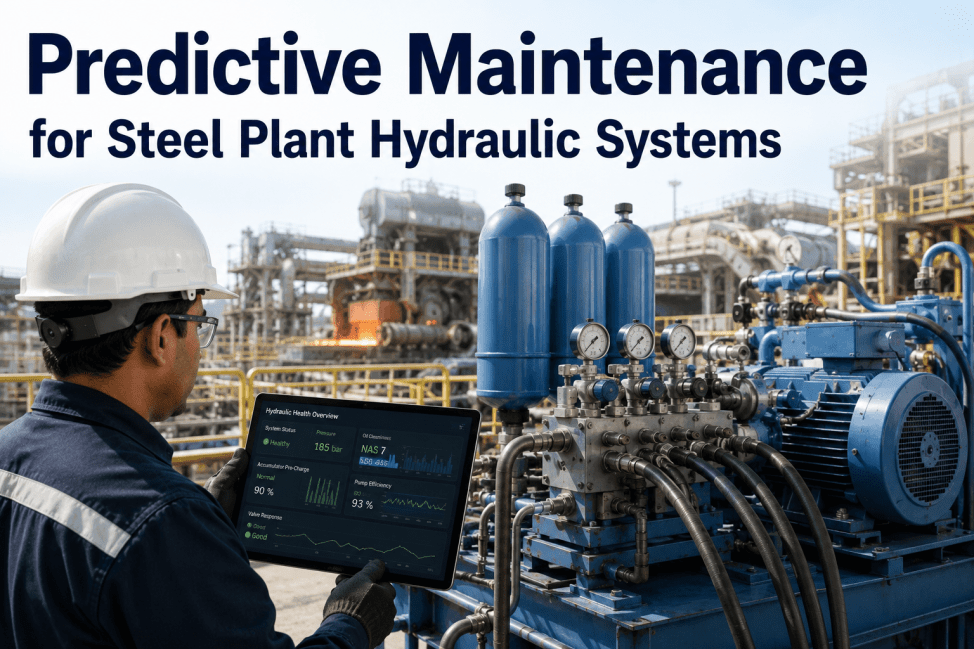
Finishing block vibration tracking, Stelmor cooling synchronization, and real-time cobble prevention — iFactory transforms long-product rolling into a high-precision digital process.
The Real-Time Analytics Problem Hiding Inside Wire Rod Mills
Why "Connected" Doesn't Mean "Visible" in High-Speed Rolling
Most wire rod and section mills have invested in PLC connectivity and IoT sensors, yet the production floor remains plagued by reactive maintenance and quality rejects. The problem is not a lack of data—it is a **Decision Latency Gap**. A sensor transmitting vibration data at 10kHz means nothing if the analytics layer aggregating that signal refreshes on a 20-minute batch cycle. On a high-speed rod line, a quality deviation can propagate through 3 kilometers of material in under 30 seconds. Batch-cycle analytics delivers insights after the damage has already been coiled and tagged. iFactory eliminates this gap by processing data at the edge, ensuring that an anomaly in the laying head or a temperature drop in the reform tub is surfaced to the operator in under 200ms.
5 Root Causes of Analytics Failure in Section & Rod Mills
Diagnosing the visibility gap before it results in a massive mill cobble or metallurgical non-compliance event is critical for operational stability.
The 6 Strategic Pillars of Wire Rod & Section Mill Analytics
True mill mastery requires a synchronized view of mechanical forces, thermal dynamics, and high-speed motion control across the entire rolling sequence.
Finishing Block Vibration Analytics
Monitors No-Twist stands at high frequencies. AI identifies bearing spalls and roll-ring eccentricity in real-time, allowing maintenance to be scheduled before a catastrophic stand failure occurs.
Laying Head & Stelmor Sync
Coordinates laying head RPM with Stelmor conveyor speed and fan cooling intensity. Ensures uniform ring spacing and precise metallurgical properties (Tensile/Elongation) across the entire coil length.
Billet Reheat Thermal Modeling
Correlates furnace zone temperatures with roughing mill load. AI identifies billet "Cold-Spots" that cause impact-load damage to mill stands, optimizing fuel consumption while protecting mechanical assets.
Section Geometry Control
Real-time laser-based monitoring for structural beams, channels, and angles. AI detects flange height deviations and web-thickness variations, enabling closed-loop roll-gap adjustments for ASTM/EN compliance.
Guide & Bearing Health Integrity
Detects the acoustic signatures of mill guide wear. Pre-cobble alerts prevent the rod from "leaving the pass," saving the mill from hours of downtime and thousands of dollars in mechanical repair costs.
Cooling Bed & Reform Tub Intelligence
Monitors cooling gradients in reform tubs and collection stations. AI predicts metallurgical banding and ensures that coil physical properties are uniform, reducing customer claims for high-carbon rod applications.
Long Product Yield Matrix — AI vs. Manual Control
| Mill Segment | Target Yield | iFactory AI Yield | Manual Yield | Verdict |
|---|---|---|---|---|
| Wire Rod (High Speed) | 97% | 98.9% | 95.4% | +3.5% Recovery |
| Structural Section (Beams) | 94% | 96.2% | 91.8% | +4.4% Recovery |
| Special Steel Profiles | 92% | 94.8% | 88.6% | +6.2% Recovery |
Fixing the Mill Analytics Visibility Gap: A 5-Step Roadmap
Voice of the Mill Operations Director
In a wire rod mill, a single cobble costs us upwards of $40,000 in lost material and downstream downtime. We used to rely on operator hearing and monthly vibration checks. iFactory's finishing block analytics changed everything. We caught three bearing failures and a guide misalignment in the last quarter before they could cause a cobble. Closing that 20-minute analytics gap was the single best investment we've made in five years.
Frequently Asked Questions
Can iFactory analytics track high-speed finishing block stands?
Yes. We ingest high-frequency vibration and motor load data at 10ms intervals, using edge-AI to detect bearing spalls and eccentricity during 100m/s rolling speeds.
How does the system prevent mill cobbles?
By identifying "Pre-Cobble" vibration signatures in mill guides and stand bearings, the AI alerts operators to slow the mill or stop before the rod leaves the pass.
Does the platform synchronize Stelmor cooling with laying head speed?
Yes. iFactory correlates laying head RPM with conveyor speed and fan intensity, ensuring perfect ring spacing and uniform metallurgical properties throughout the coil. Schedule a cooling sync demo.
How long does it take to deploy iFactory on a wire rod mill?
Standard connectivity and live dashboards are operational in 4 weeks. Predictive cobble models and finishing block diagnostics are typically fully calibrated by Week 12.
Can iFactory monitor section mill geometry in real-time?
Yes. We integrate with laser-profiling systems to monitor flange height, web thickness, and straightness for structural beams and channels during the rolling process.
Does the platform provide energy optimization for the reheat furnace?
Absolutely. By correlating furnace temperatures with roughing stand load, the AI optimizes gas consumption while ensuring billets are thermally uniform for rolling.
What is the "Invisible Yield Gap" in long product rolling?
It is the accumulated loss from undetected process drift—such as slight geometric variations or inconsistent cooling—that results in prime-grade downgrades or excess crop-loss.
Is the system compatible with legacy mill stands?
Yes. We use external vibration and thermal sensors to bring legacy mechanical stands into the digital age, providing modern predictive capabilities to older mill assets.
Close Your Mill's Analytics Visibility Gap Today
Eradicate mill cobbles and maximize prime-yield recovery with iFactory's genuine real-time production intelligence for wire rod and section mills.