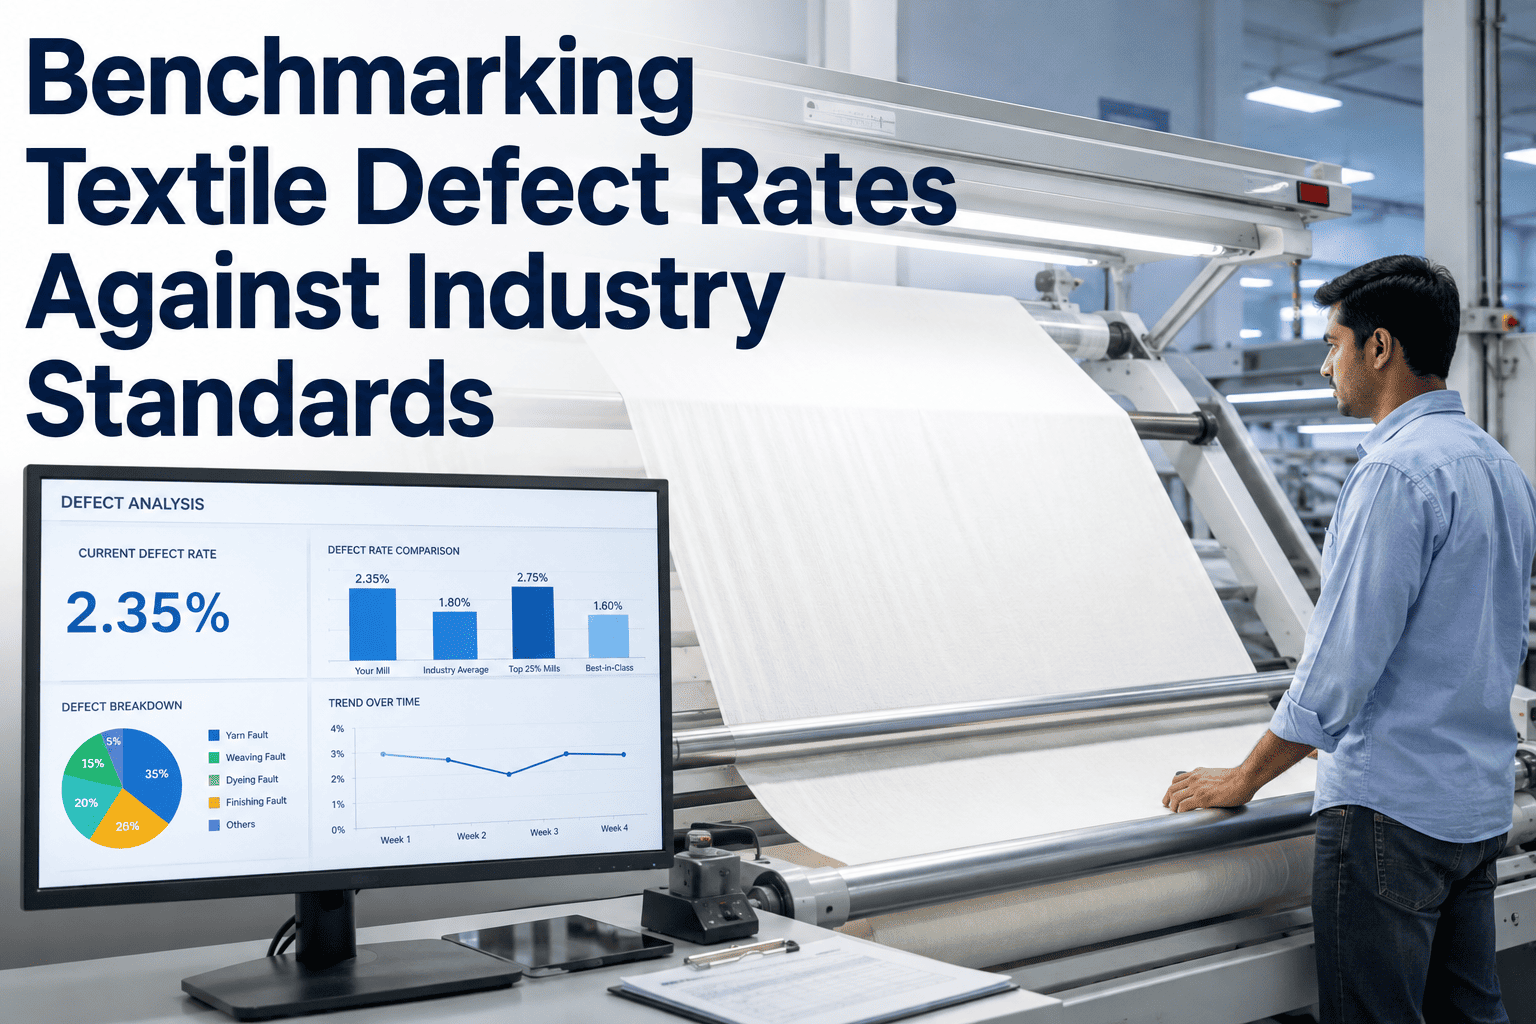
Manufacturing excellence awards and industry benchmarks share a quiet secret: the mills that consistently place well rarely won by inventing a single breakthrough technique. They won by measuring the same handful of performance metrics as everyone else, but doing it continuously and honestly enough to close gaps their competitors never even saw. A mill chasing an excellence award without first understanding where it genuinely stands against sector benchmarks for OEE, defect rate, and on-time delivery is essentially applying for a test it hasn't studied for. Benchmarking done properly turns a vague ambition to be world-class into a specific, measurable gap list a leadership team can actually close. Mills ready to build that kind of benchmarking discipline can start the conversation with iFactory's support team.
World-Class Isn't a Feeling. It's a Number You Can Compare Against the Sector.
iFactory tracks your mill's OEE, defect rate, and delivery performance against sector benchmarks continuously, turning the vague goal of excellence into a specific, closeable gap list your leadership team can act on.
Why Award Applications Fail When Benchmarking Is an Afterthought
Excellence award applications and benchmarking exercises are frequently treated as a once-a-year documentation exercise, assembled from whatever performance data happens to be easiest to pull together the month before a submission deadline. Mills that actually place well approach benchmarking as a continuous operating discipline instead, which means the data behind their application was never manufactured for the occasion, it was simply always there.
Metrics Defined Differently Across Departments
If spinning calculates OEE differently than weaving, the resulting mill-wide number can't be honestly compared against any external benchmark.
No Continuous Tracking, Only Annual Snapshots
A single data pull assembled right before an application deadline reflects one month's performance, not the sustained excellence the award is actually meant to recognize.
Benchmarks Chosen to Flatter, Not Inform
Comparing against an outdated or generous industry figure feels good in a presentation but does nothing to reveal where real improvement is still needed.
Best Practices Never Actually Adopted Internally
Studying what leading mills do differently only matters if the findings translate into a specific, tracked change on the floor rather than a slide in a strategy deck.
The Core Metrics Every Textile Benchmark Should Include
Different awards and frameworks weigh criteria differently, but nearly all of them converge on the same handful of core operational metrics because these are the numbers that most reliably separate genuinely excellent mills from average ones.
| Metric | Sector Average | World-Class Benchmark | What It Signals |
|---|---|---|---|
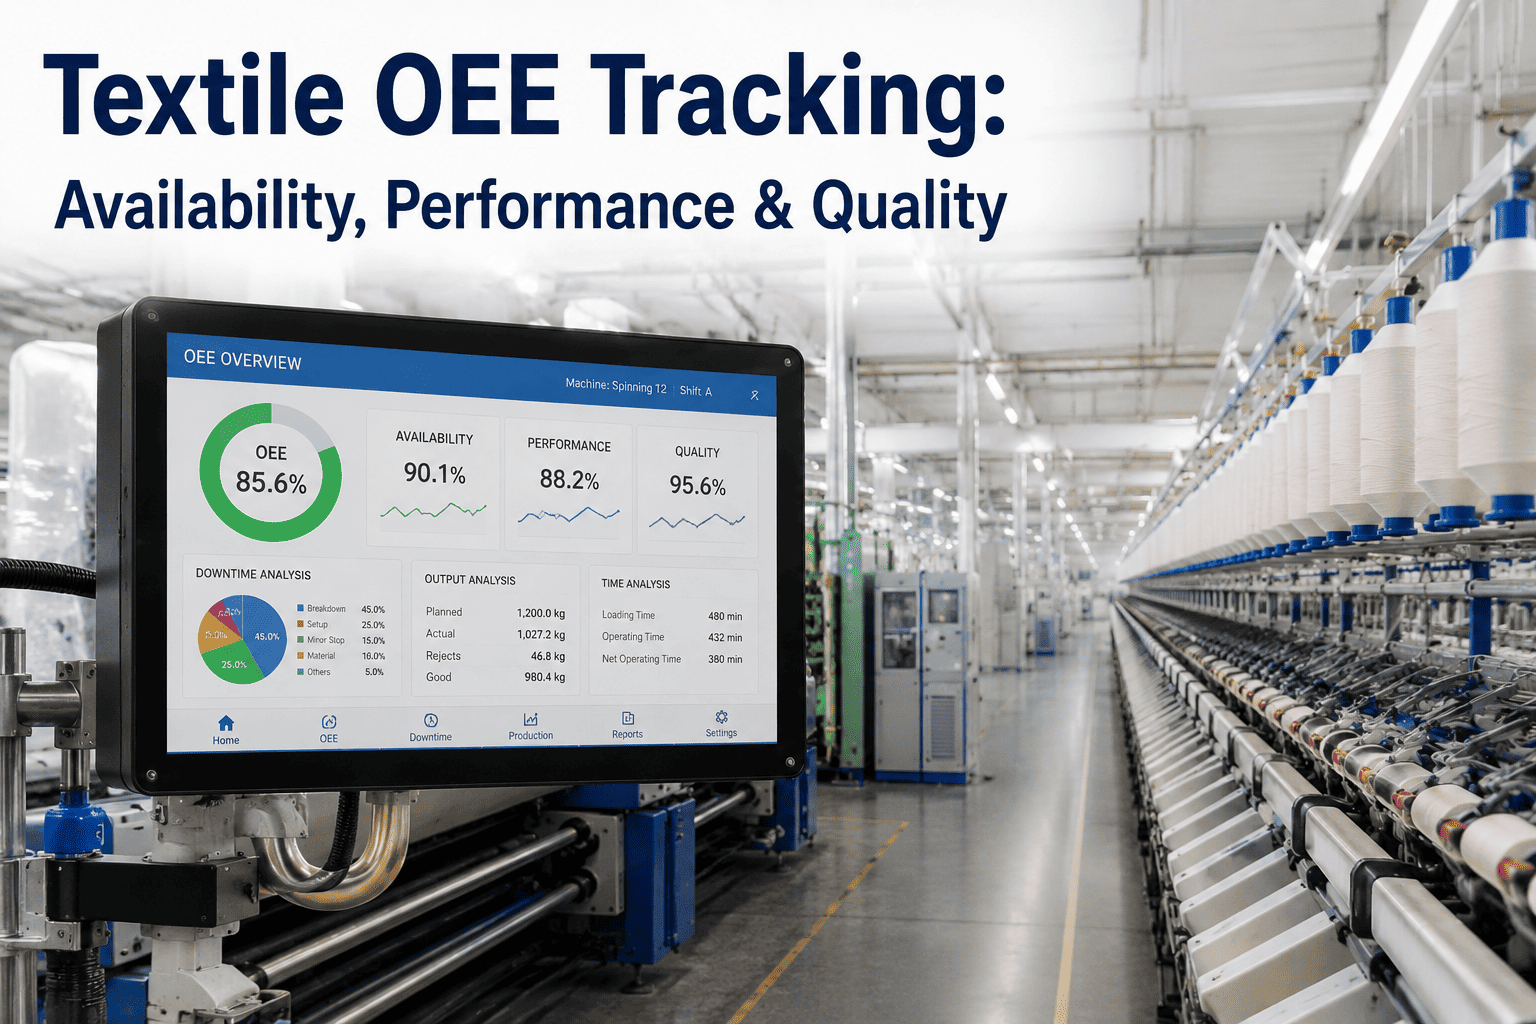
| Overall Equipment Effectiveness | ~60-75% | 85%+ | Combined availability, performance, quality |
| First Pass Quality Rate | ~92-96% | 99%+ | Process control and defect prevention |
| On-Time Delivery | ~85-92% | 97%+ | Planning discipline and supply reliability |
| Unplanned Downtime | ~10-15% | Under 5% | Maintenance maturity and equipment reliability |
Turning a Benchmark Gap Into an Improvement Plan
A benchmark comparison only has value once it becomes a specific action plan, and the sequence below is how a genuine gap turns into a tracked improvement rather than a static report.
Standardize How Every Metric Is Calculated
A single, documented calculation method applied consistently across every department, so the benchmark comparison is actually valid.
Compare Against Current Sector Data
Sourced from current industry reporting rather than a figure carried forward from a previous year's application without verification.
Rank the Gaps by Achievable Impact
Not every gap deserves equal priority, and the most valuable early wins are usually the ones with the clearest, fastest path to closing.
Assign Ownership and a Tracking Cadence
A gap without a named owner and a review schedule tends to remain a gap indefinitely, regardless of how clearly it was identified.
Turn Benchmark Gaps Into a Plan Your Team Can Actually Execute
iFactory continuously tracks OEE, quality rate, and delivery performance against current sector benchmarks, so excellence becomes a tracked plan instead of an annual application scramble.
A Composite Scenario: The Gap Nobody Had Actually Measured
A composite textile group had applied for a regional manufacturing excellence award twice without success, each time submitting a strong narrative about quality culture but relatively thin operational data. Ahead of a third attempt, the leadership team committed to building a genuine continuous benchmarking practice first, standardizing OEE calculation across all three of its plants and comparing the results honestly against current sector figures rather than the flattering historical numbers used in previous applications.
The exercise revealed an OEE gap far larger than leadership had assumed, driven mostly by unplanned downtime at one specific plant that had been quietly underperforming the group average for over a year without a clear owner assigned to the problem. Rather than waiting for the award cycle, the group treated the finding as an immediate improvement priority, assigning a dedicated downtime reduction owner and tracking weekly progress. By the time the next award cycle arrived, the group's real OEE had climbed meaningfully, and the application was built on twelve months of consistent, defensible data instead of a single flattering quarter.
Common Mistakes in Benchmarking and Excellence Programs
Comparing Against Outdated Sector Figures
Industry benchmarks shift over time, and comparing against a figure that's several years old routinely flatters a mill's actual competitive position.
Letting Each Plant Define Metrics Differently
A multi-site group without a single standardized calculation method can't honestly compare its own plants to each other, let alone to the sector.
Chasing the Award Instead of the Underlying Performance
A narrative built to win a specific award without the operational substance behind it rarely survives serious scrutiny from judges or auditors.
No Follow-Through on Identified Gaps
A benchmarking report that identifies gaps but assigns no owner or timeline produces insight without any actual improvement.
Is Your Mill Ready to Benchmark Against Real Sector Data
Every plant or department calculates core metrics the same way
A standardized OEE, quality rate, and delivery calculation is the prerequisite for any benchmark comparison to be meaningful.
You track performance continuously, not just before an application
Ongoing tracking produces the sustained, defensible data record that genuinely differentiates a strong application from a flattering snapshot.
Leadership is willing to act on an unflattering gap
The value of benchmarking depends entirely on treating a real gap as a priority to close, not a finding to explain away.
Improvement plans get assigned an owner and a review date
A gap without accountability tends to remain a gap through the next benchmarking cycle and the one after that.
Frequently Asked Questions
What OEE benchmark should a textile mill actually be aiming for?
Sector averages for textile manufacturing commonly sit somewhere in the sixty to seventy-five percent range depending on process stage and equipment age, while world-class performance across manufacturing more broadly is typically cited around eighty-five percent or higher. The right target for a specific mill depends heavily on its current baseline and equipment condition, which is why an honest internal benchmark, measured continuously, matters more than chasing a single generic industry number. Mills wanting help setting a realistic OEE target can talk to iFactory support about their specific baseline.
How often should benchmark comparisons actually be updated?
Continuous or at minimum monthly tracking gives leadership a realistic view of where the mill stands, while an annual snapshot built only ahead of an award application or audit tends to reflect one favorable period rather than sustained performance. Sector benchmark figures themselves should also be refreshed periodically, since a comparison against data several years old routinely overstates a mill's actual competitive position.
Does chasing a manufacturing excellence award actually improve real performance?
It can, but only when the pursuit is grounded in genuine, continuous operational improvement rather than a documentation exercise assembled just before the deadline. Mills that treat the benchmarking behind an award application as a year-round operating discipline tend to see the underlying metrics improve regardless of whether they win, since the process of honest measurement and gap-closing is where the real value sits, not the award itself.
How do we compare fairly across plants with different equipment ages and product mixes?
Standardizing the calculation method is the essential first step, but a fair comparison also usually needs some normalization for product complexity or equipment vintage, since a newer, simpler-product plant will naturally outperform an older, high-mix facility on raw OEE alone. Tracking each plant's trend over time against its own baseline, alongside the cross-plant comparison, gives a more complete and fair picture than a single ranked list. Book a demo to see how multi-plant benchmarking gets structured to stay fair across different operations.
What's the fastest way to start a benchmarking practice if we've never tracked these metrics consistently before?
Start by standardizing just the two or three metrics that matter most for your specific goals, typically OEE, first pass quality rate, and on-time delivery, and get those calculated the same way across every department before adding more. A narrow, consistent starting point produces trustworthy data faster than an ambitious multi-metric program that stalls out on definitional disagreements before it ever produces a usable number.
Replace the Annual Scramble With Continuous, Defensible Benchmark Data
iFactory tracks your mill's core performance metrics against current sector benchmarks continuously, turning excellence into a plan your team can execute, not just a slide in an application.