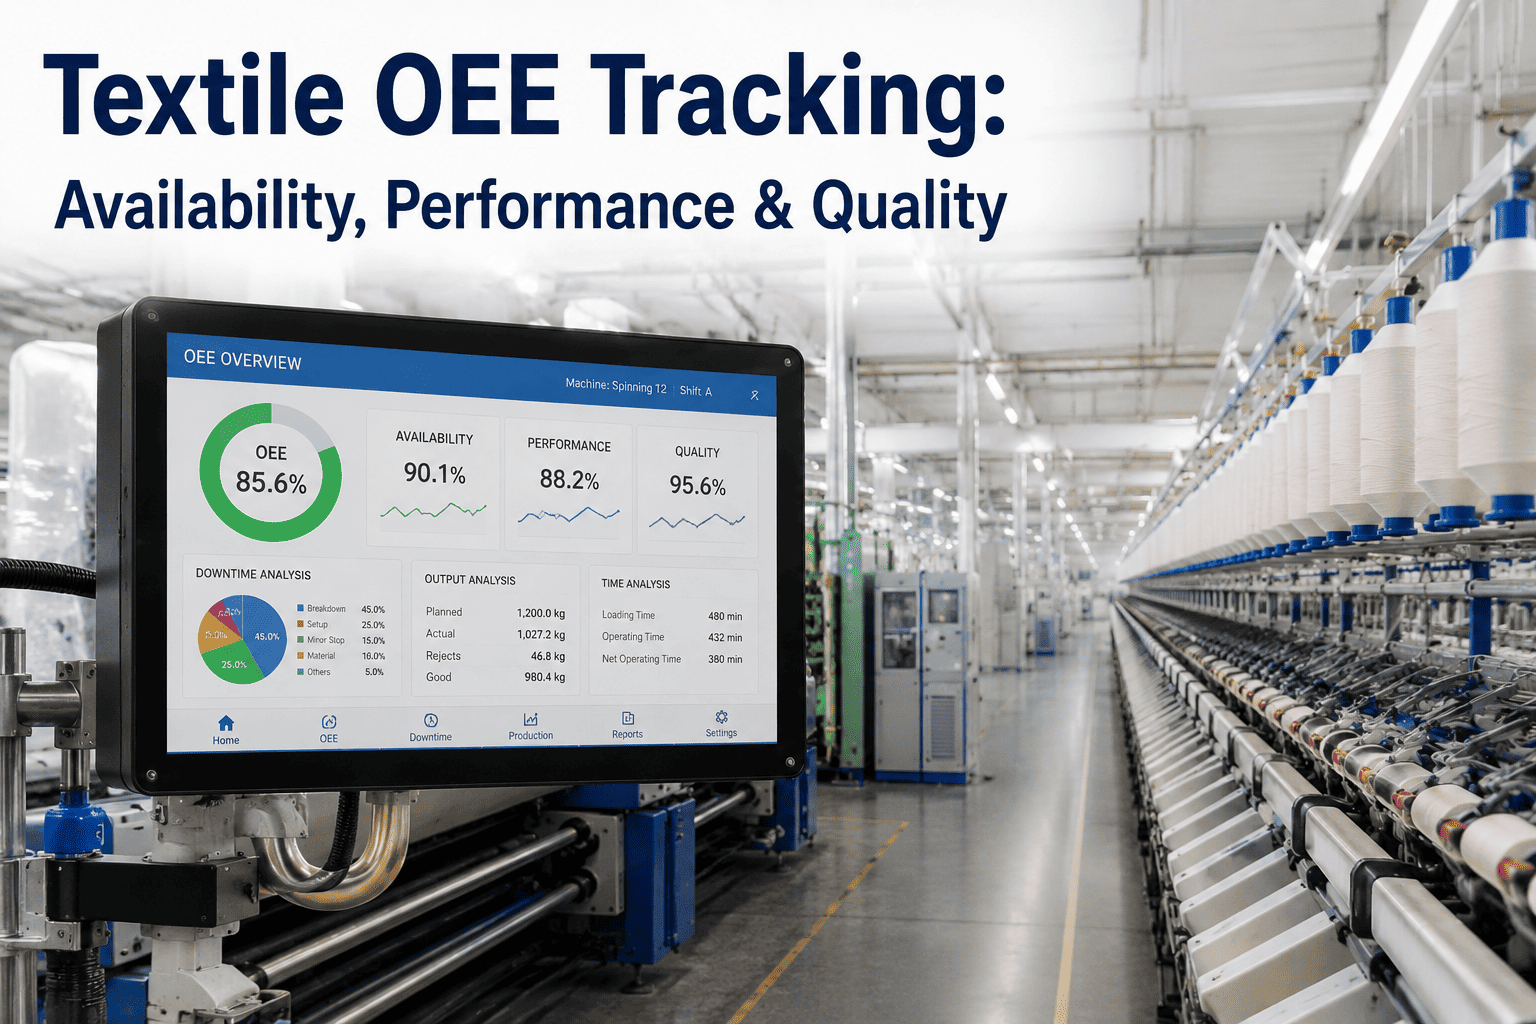
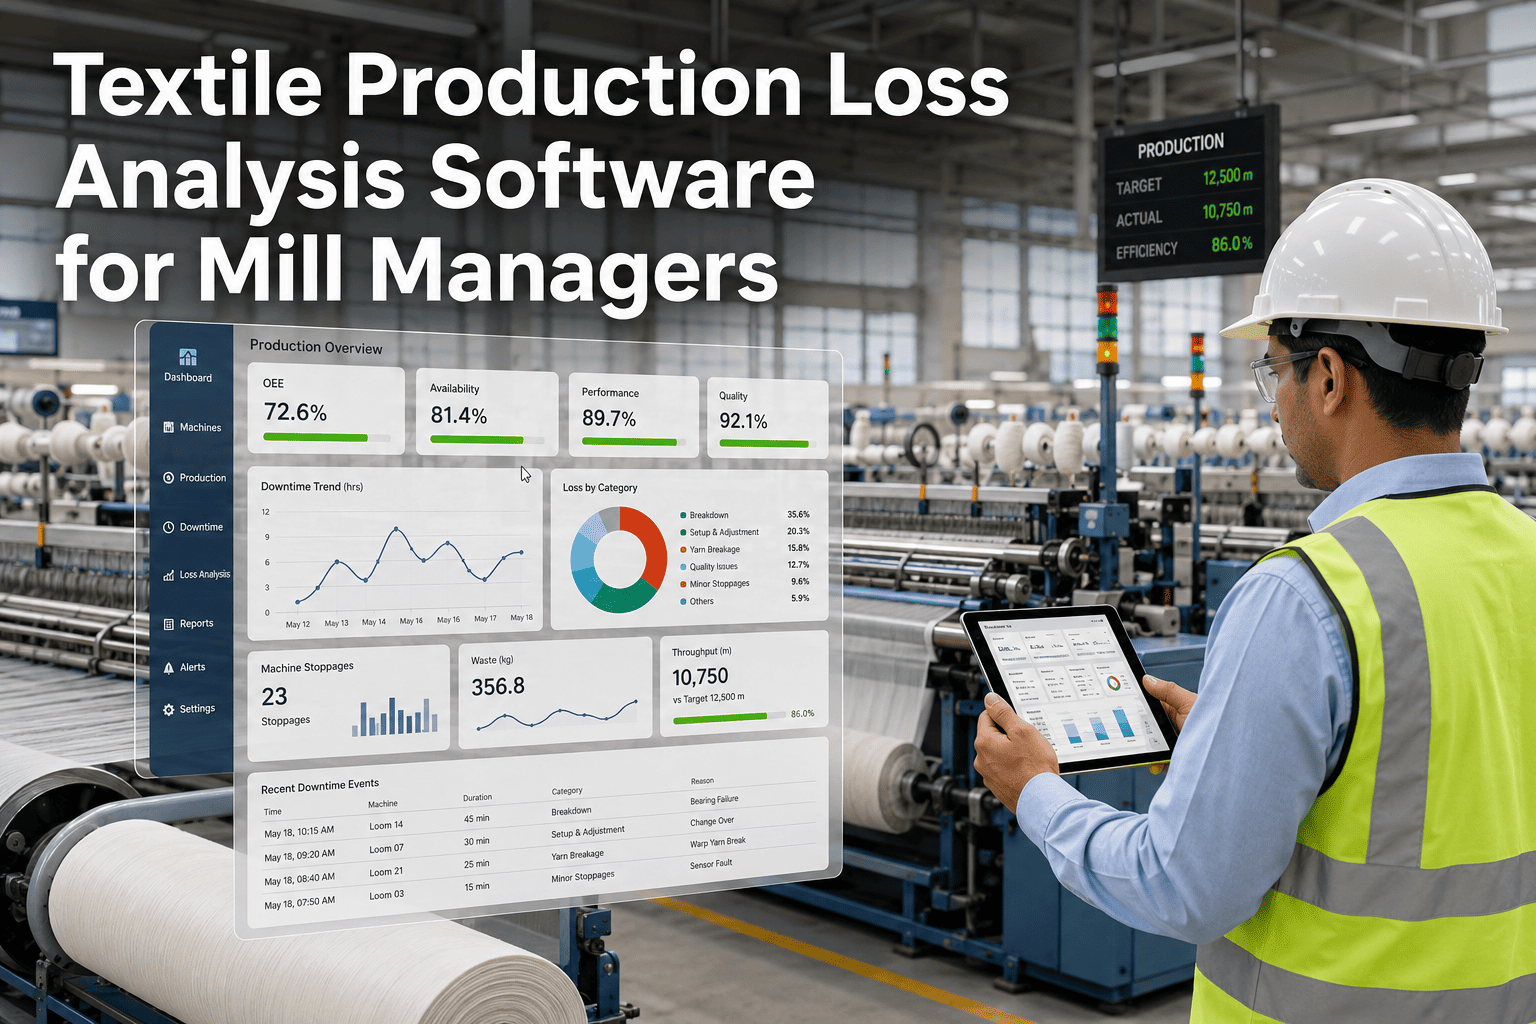
Most textile plants know their OEE number is bad. Almost none of them know why. A weaving shed running at 52% OEE and a spinning unit running at 52% OEE are losing production for completely different reasons, but when the number is calculated once a shift on a whiteboard, that difference disappears into a single flat percentage. Availability loss, performance loss, and quality loss each point to a different fix, a different owner, and a different budget line, and lumping them together is why so many improvement projects target the wrong machine for months. Book a demo to see automated OEE tracking broken into the three losses on your own production floor.
Textile Manufacturing · OEE Analytics
Stop Reporting One OEE Number. Start Fixing Three Different Losses.
Automated availability, performance, and quality tracking that tells your production team exactly which loss is eating output on which machine, every shift, without a manual log sheet.
3Independent losses hidden inside a single OEE percentage
85%World-class OEE benchmark most textile lines never reach
ShiftHow often manual OEE logs are usually updated, at best
Why the Whiteboard Breaks
Manual OEE Tracking Collapses the Moment a Shift Gets Busy
A supervisor logging stop reasons by hand is doing that job on top of running the floor. The first thing that gets skipped when a shift gets difficult is exactly the data that would explain why the shift was difficult.
Stop Reasons Get Bucketed as "Other"
Short stops under two minutes are the hardest to log by hand and the most common cause of performance loss, so they are the first entries operators skip.
Speed Loss Is Invisible Without a Sensor
A machine running 12% below rated speed all shift produces a loss nobody notices on a walk-through, because it never actually stops.
Quality Loss Is Recorded After the Fact
Fabric or yarn defects are usually caught downstream, hours after the machine that caused them has already moved on to a different roll or lot.
The Number Arrives Too Late to Act On
A shift-end OEE calculation tells you what already happened. It cannot tell an operator to slow down a loom that is about to jam.
Automated Data Flow
Where the Three Losses Actually Get Measured
Automated OEE tracking pulls directly from machine controllers and inspection points instead of a memory-based log, so every stop, every speed change, and every defect is timestamped and attributed to a cause without operator input.
1
Machine Signal Capture
Run and stop states are read directly from the loom, spinning frame, or dyeing machine controller, removing manual stop logging entirely.
2
Speed and Cycle Comparison
Actual output rate is compared against the rated speed for that specific product and setting, so performance loss is measured continuously, not estimated.
3
Defect and Rework Linking
Quality inspection results are linked back to the machine, shift, and lot that produced them, closing the gap between a defect and its source.
4
Live Loss Attribution
Every minute of lost time is categorized into availability, performance, or quality automatically, and surfaced to supervisors before the shift ends.
Root Cause Mapping
What Actually Sits Behind Each Loss Category on a Textile Floor
Naming a loss category is only useful if it points to a real, fixable cause on the specific machine type you run. The same three categories look completely different depending on whether you are looking at a loom, a spinning frame, or a dyeing machine, which is why a generic OEE dashboard rarely gets adopted by the people who actually have to act on it.
Weaving
AvailabilityWarp breaks, beam changeovers, and shuttle or carrier faults account for most stopped time on conventional looms.
PerformanceConservative pick rate settings held over from an older fabric construction quietly cap output well below rated speed.
QualityWeft bars, reed marks, and density variation surface only after the fabric reaches inspection, hours after the loom ran it.
Spinning
AvailabilityEnd-down stoppages, doffing cycles, and roving supply gaps are the dominant source of stopped spindle time.
PerformanceTraveler wear and tension drift force gradual speed reductions that rarely get logged as a formal event.
QualityCount variation and imperfections trace back to draft roller condition, but only if the lot is linked to the exact frame.
Dyeing
AvailabilityPump, valve, and heat exchanger failures stop a full batch and often the machines scheduled behind it.
PerformanceExtended ramp times from an underperforming heat exchanger silently stretch every cycle beyond its standard duration.
QualityShade variation and unlevel dyeing are usually discovered at the next process stage, well after the machine is free to run again.
Benchmarks
What a Realistic OEE Target Looks Like by Machine Type
World-class OEE of 85% is a useful reference point, but it was never derived from a textile mill, and chasing it as a blanket target across every machine type usually sets teams up to dismiss the metric entirely. A more useful approach is to set a realistic band per machine category and track movement within it.
Air-Jet and Rapier Looms
A well-run shed typically operates in the 65% to 75% range once automatic weft repair and short-stop capture are both in place, with availability loss usually the largest remaining gap.
Ring Spinning Frames
Mature ring spinning operations commonly sit between 80% and 88%, since end-down and doffing losses are well understood, leaving performance loss from traveler wear as the main lever.
Batch Dyeing Machines
Batch dyeing tends to run lower, often 55% to 68%, because a single mechanical failure or shade correction cycle removes a large block of time in one event rather than many small stops.
See Your Availability, Performance, and Quality Losses Split Apart, Machine by Machine.
iFactory reads directly from your loom, spinning, and dyeing controllers to build a live OEE breakdown your production and quality teams can actually act on.
Manual vs. Automated
What Changes When OEE Tracking Stops Being a Whiteboard Exercise
| Measurement Area | Manual Log Sheet | Automated Tracking |
| Short Stop Capture | Stops under two minutes are rarely logged consistently | Every stop is timestamped directly from the controller |
| Speed Loss Visibility | Not visible unless someone times the machine manually | Continuously compared against rated speed in real time |
| Defect Source Tracing | Defects are attributed hours later by memory or guesswork | Defects are linked to machine, shift, and lot automatically |
| Reporting Frequency | Calculated once per shift, often the next morning | Updated continuously throughout the running shift |
| Root Cause Ranking | Requires a separate manual Pareto exercise after the fact | Loss categories are ranked automatically by minutes lost |
From the Floor
What a Split OEE Number Revealed on One Weaving Shed
Our OEE had been stuck around 58% for over a year, and every review meeting turned into an argument about whether it was a maintenance problem or a production problem, because the number itself did not say. When we finally split it into the three losses, availability was actually fine — it was performance loss from looms running below rated speed on a specific fabric construction that was dragging the number down. Maintenance had been chasing breakdowns that were not the real issue. Once we knew that, the fix was a settings change on four looms, not a capital request for new machines.
— Production Manager, Composite Weaving Unit, Northern India
Getting Started
Five Questions to Ask Before Your Next OEE Review Meeting
A production team that can answer these five questions for its worst-performing machine already has the diagnostic power that most manual OEE logs never provide.
01
Which of the three losses — availability, performance, or quality — accounts for most of the gap to target?
02
Are short stops under two minutes being captured at all, or only stops long enough for someone to notice?
03
Is speed loss measured against the rated speed for the exact product running, or a generic average?
04
Can a specific defect be traced back to the machine, shift, and lot that produced it within minutes?
05
Does the OEE number reach the supervisor while the shift is still running, or only the next morning?
Frequently Asked Questions
Textile OEE Tracking — Common Questions
Why does splitting OEE into three losses matter more than the overall percentage?
A single OEE percentage tells you how far you are from world-class performance, but it cannot tell you which department should act on it. Two machines can both sit at 55% OEE for entirely different reasons — one losing time to breakdowns and changeovers, the other losing time to running slow or producing rework. Splitting the number into availability, performance, and quality loss routes the problem to the right owner immediately, instead of triggering a generic and often misdirected improvement project.
Contact support if you want help mapping your current OEE calculation into the three loss categories.
What data does automated OEE tracking need from a textile machine?
At minimum, it needs a run and stop signal from the machine controller, a count of output cycles or meters produced, and a way to record defects or rework against a specific machine and time window. Most modern loom, spinning, and dyeing controllers already expose this data through a standard interface, which means automated tracking can usually be connected without replacing existing equipment. Older mechanical machines may need a simple sensor retrofit to capture run state accurately.
How is performance loss different from availability loss in a weaving shed?
Availability loss happens when a loom is completely stopped — a warp break, a changeover, or a mechanical fault that halts production entirely. Performance loss happens while the loom is still running, but slower than its rated speed for that fabric construction, often because of a conservative speed setting, minor tension issues, or accumulated small stops that never register as a full stop. A loom can have excellent availability and still lose significant output to performance loss if nobody is comparing actual speed against the rated benchmark.
Can automated OEE tracking work alongside an existing manual reporting process?
Yes, and most textile plants run both in parallel for a transition period before retiring the manual log sheet entirely. Automated tracking typically surfaces the exact minutes of discrepancy against the manual number, which is often the fastest way to demonstrate to a plant manager where manual logging was missing short stops or misattributing quality loss. Once the automated numbers are trusted, the manual sheet is usually phased out within a few weeks.
What is a realistic OEE improvement timeline after implementing automated loss tracking?
Most plants see their first measurable gain within four to six weeks, once the true dominant loss category is identified and a targeted fix is applied to the highest-loss machines. The larger gains, moving from a reactive fix to a systematic reduction across the whole line, typically take two to three months as the pattern of losses across shifts and products becomes clear enough to change standard operating settings rather than react machine by machine.
Your OEE Number Isn't the Problem. Not Knowing Which Loss Caused It Is.
See availability, performance, and quality loss tracked separately, by machine and by shift, with automated data pulled directly from your textile floor.