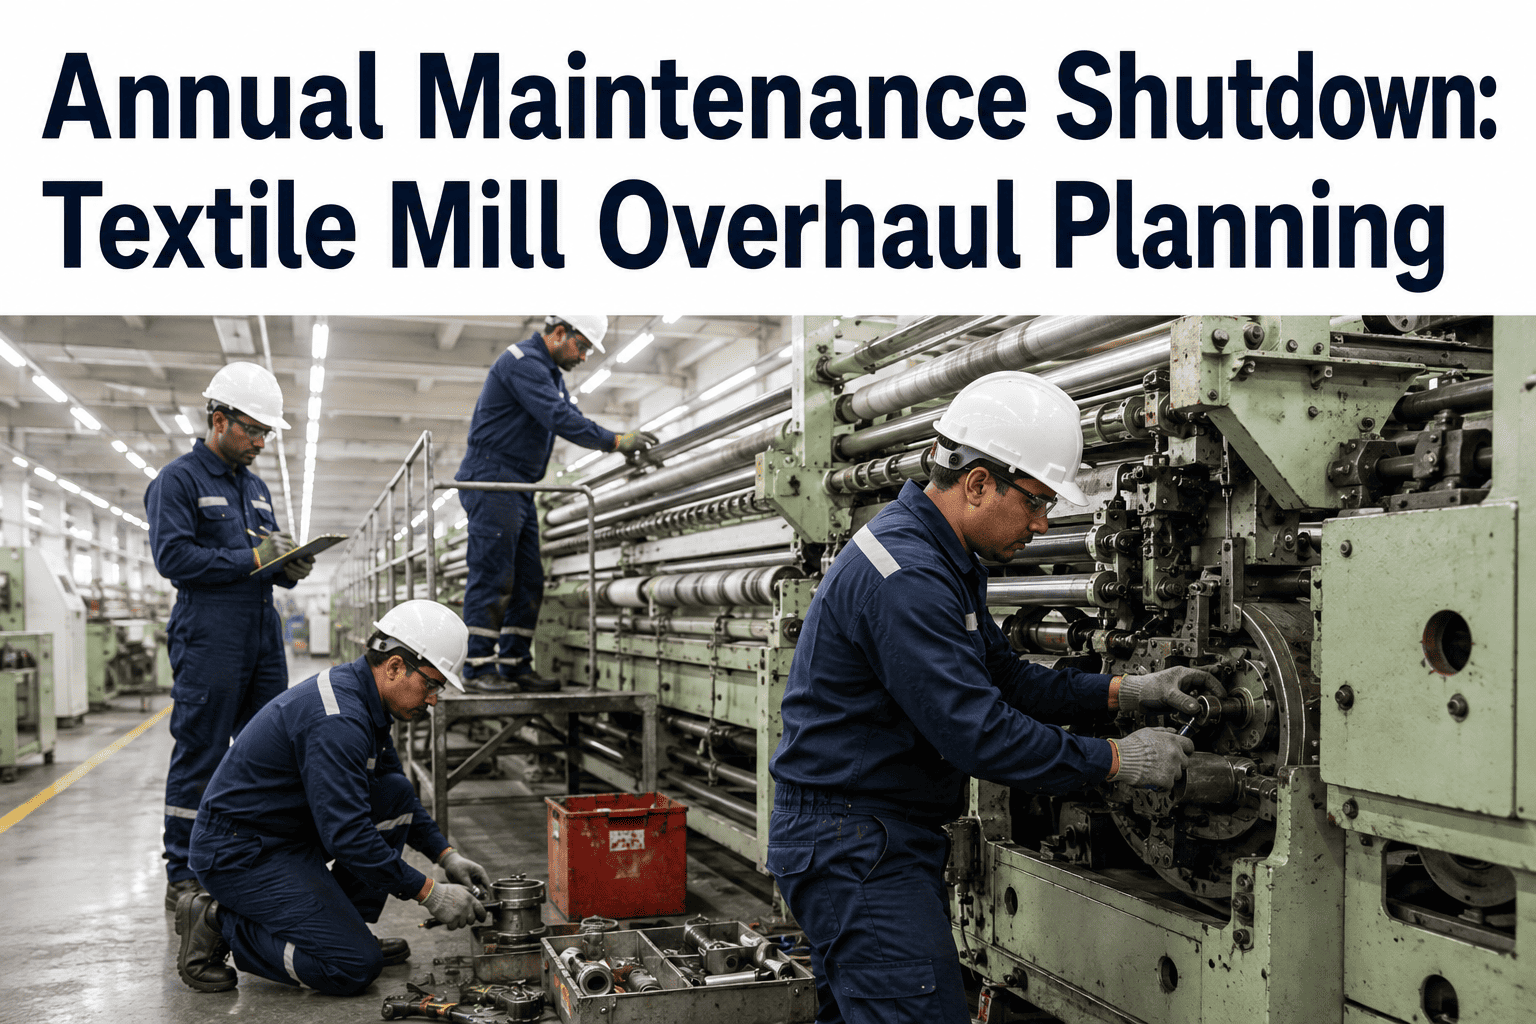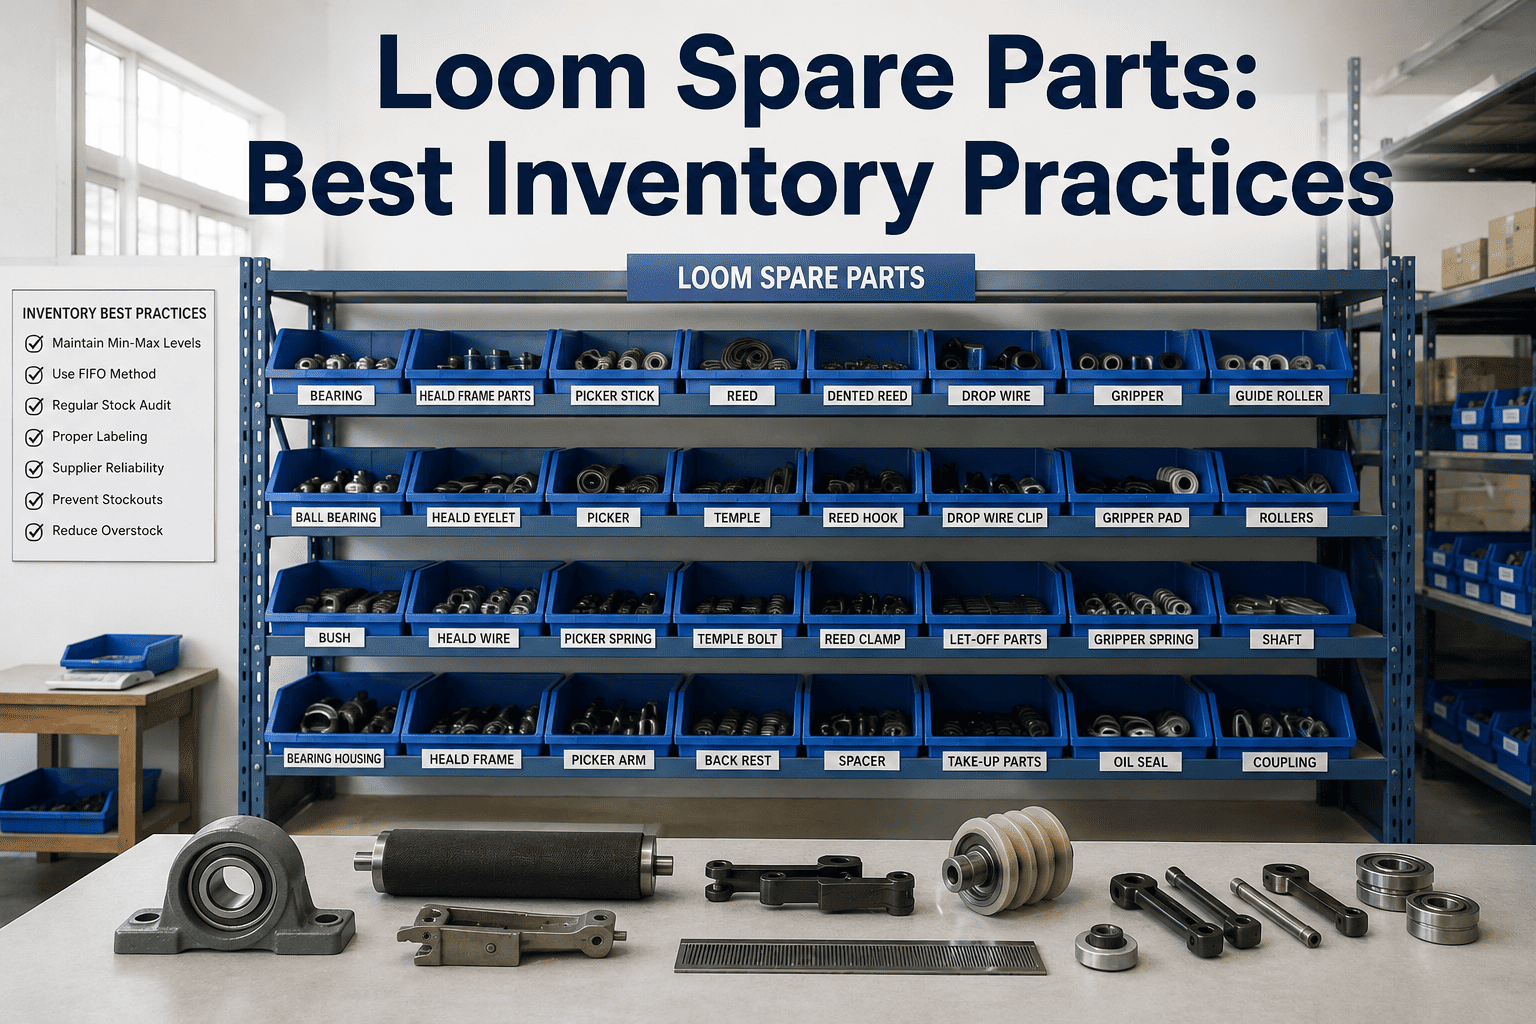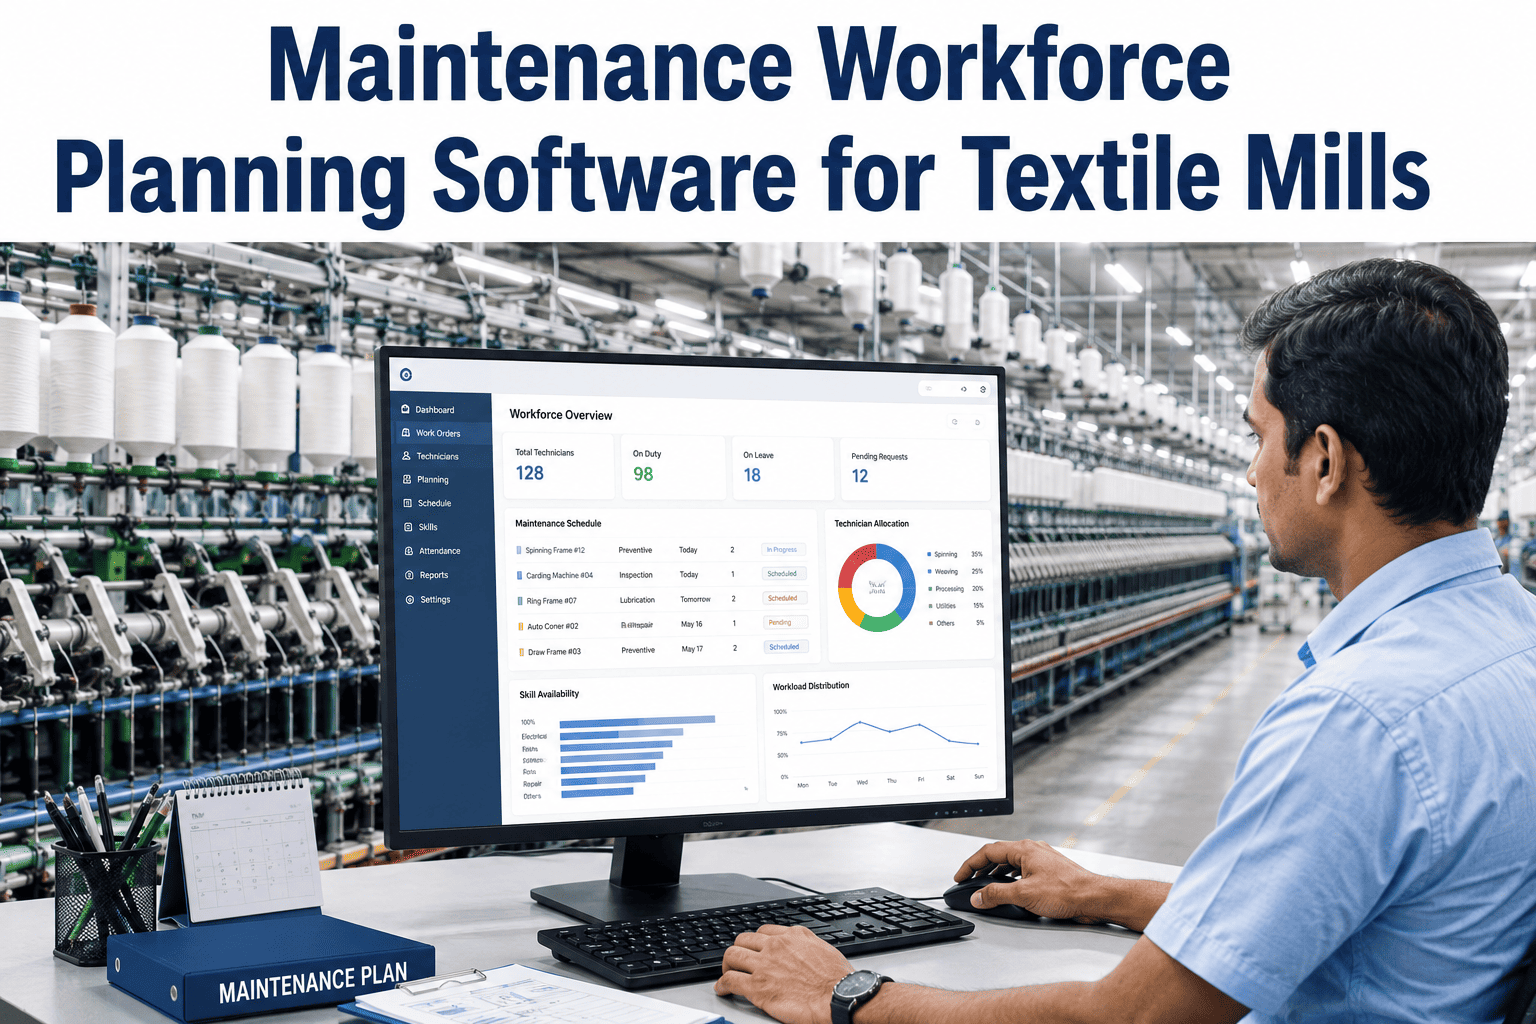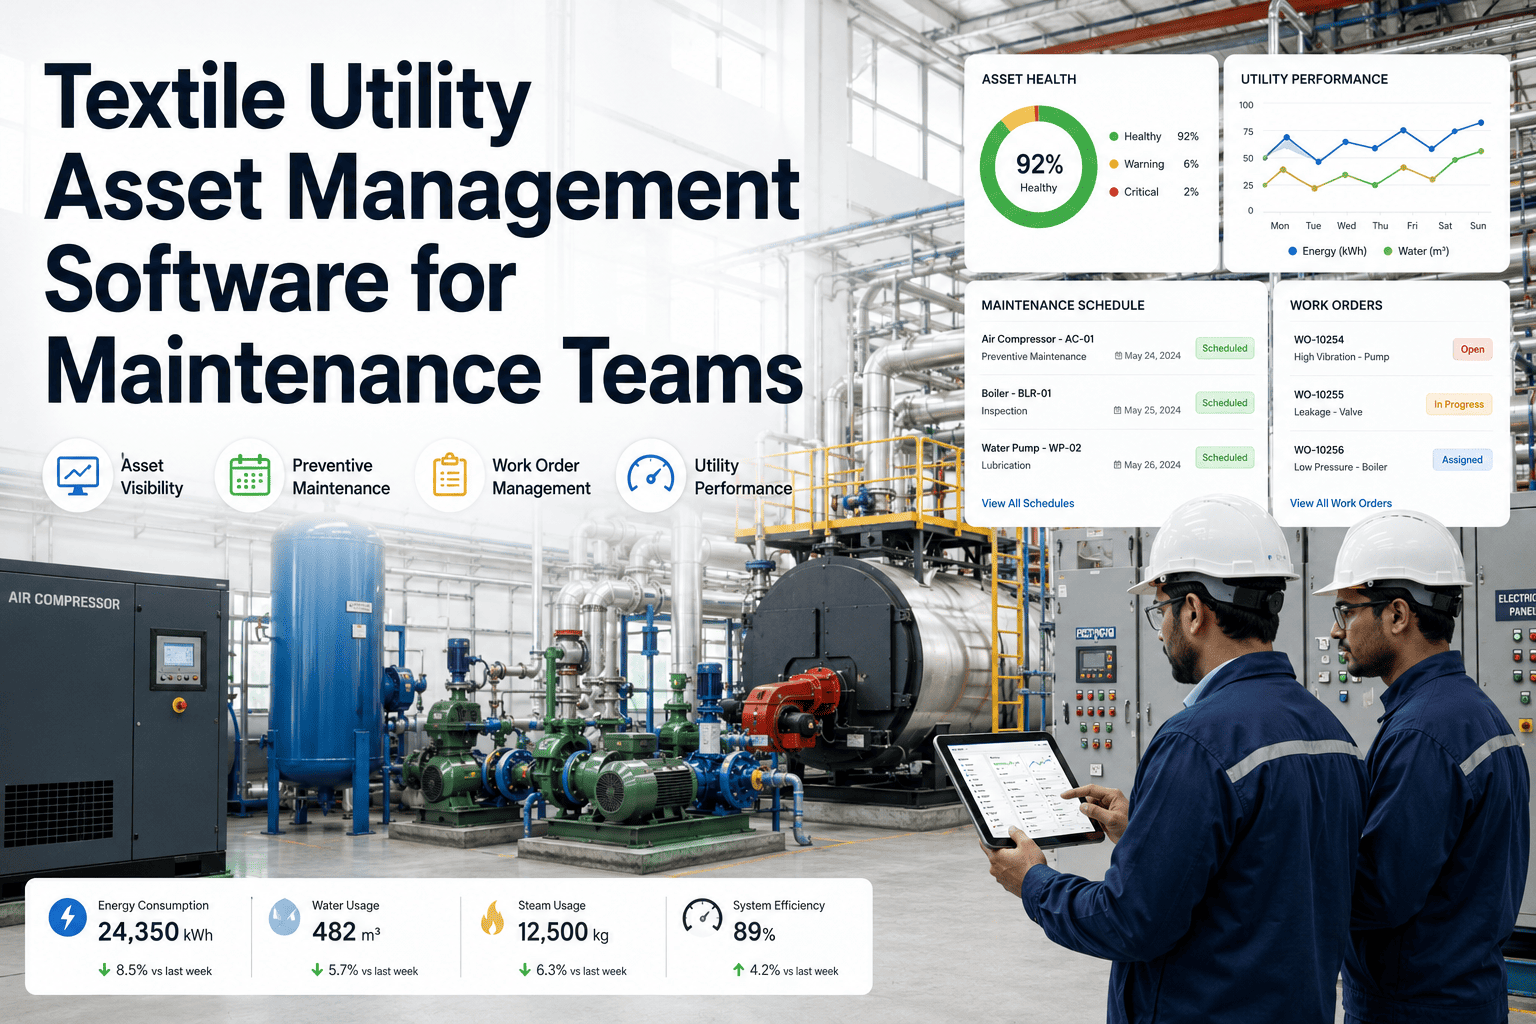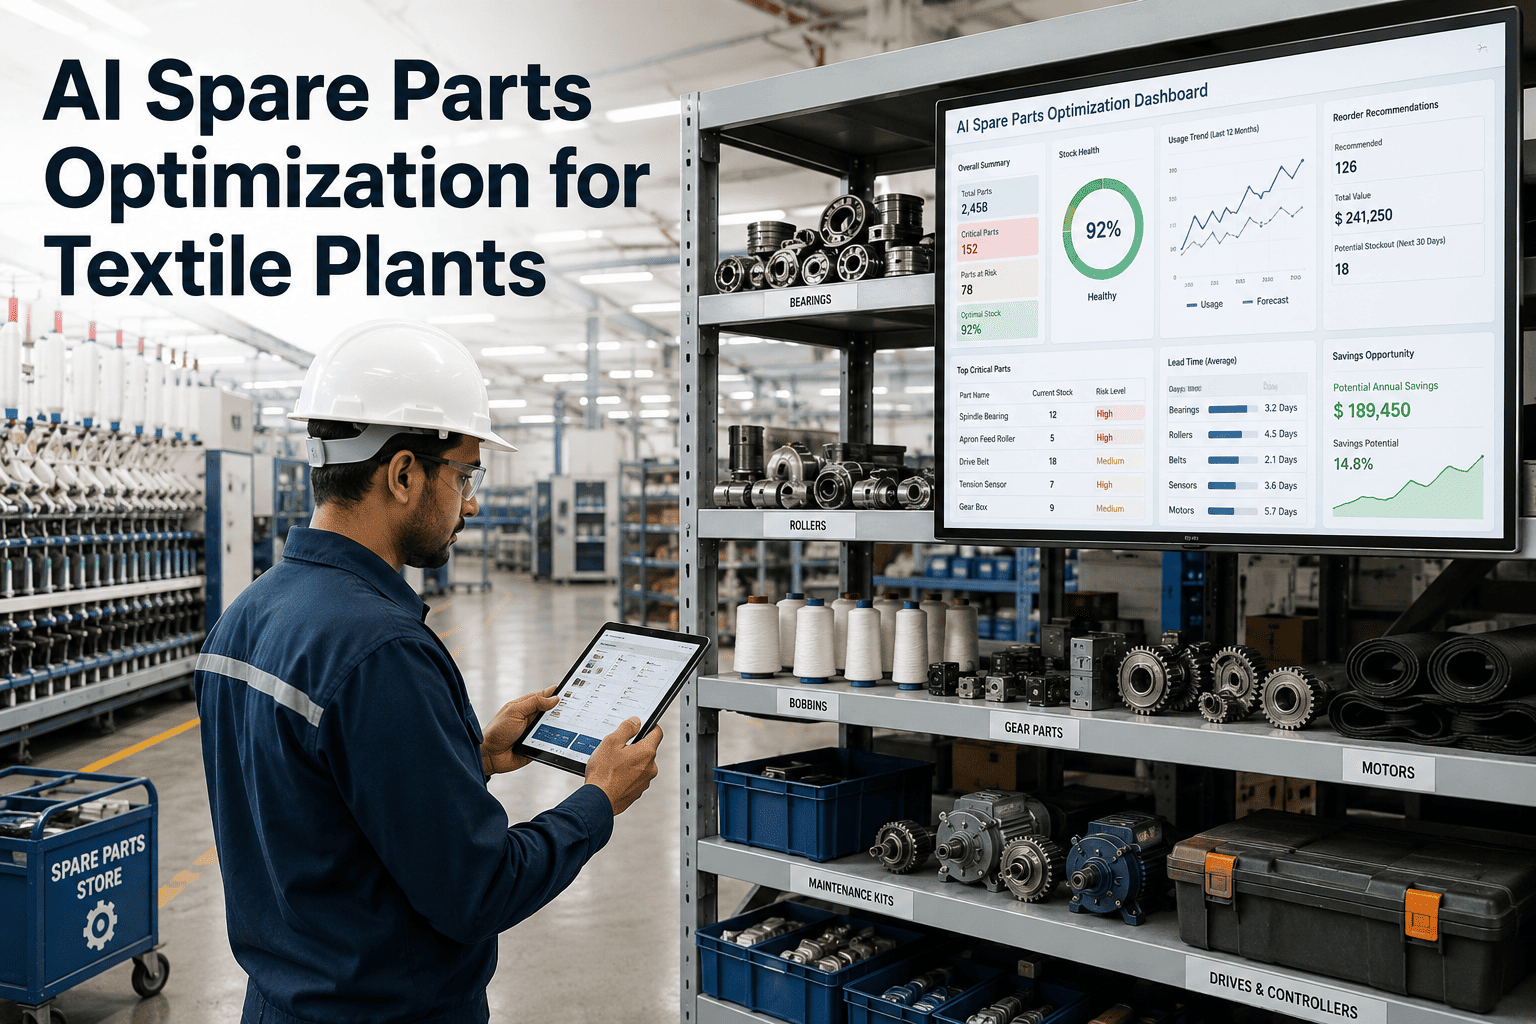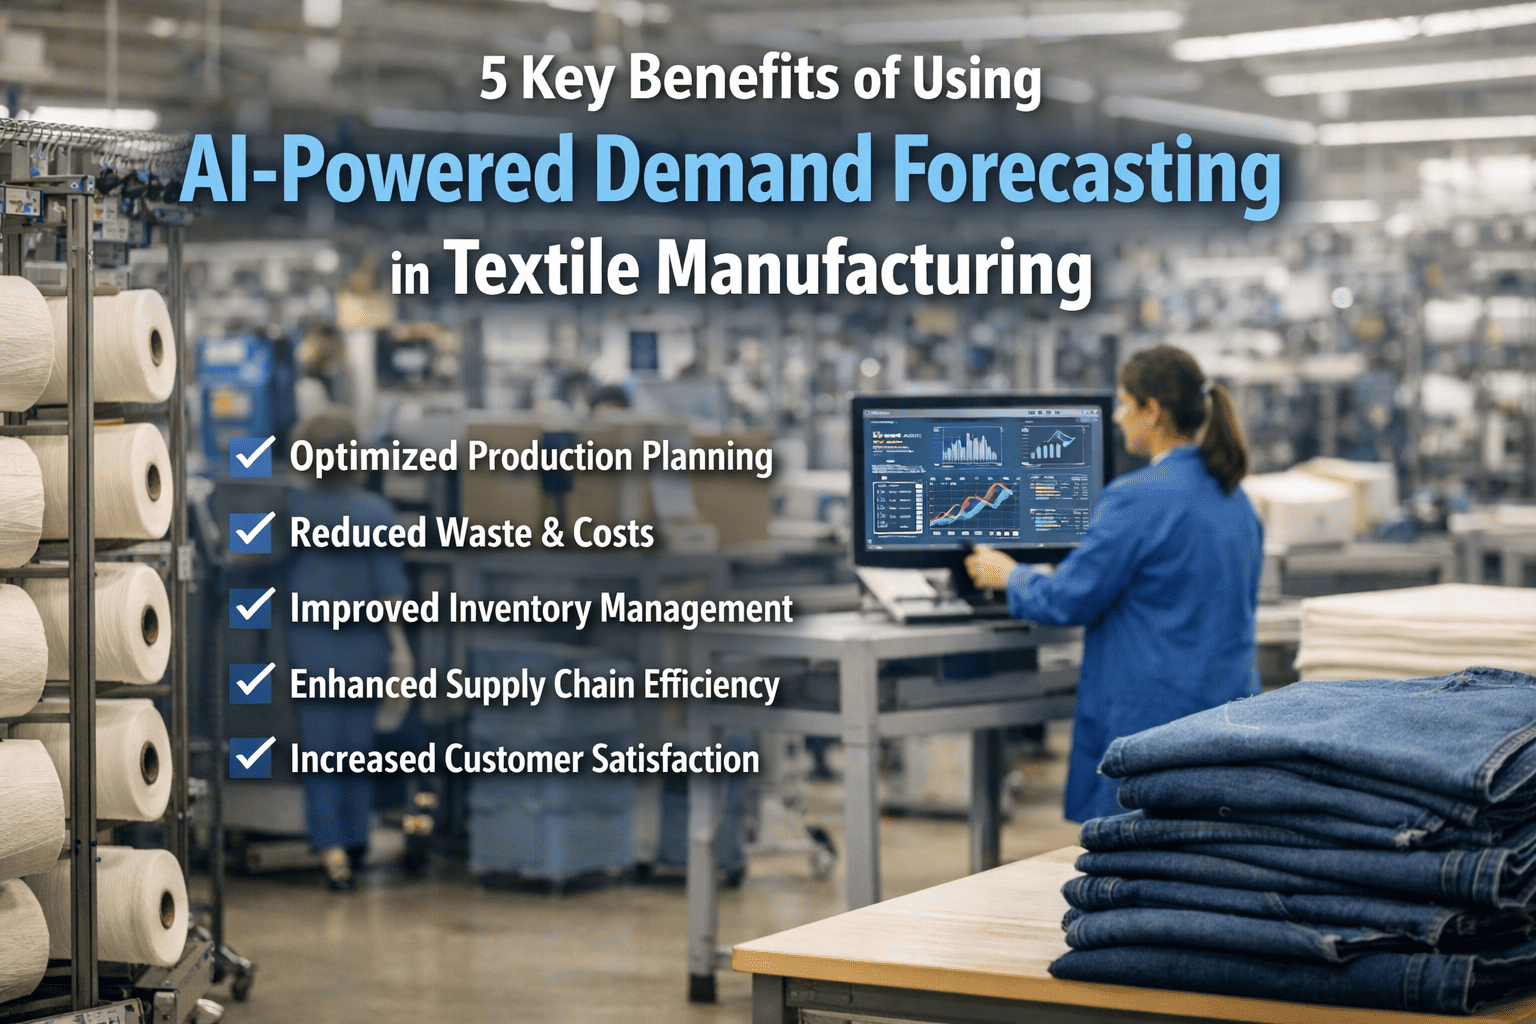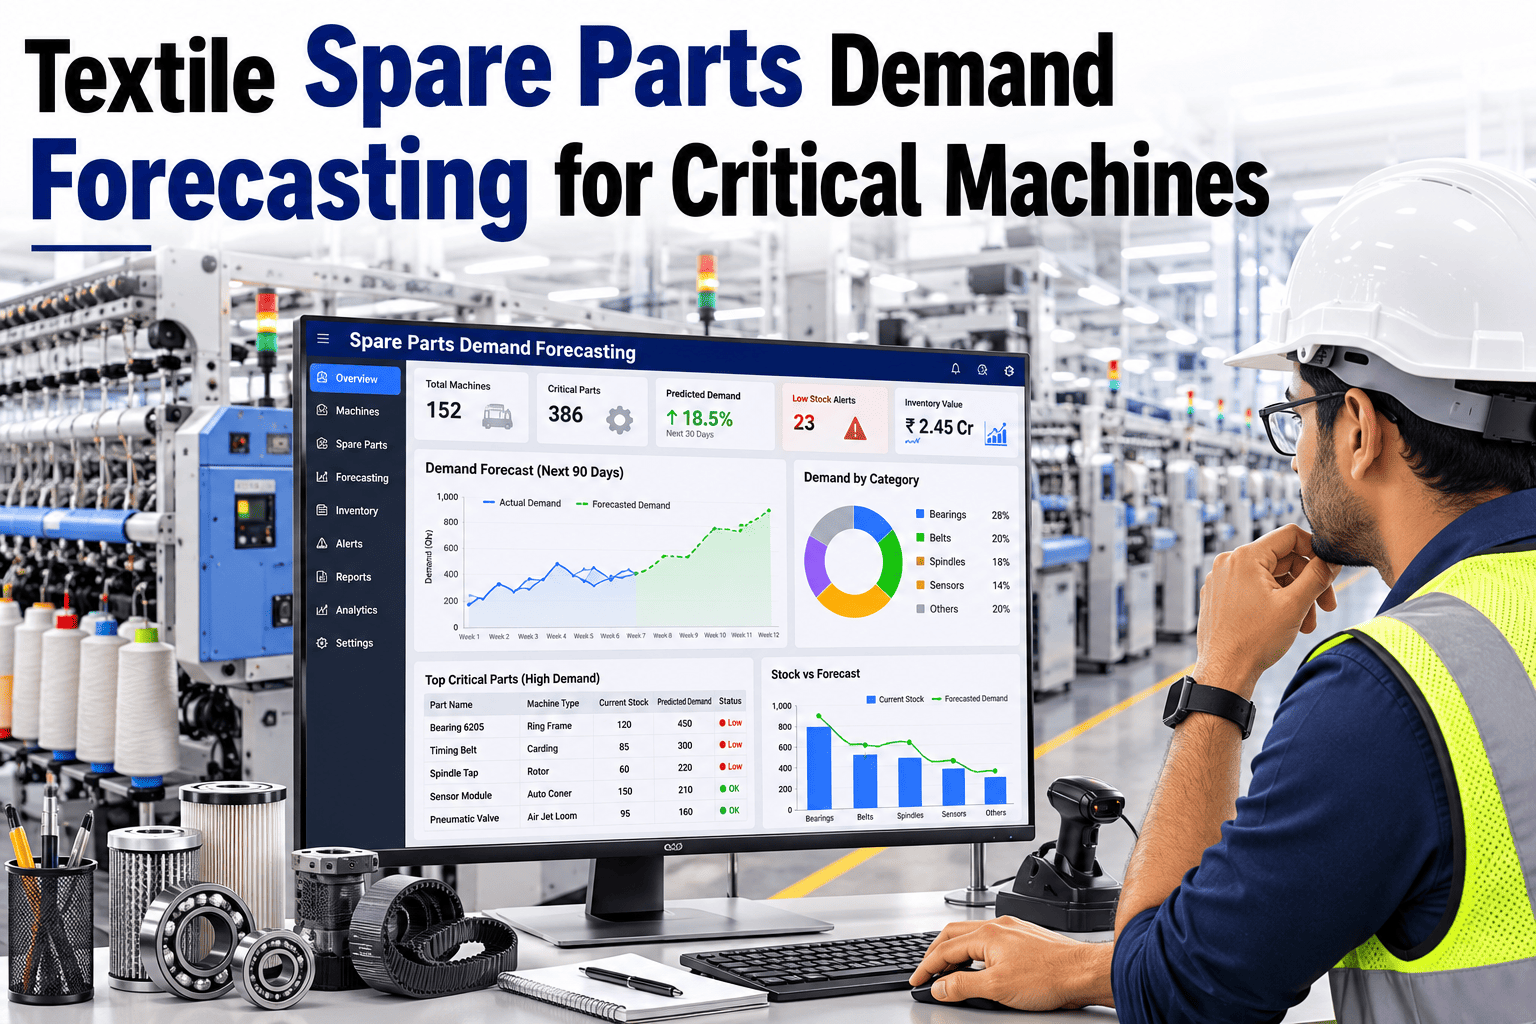
A ring frame that goes down for a missing traveller or a loom stopped for want of a heald frame does not just lose that machine's output — it cascades into missed delivery dates, idle operators and overtime that eats the margin on the whole order. Most textile mills still run spares inventory on gut feel and reorder points set years ago, which means storerooms are simultaneously overstocked with slow-moving parts and dangerously short on the bearings, needles and sensors that actually fail. AI-driven spare parts demand forecasting fixes both problems at once by tying inventory levels to real consumption history, failure patterns and the production plan itself, rather than a static minimum-maximum shelf rule. If your maintenance team is still walking to the storeroom to discover a stockout mid-repair, Book a Demo to see how iFactory keeps critical spares exactly where breakdown risk says they need to be.
Stop Guessing What Your Storeroom Needs Next Week
iFactory forecasts demand for bearings, travellers, needles, belts and sensors using consumption trends, machine failure history and your actual production schedule — so critical spares are on the shelf before the breakdown, not after it.
The Real Cost of Reactive Spares Management
Traditional spares management in textile mills relies on fixed reorder points, set once and rarely revisited even as machine age, production mix and shift patterns change. A traveller consumption rate calculated three years ago on different yarn counts is now guiding today's purchase orders, which is exactly why storerooms end up holding six months of a part nobody uses anymore while running out of the one item every ring frame needs weekly.
The downstream cost is bigger than the part itself. Every hour a critical machine sits waiting for a spare is an hour of lost production, and in a mill running on tight delivery schedules that hour compounds into missed shipments and expedited freight charges to recover. Maintenance teams end up spending as much time chasing parts as they spend actually repairing machines.
What the Forecasting Model Actually Uses
| Data Source | What It Reveals | Forecast Impact |
|---|---|---|
| Historical Consumption | Actual withdrawal rate per part, per machine type, per shift pattern | Sets the statistical baseline demand curve |
| Failure History | Which components fail together and how often on aging equipment | Flags rising failure risk before it shows in consumption |
| Production Plan | Upcoming style changes, speed increases and machine utilization | Adjusts demand ahead of planned load changes |
| Supplier Lead Time | Actual delivery performance per vendor and part category | Sets reorder timing with real buffer, not a guess |
| Criticality Rating | Which parts stop a machine entirely versus degrade output slowly | Prioritizes safety stock where downtime risk is highest |
This is what separates forecasting from a simple reorder alarm — the model is not just watching a shelf count drop, it is reasoning about why the part is being consumed and whether that rate is about to change. For mills running mixed fleets of ring frames, rotor spinning, looms and knitting machines, this matters enormously, because each machine family has its own wear pattern and criticality profile. Maintenance leaders can Book a Demo to see the model built against their own equipment list.
From Prediction to Purchase Order
Consumption Pattern Detected
The model continuously tracks withdrawal rate against a rolling baseline for every SKU across every machine class in the mill.
Risk Score Calculated
Failure history and machine age are combined with current stock level to produce a stockout risk score for each critical part.
Reorder Recommended
When risk crosses threshold, a purchase requisition is generated automatically with quantity sized to actual lead time and demand curve.
Outcome Tracked
Actual consumption after delivery feeds back into the model, sharpening every future forecast for that part and machine combination.
Find Out What's Sitting Idle in Your Storeroom Right Now
Most mills discover 20–30% of inventory value is tied up in parts with no forecasted demand for the next two quarters.
Critical Spares by Department
Ring & Rotor Spinning
Travellers, spindles, aprons and bearings consumed continuously — small parts with outsized downtime impact when unavailable.
Weaving
Heald frames, reeds, shuttles and picking mechanisms where a single stocked-out part can idle an entire loom shed section.
Knitting
Needles, sinkers and cam parts with fast wear cycles that demand tight, accurate forecasting to avoid frequent micro-stockouts.
Utilities & Sensors
Electrical components, drive belts and sensors supporting HVAC, compressors and automation across the entire plant.
Why This Beats a Traditional Min-Max System
A min-max reorder point is a snapshot decision frozen at the moment it was set — it cannot see a machine aging into a higher failure rate, a production mix shift changing wear patterns, or a supplier's lead time quietly stretching from two weeks to five. AI-driven forecasting treats inventory as a living system that updates itself against what is actually happening on the floor, which is the only way to simultaneously cut both stockouts and excess stock. Mills that have run both approaches side by side consistently report that forecasting-based inventory carries less total value while causing fewer production stoppages — the two outcomes a static system can never deliver together.
Frequently Asked Questions
How accurate is AI demand forecasting compared to manual reorder points?
Forecasting accuracy depends on how much consumption history is available, but most mills see meaningfully tighter predictions within the first two to three months as the model learns machine-specific wear patterns. Unlike a fixed reorder point, the forecast continuously updates itself against actual outcomes, so accuracy improves every cycle rather than staying static until someone manually revisits it. You can review sample accuracy reports by contacting Support.
Do we need to digitize our entire spares catalog before starting?
No — the system can begin forecasting with your existing consumption records, even if they come from spreadsheets or a legacy inventory system, and prioritize critical, high-turnover parts first. Full catalog digitization improves coverage over time but is not a prerequisite to seeing initial forecasting value on your most important spares.
Can this handle multiple machine brands and ages in the same mill?
Yes — the model builds a separate consumption and failure profile for each machine class, so a fifteen-year-old ring frame and a newly installed one are never forecast against the same assumptions. This is particularly important in mixed-fleet mills where wear patterns vary significantly by machine age, brand and maintenance history.
How does forecasting integrate with our purchasing process?
Once a reorder recommendation crosses the risk threshold, a requisition is generated with quantity and timing already calculated against actual supplier lead time, which your purchasing team can approve directly rather than recalculating manually. This removes the guesswork from purchase quantity while keeping final approval in human hands.
What happens when a new machine or part is introduced?
New machines and parts start on a conservative baseline forecast informed by similar equipment already in the system, and the model sharpens quickly as real consumption data accumulates. Teams evaluating a fleet expansion can Book a Demo to see how onboarding works for new equipment categories.
Put Every Critical Spare on a Forecast, Not a Guess
iFactory's AI Inventory Forecasting turns your spares storeroom from a reactive cost center into a predictive extension of your maintenance program — tied directly to the machines, shifts and production plans that actually drive consumption. The result is fewer emergency purchases, less idle capital sitting on shelves, and critical machines that stay running because the part was already there.
Bring Your Spares List — We'll Show You the Gaps
A short working session against your current inventory data reveals exactly where stockout risk and overstock are both hiding today.