A quality control plan defines what gets inspected, at what frequency, using which method, against what specification, and what action to take when things go wrong. Yet many QC plans sit in binders rarely referenced by operators. This template provides a structured QC plan with a scoreboard, a 12-point control table, component cards, a five-step workflow, a visual process flow, an SPC chart reference, and FAQ.
Assess Your QC Plan Readiness in Under an Hour
Is Your QC Plan Actually Controlling Quality? Evaluate Coverage, Compliance, and Effectiveness with a Structured Framework.
iFactory’s QC plan assessment tool walks you through a structured evaluation of your existing quality control documentation, sampling strategies, measurement methods, and reaction plan maturity. You will receive a gap analysis report showing which control points are adequately defined, which are missing critical elements like specification limits or reaction plans, and how your current QC plan aligns with AIAG control plan guidelines. The assessment takes approximately 45 minutes for a single production line and generates a prioritised improvement roadmap. Book a demo to see how the assessment works in practice and receive a complimentary QC plan maturity benchmark for your plant.
QC Plan Health Scoreboard
The scoreboard provides an at-a-glance summary of your QC plan’s scope and effectiveness. It tracks the total number of documented control points across all process steps, the number of defined sampling plans with sample sizes and frequencies, the count of documented reaction plans for out-of-spec and out-of-control conditions, and the year-over-year trend in non-conformance rate as a lagging indicator of QC plan effectiveness. These four metrics help quality leadership quickly assess whether the QC plan is complete, actionable, and driving measurable quality improvement across the plant.
Comprehensive Quality Control Plan: Incoming to Final Inspection
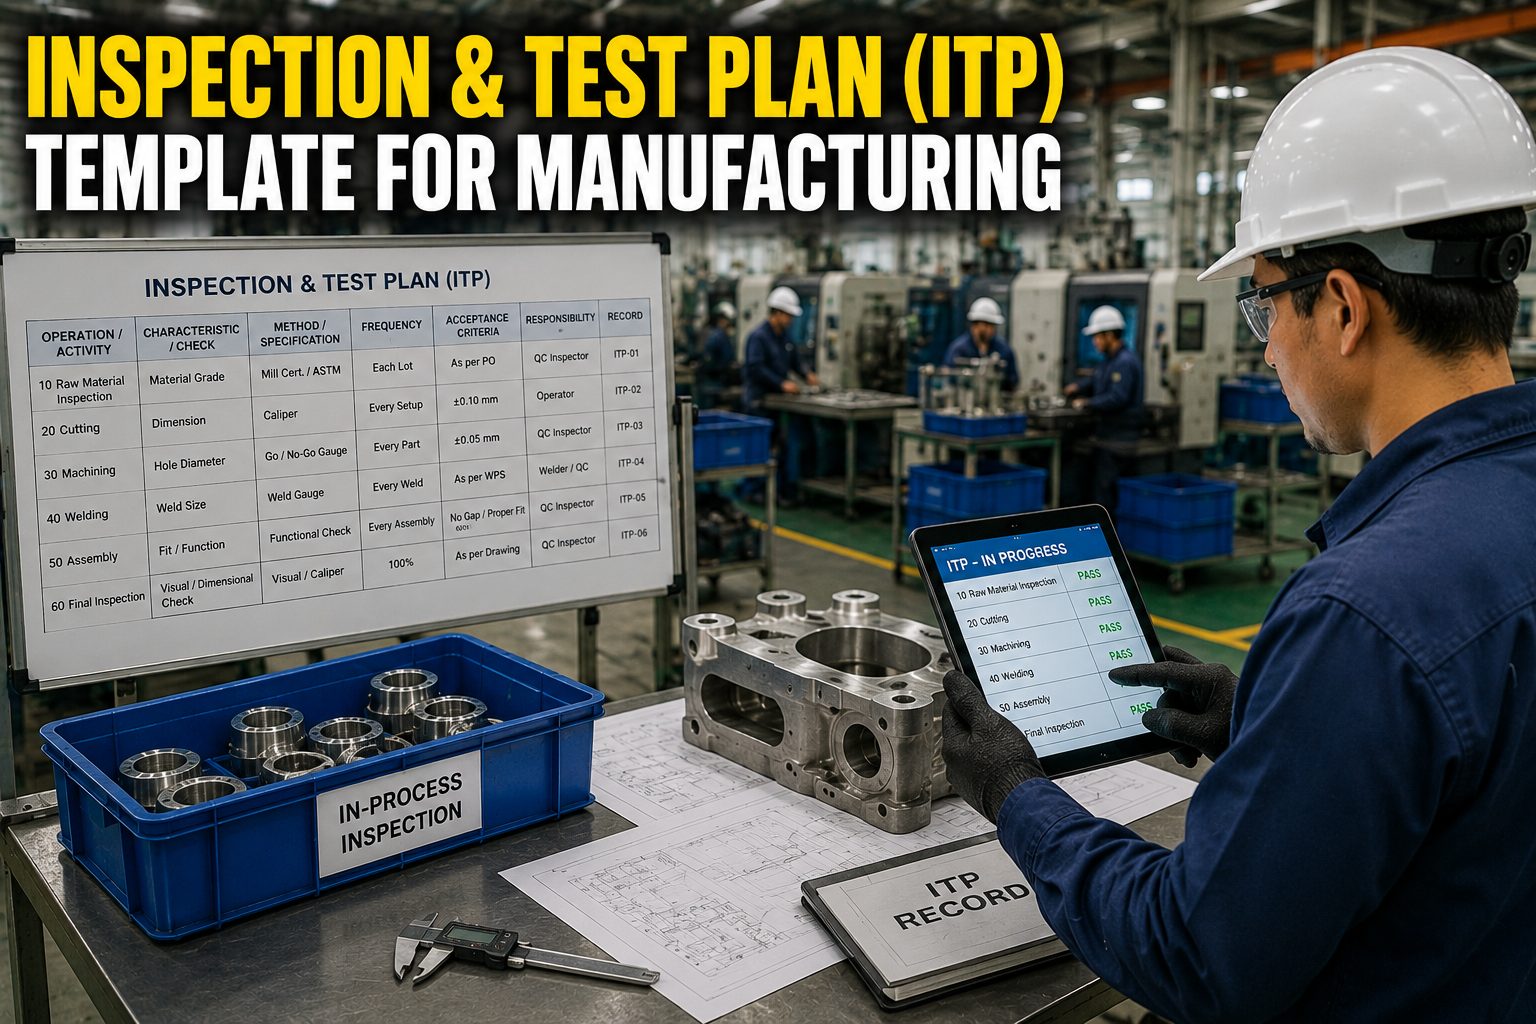
The QC plan table is the core of the template — a detailed, row-by-row specification of every control point across the manufacturing process. Each row documents the process step, control item with a description of what is being measured, the specification or tolerance from the engineering drawing or customer requirement, the measurement method and equipment used, the sampling frequency and sample size, the control limit for SPC-monitored characteristics, the reaction plan triggered when limits are exceeded, and the responsible person or role. The twelve rows cover the complete product journey from receiving inspection through in-process machining, assembly, welding, and final inspection to packaging and shipping release.
| Process Step | Control Item | Specification | Method | Frequency | Sample Size | Control Limit | Reaction Plan | Responsible |
|---|---|---|---|---|---|---|---|---|
| Receiving Inspection | Raw material certificate | Per AS9102 / supplier spec | Certificate review | Every lot | 1 per lot | 100% cert match | Quarantine lot; contact supplier QA | Receiving Inspector |
| Receiving Inspection | Dimension verification | ±0.01 mm per drawing | CMM / micrometer | First 5 pcs per lot | n=5 | All within spec | 100% sort; notify supplier | Quality Technician |
| Incoming Material | Hardness test | HRC 40–48 per spec | Rockwell tester | Every 10th part | n=3 | HRC 42–46 | Hold batch; re-certify | Lab Technician |
| Incoming Material | Surface finish | Ra ≤ 1.6 µm | Profilometer | 1 per 50 pcs | n=1 | Ra ≤ 1.6 µm | Re-work surface; 100% inspect | Quality Inspector |
| In-Process: Machining | Critical dimension A | ±0.05 mm | Go/No-Go gauge | Every 10 pcs | n=3 per hr | X̄ ± 0.03 mm | Stop machine; notify supervisor | Operator |
| In-Process: Machining | Tool wear offset | ±0.02 mm | CNC probe | Every 5 pcs | n=2 | Offset < 0.01 mm | Replace insert; re-certify offset | Setup Technician |
| In-Process: Assembly | Torque verification | 12–15 Nm per spec | Torque wrench | Every 20th unit | n=5 | 13–14 Nm | Re-torque batch; check tooling | Assembly Lead |
| In-Process: Assembly | Leak test | < 5 cc/min at 2 bar | Pressure decay tester | 100% inline | 1 per unit | Leak rate < 3 cc/min | Reject unit; root-cause analysis | Quality Engineer |
| In-Process: Welding | Weld penetration | 3–5 mm per WPS | Ultrasonic test | 1 per 50 welds | n=3 | 3.5–4.5 mm | Re-weld; NDT re-inspect | Welding Inspector |
| Final Inspection | Functional test | Full cycle pass | Test fixture | 100% | 1 per unit | All parameters pass | Hold unit; engineering review | Final Inspector |
| Final Inspection | Dimensional CMM report | Per drawing GD&T | CMM program | 1 per 100 units | n=1 | All features within tolerance | Unlock 100% CMM on batch | Quality Engineer |
| Final Inspection | Packaging verification | Per customer packaging spec | Visual + checklist | Every pallet | 1 per pallet | All checklist items pass | Re-pack; notify shipping supervisor | Shipping Lead |
Six Essential Components of a Quality Control Plan
Each column of the QC plan represents a critical component that must be carefully defined. The six component cards below explain what each column means, why it matters, and provide a concrete example of how it should be populated. Understanding these components is the foundation for building a QC plan that is complete, actionable, and compliant with automotive, aerospace, and medical device quality standards.
Transform Your Paper QC Plan into a Digital Quality Framework
Stop Searching for the Right Specification or Reaction Plan. Give Operators Instant Access to the Exact Control Information They Need.
iFactory’s digital QC plan module replaces paper binders and disconnected Excel files with a live, role-based quality management interface. Operators see only the control items relevant to their station, with specifications displayed on-screen, measurement entry via touchscreen or connected gauge, real-time SPC charting with automatic out-of-control alarms, and one-click reaction plan execution that routes the alert to the correct responder. Quality engineers build and update QC plans through a drag-and-drop interface linked to PFMEA risk assessments. Deploy a digital QC plan at a single work centre in days, not months, and scale across your entire plant within weeks.
Five-Step Workflow: Building a QC Plan from Scratch
Building a quality control plan does not need to be overwhelming. Follow this five-step workflow to move from process mapping to a fully deployed QC plan with trained operators. Each step has a clear owner, defined output, and specific activities that build on the previous step. The workflow aligns with the AIAG control plan methodology and integrates with APQP phase-gate reviews for new product launches.
QC Plan Process Flow: Control Point Placement Across the Production Journey
The process flow diagram below visualises where control points are placed across the three major quality stages: incoming material inspection, in-process manufacturing controls, and final product verification. Each stage has defined control points with sampling plans, measurement methods, specification limits, and reaction plans. The diagram shows how quality gates at each stage work together to detect and contain non-conformance as early as possible, minimising the cost of quality by catching defects before value-added processing occurs.
SPC Control Chart Types: Selecting the Right Chart for Each Control Item
Selecting the correct control chart type is critical for effective statistical process control. The four most commonly used charts in manufacturing QC plans are X̄-bar & R for variable subgroup data, p-chart for proportion defective, c-chart for defect counts per constant unit, and u-chart for defect rates when unit size varies. Each card below shows a miniature SVG example of the chart, describes when to use it, and provides the control limit formula for calculating upper and lower control limits.
UCL = X̄̄ + A₂R̄; LCL = X̄̄ – A₂R̄UCL = p̄ + 3√(p̄(1–p̄)/n); LCL = p̄ – 3√(p̄(1–p̄)/n)UCL = c̄ + 3√c̄; LCL = c̄ – 3√c̄UCL = ū + 3√(ū/n); LCL = ū – 3√(ū/n)Frequently Asked Questions
What is a quality control plan and how is it different from a control plan?
A quality control plan (QC plan) is a detailed document that specifies the quality activities, inspection points, measurement methods, sampling frequencies, acceptance criteria, and reaction plans for each step of the manufacturing process. It is sometimes used interchangeably with “control plan” in the context of APQP (Advanced Product Quality Planning), but a QC plan typically has a broader scope that includes inspection and testing activities beyond statistical process control. The QC plan serves as the operational document that the quality team, production operators, and inspectors follow to ensure every product meets customer and regulatory requirements. It answers the practical questions: What do we inspect? How often? With what tool? What is the pass/fail criteria? What do we do when it fails? A control plan, under AIAG guidelines, is more narrowly focused on process control and SPC implementation, while a QC plan encompasses the full quality assurance framework including incoming inspection, in-process checks, final testing, and documentation requirements.
How do I determine control limits and specification limits for my QC plan?
Specification limits are the engineering tolerance boundaries that define whether a product meets customer requirements. These come from the product design, engineering drawings, customer purchase order, or regulatory standards and are non-negotiable from the customer’s perspective. Control limits, on the other hand, are statistically calculated from process data — they represent the expected range of variation when the process is operating in a state of statistical control. Control limits are calculated using the formulas for the specific chart type: for X̄-bar charts, UCL/LCL = X̄̄ ± A₂R̄; for R charts, UCL = D₄R̄ and LCL = D₃R̄. The key relationship between the two is that control limits must fall within specification limits for the process to be capable. If control limits exceed specification limits, the process is not capable of producing conforming product consistently, and the process must be improved or the specifications reviewed with the customer. A minimum process capability of Cpk ≥ 1.33 is typically required before control limits can be used effectively in production.
What is a reaction plan and when should it be triggered?
A reaction plan is a predetermined set of corrective actions executed when a measurement or inspection result falls outside the defined specification limits or control limits. The reaction plan specifies exactly who does what, in what sequence, and by when to contain the non-conformance, prevent further defect generation, determine root cause, and implement corrective action. Reaction plans should be triggered immediately when any of the following conditions occur: a measurement exceeds specification limits (outside tolerance), a control chart shows a point beyond the control limits (out of control), seven consecutive points on one side of the centreline (Western Electric Rule 1), a trend of six or more points in one direction, a non-random pattern on the control chart, or a failed gauge repeatability and reproducibility (GR&R) study. The simplest reaction plan follows the pattern: Stop production, segregate suspect material from the last good point, mark the non-conforming material with a red tag, notify the supervisor and quality engineer, initiate root-cause analysis using 5-Why or fishbone diagram, implement containment and corrective action, verify effectiveness, and document the entire event in the quality system.
How does a QC plan integrate with APQP, PPAP, and PFMEA?
The QC plan is a core deliverable of the APQP (Advanced Product Quality Planning) process and a required submission element of PPAP (Production Part Approval Process). When a new product is developed through APQP, the PFMEA (Process Failure Mode and Effects Analysis) identifies the high-risk process steps and failure modes. Each high-risk failure mode with a high RPN (Risk Priority Number) generates a control method that is documented in the QC plan. The QC plan, in turn, defines the specific inspection and monitoring activities that ensure the failure modes are detected or prevented. During PPAP submission, the QC plan is submitted as part of the 18-element PPAP package to demonstrate that the production process has defined quality controls at every step. After PPAP approval, the QC plan becomes the living document that guides day-to-day quality operations. Any engineering change, process change, or customer complaint that results in a PFMEA update must trigger a corresponding update to the QC plan, ensuring the quality controls always reflect the current risk profile. iFactory’s QC plan module links directly to PFMEA and APQP records, automatically updating control items when risk assessments change.
Should I use paper-based or software-based QC plans?
Paper-based QC plans are still common in many plants because they are simple to create using Excel or Word templates, require no software investment, and can be posted on the shop floor as printed documents. However, paper-based QC plans have significant limitations: they are difficult to keep updated when specifications change, version control is manual and error-prone, operators must manually record all inspection data and then transcribe it into digital systems, reaction plans are often ignored or applied inconsistently because operators cannot easily locate the correct procedure, and management has no real-time visibility into whether QC plan activities are being executed as designed. Software-based QC plans, such as those provided by iFactory’s quality management module, solve these problems by digitising the entire QC plan lifecycle: control items are linked to digital work instructions that display at the operator workstation, measurement data is captured electronically through connected gauges or touchscreen entry, SPC charts are calculated and updated in real time with automatic out-of-control alarms, reaction plans are triggered automatically and routed to the correct responder with escalation if not acknowledged, and management dashboards show QC plan compliance, control point coverage, and non-conformance trends in real time. Most plants achieve a positive ROI within 3–6 months of transitioning from paper to digital QC plans due to reduced defect rates, faster reaction times, and elimination of data transcription errors.
Deploy a Standardised QC Plan Framework Across Your Plant
Consistent Quality Control Across Every Line, Shift, and Operator. Build Once, Deploy Everywhere with iFactory.
iFactory’s quality management platform enables you to create a single master QC plan and deploy it consistently across multiple production lines, shifts, and plants with automatic version control and audit trail. Control items link directly to digital work instructions at each station, measurement data flows into real-time SPC charts, reaction plans trigger automatic escalation workflows, and compliance dashboards show QC plan execution rates by line and shift. Every measurement, reaction, and corrective action is time-stamped and operator-signed for full traceability. Typical deployment for a single production line takes two weeks, including QC plan configuration, device setup, operator training, and go-live support. Book a demo to see the platform in action on your own QC plan data.