Infrared thermography is one of the most versatile non-destructive testing technologies in industrial predictive maintenance, yet its impact has historically been limited by a fundamental coverage gap. A thermography contractor walking a typical plant once per quarter with a handheld IR camera captures roughly two hours of thermal data out of approximately 2,190 operating hours — a coverage rate of 0.09%. Industry surveys consistently show that periodic infrared surveys catch only 10–15% of developing thermal faults; the remaining 85–90% initiate and progress to failure between inspection intervals. Every electrical fault, mechanical friction point, and insulation degradation produces a heat signature before it causes failure — a loose electrical connection rises 10–50°C above ambient weeks before arc flash, a bearing running hot degrades 2–5°C per month before seizure, a motor winding developing a turn-to-turn fault heats unevenly for days before winding burnout. AI-enhanced thermal imaging eliminates the coverage gap by replacing periodic handheld surveys with continuous thermal monitoring, applying computer vision and machine learning algorithms to every frame of infrared video, detecting thermal anomalies against learned baselines, classifying fault type and severity, and generating maintenance work orders automatically — all without requiring a certified thermographer to review every image. iFactory AI's industrial platform, including its Shift Logbook and predictive maintenance engine, enables reliability teams to deploy AI-driven infrared thermography for continuous thermal monitoring without replacing existing CMMS or inspection programs. Book a Demo to see how iFactory applies AI thermal imaging across your electrical and mechanical equipment fleet.
Why Periodic Handheld IR Surveys Are Missing 85–90% of Developing Thermal Faults
The standard industrial thermography program — a certified ASNT Level II or III thermographer walking the plant quarterly with a handheld IR camera, capturing thermal images of critical electrical panels, motor terminals, bearing housings, and steam system components — has been the condition monitoring standard for electrical and mechanical equipment for over two decades. The physics is sound: every electrical connection with rising resistance generates detectable heat before failure; every bearing with degrading lubrication produces a measurable temperature differential before seizure. The limitation is not the technology — it is the sampling density. A quarterly handheld survey covers approximately 0.09% of the asset's operating hours. Thermal faults that develop and escalate over 30–90 days — the typical progression window for electrical hot spots and mechanical friction degradation — are invisible to a snapshot taken once per quarter. The four structural limitations of periodic IR surveys are well documented in ASNT and EPRI thermography program guidelines.
What AI-Enhanced Thermal Imaging Detects — and How It Classifies Each Fault Type
Every industrial fault that produces heat produces a distinct thermal signature — a pattern, rate of change, and spatial distribution that differentiates a loose electrical connection from a bearing running dry, from a motor winding developing a turn-to-turn short. AI models trained on thousands of labeled thermal images learn to recognize these patterns with higher accuracy and consistency than manual interpretation alone. The table below documents the five primary fault categories detectable through AI-enhanced thermal imaging, their thermal signatures, detection lead times, and typical cost avoidance per event.
| Fault Category | Thermal Signature | AI Detection Method | Lead Time | Avg. Cost Avoidance |
|---|---|---|---|---|
| Electrical Connection Hot Spots | Localized temperature rise 10–50°C above ambient at bus bars, breaker terminals, cable lugs, and switchgear connections | CNN-based image segmentation identifies connector regions; delta-T against learned healthy baseline per component | 30–90 days | $15K–$80K per event |
| Motor Winding & Stator Overheating | Uneven heating across motor frame surface; phase-to-phase temperature imbalance exceeding 5°C under balanced load | LSTM model tracks per-phase temperature trends; flags imbalance before winding insulation degradation accelerates | 14–45 days | $8K–$35K per motor |
| Bearing & Mechanical Friction | Progressive temperature rise at bearing housing — 2–5°C per month above baseline; localized hotspot at bearing cap | Thermal trend analysis vs baseline; rate-of-change exceeding 1°C/week triggers inspection work order | 21–60 days | $5K–$25K per bearing |
| Insulation & Refractory Breakdown | Hot surface area expansion on furnace walls, steam lines, kiln shells; temperature gradient change indicating lining erosion | Semantic segmentation of insulation boundaries; temperature gradient mapping against design thermal profile | 60–180 days | $20K–$100K per event |
| Steam Trap & Fluid System Leakage | Temperature differential upstream vs downstream of trap; pipe surface temperature indicating blow-through or blockage | Thermal line profiling along pipe runs; pattern classification for normal operation vs failed-open vs failed-closed | 14–60 days | $3K–$15K per trap |
How iFactory Transforms Raw Thermal Video Into Classified Faults and Work Orders
iFactory's AI-enhanced thermal imaging platform processes continuous infrared video feeds through a six-stage pipeline that transforms raw radiometric data into classified faults with actionable maintenance recommendations. The platform integrates with existing fixed-mount thermal cameras, drone-mounted IR sensors, and handheld survey uploads — working with FLIR, Hikvision, Fluke, Testo, and other major IR camera manufacturers through standard file formats and RTSP video streams. Every thermal frame is logged, analyzed, and stored with full traceability for audit, trend analysis, and continuous model improvement.
iFactory's Shift Logbook captures operator shift notes, thermal inspection findings, and maintenance actions alongside the AI-generated thermal alerts, creating a unified thermal history per asset. Reliability engineers can review trend graphs of each component's temperature over time — detecting the gradual 1–2°C-per-week rise that signals developing friction or resistance long before it reaches critical threshold. Book a Demo to see iFactory's thermal imaging analytics applied to your facility's critical assets.
The ROI of AI-Enhanced Thermal Imaging for Electrical and Mechanical Reliability
The business case for continuous AI thermal monitoring is straightforward: a single prevented electrical arc flash incident or motor winding failure recovers the full platform investment. Facilities deploying continuous AI thermal monitoring alongside existing periodic IR survey programs report measurable improvements across four key metrics within the first quarter of operation.
Application Coverage: Which Assets Benefit Most From Continuous AI Thermal Monitoring
Not all equipment benefits equally from continuous thermal monitoring. The highest ROI assets share three characteristics: a known thermal failure mode that produces detectable heat 30–90 days before failure, a consequence of failure that justifies the monitoring investment, and a physical configuration that allows fixed-mount IR camera installation. iFactory's thermal imaging practice has developed coverage templates for the five highest-value asset classes based on field deployment data across manufacturing, power generation, chemical processing, and food production facilities.
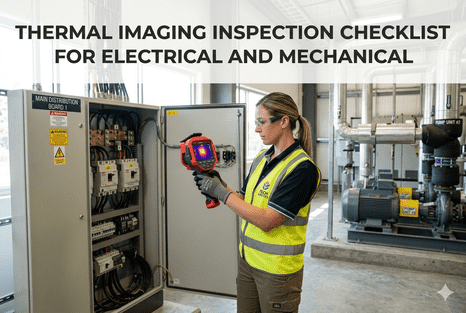
- Main switchgear, MCCs, panel boards, and busway connections — loose connections, corroded contacts, and overloaded circuits produce detectable heat 30–90 days before failure
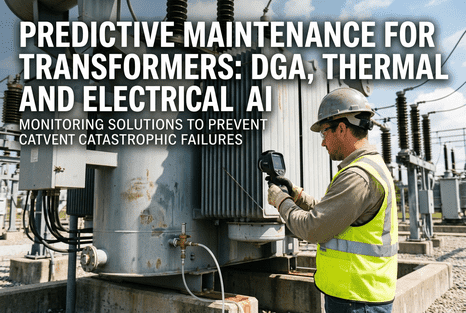
- Transformer bushings, tap changers, and cooling systems — oil degradation and bushing contamination produce thermal gradients detectable 60+ days before catastrophic failure
- Motor control centers and VFD cabinets — power component degradation visible as localized hotspots 14–45 days before component failure
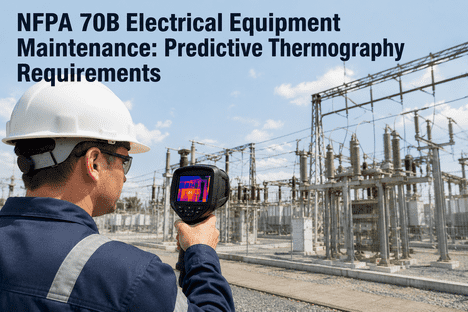
- NFPA 70B criticality: infrared surveys are the primary recommended inspection method for electrical distribution equipment
- Motor stator and winding temperatures — phase-to-phase imbalance under balanced load indicates developing turn-to-turn short 14–45 days before winding burnout
- Bearing housing temperatures — progressive rise of 2–5°C per month indicates lubrication degradation or incipient spalling; continuous trending catches the trend monthly surveys miss
- Coupling and shaft alignment — misalignment produces asymmetric heating pattern detectable through thermal imaging of shaft and coupling surfaces
- Pump casing and seal temperatures — mechanical seal degradation and cavitation produce localized heating at seal housing 21–60 days before seal failure
- Refractory lining integrity — hot spot on furnace or kiln shell indicates lining erosion or gap; continuous monitoring tracks hot spot growth rate for planned outage scheduling 60–180 days in advance
- Steam system — trap failure detection through upstream vs downstream temperature differential; insulation breakdown detection through surface temperature mapping
- Heat exchanger — tube fouling and blockage produce surface temperature anomalies; thermal camera coverage enables condition-based cleaning scheduling rather than calendar-based
- Dryer and oven roller bearings — high-temperature environment makes contact sensors impractical; non-contact thermal imaging is the only viable continuous monitoring method
- Conveyor drive and idler bearings — bearing overheating from misalignment, lubrication loss, or belt tension; thermal monitoring covers hundreds of bearing locations that vibration monitoring cannot economically cover
- Belt splice and pulley tracking — friction heating at misaligned pulleys and failing splices; detected through thermal gradient analysis along belt path
- Elevator and hoist brake drums — brake drag heating during normal operation detected as abnormal drum temperature; monitored during each brake application cycle
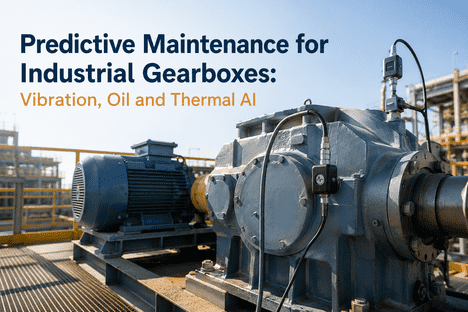
- Gearbox oil temperature — gearbox surface temperature indicating overfilled, underfilled, or degraded oil condition weeks before oil analysis results
Expert Perspective: Why Thermal Imaging Needs AI, Not Better Cameras
In 22 years of infrared thermography practice across power generation, chemical processing, and heavy manufacturing, I have reviewed thousands of IR survey reports and investigated more than 40 equipment failures that resulted in significant production loss or safety incidents. In every case where continuous thermal monitoring would have prevented the failure, the determining factor was not camera resolution, thermal sensitivity, or thermographer skill. It was the absence of continuous data. A thermographer capturing thermal images twice per year — even with a $60,000 high-resolution camera — catches a snapshot of a machine's thermal state at two moments in time. The gradual 2°C-per-week bearing temperature rise that signals incipient failure is invisible between those snapshots, because the thermographer has no baseline for what 'normal' looked like three weeks ago at the same load and ambient conditions. AI continuous thermal monitoring addresses exactly this gap: it watches every asset every minute of every operating day, learns each component's unique thermal baseline under varying load and ambient conditions, and flags the deviation the moment it exceeds the learned threshold — not the moment the next quarterly survey happens to be scheduled. The question for every plant considering a thermography program upgrade should not be 'should we get a better camera?' but rather 'should we watch our assets continuously rather than once per quarter?' The answer, in every case where the consequence of failure justifies the monitoring investment, is yes.
Frequently Asked Questions
Quarterly handheld surveys conducted by a certified thermographer typically cover 2–3 hours of thermal data collection per quarter, or approximately 8–12 hours per year per plant, representing roughly 0.09% of total operating hours. Continuous AI thermal monitoring from fixed-mount cameras covers 8,760 hours per year — 100% of operating time. The practical detection improvement is documented across multiple industry deployments: facilities with AI thermal monitoring detect 70% more thermal faults than those relying on periodic surveys alone, with 85–90% of electrical hot spots detected before reaching critical severity thresholds defined by NFPA 70B. The improvement is most dramatic for slow-developing faults — bearing lubrication degradation, connection resistance creep, and insulation breakdown — that progress over 30–90 days and are routinely missed by quarterly snapshot surveys.
No. AI thermal imaging automates the routine detection and classification tasks that occupy the majority of a thermographer's time — reviewing thousands of thermal images for temperature anomalies, trending component temperatures over time, and generating inspection reports. It does not replace the certified thermographer's expertise in complex multi-fault diagnosis, thermographic program design, radiometric accuracy validation, or ASNT SNT-TC-1A compliance oversight. What AI delivers is a force multiplier: the same thermographer who previously reviewed 100 images per week can now oversee AI-flagged anomalies across 10,000 monitored components, focusing their expertise on validation, root cause analysis, and high-consequence failure mode assessment. Facilities typically reassign certified thermographers from routine inspection data collection to model validation, anomaly confirmation, and continuous improvement of the AI detection thresholds.
AI-enhanced thermal monitoring programs should align with the same standards that govern traditional infrared thermography. ASNT SNT-TC-1A provides the framework for thermographer certification and program documentation — iFactory's platform maintains full traceability of all thermal data, AI classification decisions, and work order outcomes for audit. NFPA 70B (Recommended Practice for Electrical Equipment Maintenance) defines infrared inspection intervals and severity classification criteria for electrical distribution equipment — iFactory applies NFPA 70B severity thresholds (20°C delta-T for critical electrical hot spots, 40°C for emergency) as default classification boundaries. ISO 18436-7 defines thermographer competency requirements — the AI platform does not replace certified thermographer oversight but provides data that certified personnel validate. iFactory recommends that all AI-detected critical and emergency severity anomalies be reviewed by a certified thermographer before work order execution, with the review documented in the Shift Logbook for compliance.
Radiometric accuracy is the fundamental challenge in automated thermography. A thermal camera measures surface temperature based on the infrared energy emitted by the target, but the measurement is affected by emissivity of the target surface, reflected temperature from surrounding objects, ambient air temperature and humidity, and distance from camera to target. iFactory addresses each variable through per-component emissivity configuration based on surface material (painted metal: 0.92–0.96, unoxidized copper: 0.1–0.2, electrical tape: 0.95), reflected temperature correction using the reflector method per ASTM E1933, ambient temperature normalization that applies a correction factor from an adjacent reference temperature measurement for outdoor equipment subject to solar loading and weather variation, and distance compensation for the atmospheric absorption effect at longer ranges. Baseline models are computed after the first 72 hours of monitored operation, during which the AI learns the normal temperature range for each pixel region under varying load and ambient conditions. Deviations from baseline are computed as normalized anomaly scores rather than raw temperatures, enabling consistent detection thresholds across seasonal and load variation.
For a mid-size industrial facility with 50–200 critical assets targeted for thermal monitoring, a full AI thermal imaging deployment runs $40,000–$95,000 total investment over a 4–8 week implementation timeline. The cost breakdown is approximately: fixed-mount thermal camera hardware ($15,000–$35,000 depending on resolution, field of view, and environmental rating), edge computing device for on-premise AI inference ($6,000–$12,000), iFactory platform configuration including camera commissioning, per-asset baseline learning, and alarm threshold calibration ($12,000–$30,000), and CMMS integration with thermal work order templates and Shift Logbook configuration ($7,000–$18,000). The implementation timeline breaks into Stage 1 (weeks 1–2): camera installation, network connectivity, and data validation; Stage 2 (weeks 3–4): baseline learning period during which the AI observes normal thermal patterns without generating alerts; Stage 3 (weeks 5–6): threshold calibration and first AI alerts validated by certified thermographer; Stage 4 (weeks 7–8): full go-live with automatic work order generation and Shift Logbook integration. ROI is typically demonstrated within 60 days from the first prevented thermal failure — a single prevented electrical hot spot that would have escalated to arc flash or motor failure recovers the full camera and platform investment.