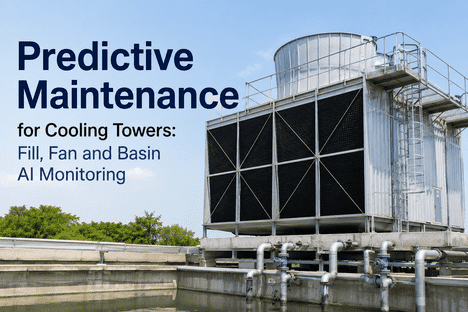
Predictive Maintenance for Cooling Towers: Fill, Fan and Basin AI Monitoring
By Christopher Hayes on June 9, 2026
Cooling towers are the thermal rejection backbone of industrial and power generation facilities — dissipating waste heat from condensers, process coolers, compressors, and chiller systems across refineries, chemical plants, data centers, and thermal power stations. Despite their critical role in plant thermal efficiency, cooling towers remain among the most under-monitored assets in industrial reliability programs. Fill degradation, fan drivetrain faults, basin water quality excursions, and approach temperature drift develop gradually over weeks to months — often progressing to catastrophic failure before operators detect the efficiency penalty. Traditional cooling tower maintenance relies on periodic visual inspection, manual thermography, and time-based belt and bearing replacements. A typical cooling tower with 8–12 cell fans may receive fill inspections once every 12–18 months, leaving degradation from biological fouling, scaling, and mechanical erosion undetected between inspection intervals. AI-native predictive maintenance closes these gaps by ingesting continuous sensor telemetry — approach temperature, fan vibration, fan motor current, basin water conductivity and pH, fill differential pressure — and correlating these signals against known degradation models. iFactory AI's industrial software platform, including its Shift Logbook and predictive maintenance engine, enables reliability teams to deploy AI-driven cooling tower monitoring without replacing existing CMMS or building management systems. Book a Demo to see how iFactory applies AI cooling tower prediction across industrial and power generation cooling assets. This guide covers cooling tower degradation mechanisms, AI model architectures for fill condition monitoring, fan drivetrain fault detection, basin water quality prediction, approach temperature trend analysis, and the practical deployment path for reliability engineers evaluating modernization.
Cooling Towers · Condition Monitoring · 2026
Predictive Maintenance for Cooling Towers: Fill, Fan and Basin AI Monitoring
Continuous approach temperature monitoring · AI fill condition classification · fan vibration analysis · basin water quality prediction — reducing cooling tower downtime, optimizing chemical treatment, and improving plant thermal efficiency.
Why Periodic Cooling Tower Inspection Is Hitting Its Ceiling in Reliability Management
The traditional approach — quarterly visual inspection of fill media, semi-annual fan drivetrain vibration readings, manual basin water sampling, and time-based belt/packing replacement — was the established standard for cooling tower maintenance through the 2010s. A typical industrial cooling tower with 600,000+ square feet of fill surface area may receive formal fill inspection once every 18 months. Fan gearboxes operating at 300–500 RPM with right-angle bevel drives may be checked for vibration on an annual basis. Basin water chemistry — conductivity, pH, alkalinity, hardness — may be tested weekly via grab samples but the data remains siloed from maintenance decision-making. The four specific ceilings are well documented in Cooling Technology Institute performance data and failure analysis research.
01
Fill Condition Blindness
Periodic visual inspection misses the gradual fouling, scaling, and biological growth that reduce heat transfer area over months. Fill differential pressure may rise 30–50% before operators notice approach temperature degradation. AI fill monitoring detects fouling onset at 5–10% blockage.
Gap: Visual vs Continuous
02
Fan Drivetrain Sampling Gap
Annual vibration readings on fan gearboxes, bearings, and shafts miss developing faults that propagate over weeks. Gear tooth pitting, bearing spalling, and shaft misalignment progress undetected until secondary damage triggers unplanned cell outages.
Gap: Periodic vs Continuous
03
Basin Chemistry Silos
Manual grab samples provide weekly chemistry snapshots but remain disconnected from maintenance systems. Conductivity excursions leading to scale formation, corrosion, or biological blooms are addressed reactively only after visible water quality degradation.
Gap: Disconnected vs Integrated
04
Approach Temperature Drift
Approach temperature — the difference between cold water outlet and ambient wet-bulb — is the primary cooling tower performance indicator. A 2–5°F approach temperature increase typically develops over weeks to months and is attributed to ambient variation rather than fill degradation.
Gap: Reactive vs Trend-based
What AI Cooling Tower Monitoring Actually Adds to Reliability Programs
The misconception some facility and reliability engineers carry: AI cooling tower monitoring replaces existing water treatment programs, vibration analysis contracts, or visual inspection protocols. It doesn't. Your existing water treatment chemistry program, fan drivetrain maintenance practice, and fill inspection procedures continue providing their respective value. What changes is the continuous data ingestion layer and the cross-correlation capability. Continuous sensor telemetry — approach and range temperature, fan accelerometer waveforms, motor current, basin conductivity and pH, fill differential pressure, make-up water flow — feeds AI models that detect fill fouling onset, classify fan drivetrain fault progression, predict basin chemistry excursions, and estimate remaining useful life for fill media and gearbox components. The existing CMMS receives higher-quality input — not just "cooling tower fill degraded" but "fill differential pressure elevated 22% above baseline — biological fouling pattern at 87% confidence — approach temperature trending 3.1°F above design at current load — recommended action: schedule fill cleaning during next planned outage, adjust biocide feed rate." iFactory AI's Shift Logbook provides operators and reliability engineers with a unified interface for cooling tower status updates, shift handovers, and AI-generated maintenance recommendations integrated with existing CMMS and water treatment workflows.
Manual approach temperature calculation from DCS data
AI-driven approach trend analysis with load normalization
Chemical treatment
Fixed schedule based on make-up water analysis
AI-optimized chemical dosing from real-time basin chemistry
Fault alert latency
Days to weeks — depends on analyst schedule
Real-time alert on fault confirmation
Operator interface
Water treatment reports + vibration software
Mobile dashboards + shift logbook + AI copilot
Cooling Tower Degradation Modes — What AI Detects at Each Stage
Cooling towers degrade through distinct mechanical, thermal, and chemical processes across three primary subsystems — fill media, fan drivetrain, and basin water — each producing measurable signatures that AI models can detect, classify, and trend. Understanding these degradation mechanisms is essential for evaluating predictive maintenance solutions serving cooling tower assets.
F
Fill Media Fouling
Biological growth (algae, biofilm), scaling (calcium carbonate, silica), and particulate deposition reduce heat transfer surface area. AI detects via differential pressure rise, approach temperature increase, and infrared temperature patterns across fill depth.
Predictive lead time: 4–12 weeks
G
Fan Gearbox & Bearing Faults
Gear tooth wear, bearing spalling, and lubrication degradation in right-angle bevel gearboxes. Vibration signatures at gear mesh frequencies and bearing fault frequencies. Output shaft misalignment generates 1× RPM axial vibration.
Predictive lead time: 14–30 days
B
Basin Water Chemistry Excursions
Conductivity spikes from cycles-of-concentration exceedance, pH drift affecting scale/corrosion balance, biological bloom precursors. AI models correlate chemistry trends with make-up water flow, drift loss, and thermal load patterns.
Predictive lead time: 2–7 days
A
Approach Temperature Degradation
Combined effect of fill fouling, fan performance loss, water distribution imbalance, and ambient condition variation. AI separates load-independent degradation from normal ambient-driven approach variation using historical baseline models.
Predictive lead time: 6–16 weeks
The Keep / Retire / Transform / Replace Decision Matrix
Migration discipline starts here. Every cooling tower reliability artifact in your current operation falls into one of four categories. Getting the categorization right in week one of the workshop saves quarters of debate later.
Keep
Core cooling tower foundations
CMMS work order engine
Parts inventory & procurement
Water treatment program
ERP financial integration
Cooling tower OEM design specs
Established capabilities. No business case to replace. AI cooling tower monitoring writes recommendations to these systems.
Retire
Legacy inspection layers
Quarterly fill visual inspection logs
Annual fan vibration data sheets
Manual approach temperature calculation
Paper-based water treatment logs
Email-based drift loss alerts
Replaced by continuous telemetry ingestion and AI-driven condition classification. 80–90% reduction in manual inspection effort.
Transform
Analysis workflows
Cooling tower health scoring
Fill fouling severity trending
Fan gearbox degradation tracking
Basin chemistry predictive modeling
Shift handover for tower status
Become AI model invocations grounded in continuous sensor data. Intelligence upgraded via iFactory Shift Logbook.
Replace
Alert & notification layer
Legacy alarm threshold gateways
Manual escalation workflows
Email-based approach temperature alerts
Paper-based water treatment logs
Standalone fan vibration reports
Event-driven AI alert engine replaces manual notification. Faster, context-aware, with automated work order creation in CMMS.
Want this matrix applied to your specific cooling tower configuration in a working session? Book a Demo to walk through every cooling tower cell and prioritize your AI monitoring rollout.
Three Deployment Paths for Cooling Tower AI Monitoring
Same starting point, three valid destinations. The right path depends on cooling tower count, cell configuration, current sensor coverage, and data infrastructure maturity. Plants that pick the wrong path spend 12 months in pilot purgatory. Plants that pick the right path deploy in 6–12 weeks.
Path A
Augment in Place
6–8 weeks
AI cooling tower monitoring runs alongside existing inspection and water treatment program. Shadow mode for 4 weeks. Alerts flow to CMMS for review. No legacy inspection protocols retired in this phase.
Best fit
Critical cooling assets · risk-averse reliability teams · first AI deployment in cooling tower monitoring
Wk 1–2 Sensor & data federation
Wk 3–5 Shadow mode AI
Wk 6–8 CMMS integration live
Path B
Hybrid Migration
8–12 weeks
AI cooling tower layer augments visual inspection and water treatment program. Existing DCS and BMS retained. CMMS and ERP preserved. Chemical dosing integration established.
Best fit
Mature facility programs · moderate budget authority · sponsorship for digital transformation
Wk 1–3 Discovery · matrix
Wk 4–8 Deploy AI cooling tower layer
Wk 9–12 Mobile UX migration · cutover
Path C
Full Modernization
10–14 weeks
Scheduled inspection-only approach retired entirely for AI-native continuous monitoring. All cooling tower cells covered against matrix with automated chemical treatment optimization.
Best fit
Large cooling tower fleets (8+ cells) · siloed legacy systems · strategic platform consolidation goal
Wk 1–4 Full tower inventory + matrix
Wk 5–10 Parallel build + test
Wk 11–14 Cutover + legacy sunset
Pick the Right Path for Your Cooling Tower Fleet in a 90-Minute Workshop
iFactory AI's cooling tower reliability practice runs a focused workshop against your specific tower configuration, existing sensor coverage, CMMS setup, and water treatment program. You leave with a defended path recommendation, an 8-week deployment plan, and a cost reduction projection grounded in your cooling tower performance history.
Generic industrial IoT vendors handle the sensor hardware. Cooling tower-aware vendors handle the integration reality — fill fouling model calibration per water chemistry and make-up source, fan drivetrain fault frequency configuration per gearbox type, basin chemistry excursion prediction with treatment optimization, CMMS-native work order generation with cooling tower cell specific location, and zero-disruption deployment alongside existing water treatment and inspection programs. Eight criteria separate vendors who've done cooling tower fleet modernizations from vendors selling a demo.
01
Fill condition model calibration
Ask:
"Does your AI platform calibrate fill fouling models for specific water chemistry, make-up source, and biological treatment program?"
Fill fouling rates vary dramatically with water hardness, silica content, suspended solids, and biological activity. Platforms must auto-calibrate fouling thresholds from make-up water analysis and cycles-of-concentration data without manual reconfiguration per tower.
02
Fan drivetrain fault frequency configuration
Ask:
"Does your platform automatically configure fan gearbox fault frequencies from OEM nameplate data and bearing specifications?"
Cooling tower fan gearboxes — right-angle bevel, helical bevel, or parallel shaft — each produce unique gear mesh and bearing fault frequencies. Platforms must auto-calculate these bands from manufacturer data without manual vibration analyst configuration per gearbox.
03
Approach temperature load normalization
Ask:
"Does your AI model separate load-independent fill degradation from ambient-driven approach temperature variation?"
Approach temperature varies with wet-bulb temperature, heat load, and airflow. Models must normalize for ambient conditions and thermal load to isolate the fill fouling and fan performance component from expected variation.
04
Basin chemistry excursion prediction
Ask:
"Does your platform predict water chemistry excursions — conductivity exceedance, pH drift, biological bloom precursors — before visible water quality degradation?"
Cycles-of-concentration, drift loss rate, and biocide effectiveness vary with load and season. AI models correlating chemistry trends with make-up flow, heat load, and ambient conditions predict excursion events 2–7 days in advance.
05
Multi-cell fault separation
Ask:
"Can your platform detect and track faults independently for each cooling tower cell sharing a common basin?"
A multi-cell tower may have 4–12 fans sharing a common cold water basin. Platforms must separate and trend fan fill, fan, and local basin conditions per cell even when common return water temperature masks individual cell degradation.
06
CMMS-native work order with location
Ask:
"Does your platform generate CMMS work orders with cooling tower cell number, subsystem (fill, fan, basin), fault type, and recommended action?"
AI predictions without actionable, location-specific work orders create process friction. Work orders must include the exact cell number, subsystem identified, fault classification, and recommended corrective action.
07
Cooling tower fleet dashboard
Ask:
"Does your platform provide a cooling tower fleet health dashboard with per-cell fill condition, fan health, basin water quality, and thermal performance?"
Total cooling tower asset visibility is the primary decision tool. Dashboards must rank cells by RUL, fill condition, fan health, and thermal efficiency with drill-down to individual sensor trends.
08
Deployment timeline commitment
Ask:
"When does the first AI-classified cooling tower fill or fan alert reach our CMMS in production?"
6–12 weeks is the production-grade benchmark for hybrid migration. Path A is 6–8 weeks. Path C is 10–14 weeks. Vendors quoting 6+ months are building custom development.
Want to score your shortlisted vendors against this 8-criterion framework? Run a vendor evaluation working session with our team and get a structured scorecard against your cooling tower fleet requirements.
The ROI Math — What AI Cooling Tower Monitoring Delivers for Facility Reliability
The business case for AI-native cooling tower predictive maintenance isn't about software cost — it's about cost avoidance on unplanned cell outages, condenser fouling, chilled water temperature excursions, and excessive chemical consumption. Facilities moving from periodic inspection and manual water treatment to AI continuous cooling tower monitoring see measurable improvements across four metrics in the first quarter post-deployment.
−40–60%
Unplanned cell downtime
AI detects fan gearbox faults and fill degradation 4–12 weeks before failure. Emergency cell outages shift to planned maintenance with pre-positioned fill packs and gearbox spares.
−15–25%
Chemical treatment cost
AI-optimized biocide and scale inhibitor dosing based on real-time basin chemistry reduces chemical overfeed while maintaining water quality within target ranges.
−5–15%
Condenser approach temperature
Optimized fill cleaning and fan performance from AI detection reduces condenser backpressure and improves overall plant thermal efficiency at all load conditions.
6–9 mo
Typical ROI payback
Full investment recovery through unplanned downtime reduction, chemical optimization, energy efficiency improvement, and extended cooling tower asset life.
Expert Perspective
"The single biggest mistake facility teams make in cooling tower monitoring modernization is treating it as a sensor installation project. It isn't. Your existing water treatment program, visual inspection protocols, and DCS temperature readings work as designed — there's no business case to replace them wholesale. What needs to change is the data ingestion density and the cross-correlation layer. Quarterly fill inspections and weekly grab samples capturing a snapshot of tower health need to migrate to continuous thermal, vibration, and water chemistry telemetry feeding AI models that detect fill fouling onset at 5% blockage, classify fan gearbox fault progression across four severity stages, predict basin chemistry excursions before they degrade water quality, and separate load-independent approach temperature degradation from normal ambient variation. The architectural decision isn't inspection-or-AI — it's inspection-plus-AI-plus-continuous-telemetry-plus-chemistry-correlation. Facilities that frame it correctly deploy in 8–12 weeks. Facilities that frame it as rip-and-replace spend 12 months in pilot purgatory."
— Cooling Tower Reliability Practice, 2026 industry insight
8–12 wk
hybrid deployment with pre-configured tower templates
80–90%
reduction in manual fill and water inspection effort
Zero rip
of existing CMMS, DCS, or water treatment systems
Conclusion: The Modernization Decision Has Three Right Answers
Periodic visual inspection, manual water sampling, and schedule-based belt and bearing replacement aren't failing in cooling tower reliability programs — they're hitting a sampling ceiling that human-dependent methods can't cross. AI-native continuous cooling tower monitoring adds the fill condition classification, fan drivetrain fault detection, basin water quality prediction, and approach temperature trend analysis layer that traditional methods were never designed to deliver: 24/7 thermal, vibration, and water chemistry telemetry ingestion, automated fill fouling severity classification, fan gearbox fault detection with four-stage severity tracking, basin chemistry excursion prediction 2–7 days in advance, and mobile-native operator interfaces grounded in real-time cooling tower health data. The modernization conversation has three valid answers depending on tower count, cell configuration, and existing sensor coverage — augment in place (6–8 weeks), hybrid migration (8–12 weeks), or full modernization (10–14 weeks). All three keep existing water treatment programs, CMMS, and DCS infrastructure intact and reuse current temperature and flow sensor installations. All three deliver 40–60% reduction in unplanned cell downtime within the first quarter. The decision worth making in 2026 isn't whether to modernize cooling tower monitoring — it's which of the three paths fits your specific facility asset context. Walk through your specific cooling tower cells and continuous monitoring requirements with our team.
Run the AI Cooling Tower Workshop Built for Your Facility
iFactory AI's cooling tower reliability practice runs a 90-minute workshop against your real tower cells, existing sensor coverage, water treatment program, and CMMS configuration. You leave with a defended path recommendation, the matrix applied to your cooling tower configuration, and a cost reduction projection grounded in your tower performance history.
Does AI cooling tower monitoring replace our existing water treatment program?
No. Your existing water treatment chemistry program, chemical supplier, and treatment protocols continue providing their established value — these are specialized capabilities with regulatory and operational significance. What changes is the data ingestion layer and the predictive capability: continuous basin conductivity, pH, temperature, and turbidity data now feeds AI models that predict chemistry excursions and optimize chemical dosing setpoints, in addition to the periodic grab sample data your water treatment team already collects. The AI prediction layer sits on top of existing water treatment data streams through standard API integration.
What cooling tower degradation modes can AI actually predict?
Production-grade AI cooling tower monitoring covers all primary degradation modes across all subsystems: fill media fouling (biological, scaling, and particulate detected via differential pressure and thermal performance trends), fan drivetrain faults (gearbox tooth wear, bearing spalling, shaft misalignment, belt degradation via vibration and current signature), basin water quality excursions (conductivity exceedance, pH drift, scaling potential, corrosion indices, biological bloom precursors via continuous chemistry telemetry), approach temperature degradation (load-independent fill and fan performance loss separated from ambient variation), water distribution imbalance (temperature differential across fill sections), and drift eliminator degradation (pressure drop and moisture carryover indicators). Each mode is independently classified with severity trending through the degradation progression.
Does deployment require new sensors on every cooling tower cell?
Not necessarily. Production-grade AI platforms integrate with existing sensors already installed on most industrial cooling towers — approach and return temperature sensors in the DCS or BMS, fan accelerometers on critical cells, conductivity and pH probes in the basin, make-up water flow meters. iFactory's federation layer reuses your current investment in installed instrumentation, DCS data streams, and water treatment system data. For towers with limited sensor coverage, a minimum viable sensor kit — temperature sensors on supply and return, differential pressure across fill, basin conductivity/pH, and single-axis accelerometers on fan gearboxes — can be installed during a scheduled tower outage. Typical deployment requires 8–15 sensor points per multi-cell tower.
How does remaining useful life prediction work for cooling tower components?
Each subsystem's continuous telemetry feeds into dedicated AI models trained on historical degradation data. Fill media models track differential pressure trends, approach temperature deviation, and water chemistry correlation to estimate remaining service life before replacement achieves payback. Fan gearbox models analyze vibration at gear mesh and bearing fault frequencies, tracking progression through four severity stages and projecting time-to-failure from degradation trajectory models. Basin models evaluate conductivity cycling trends, scaling index progression, and corrosion coupon correlation to predict when water chemistry excursions will degrade fill or heat exchanger performance. Each model outputs RUL estimates with confidence intervals — enabling planned fill replacement during scheduled tower outages rather than emergency repairs that force production curtailments.
Which deployment path fits a facility with critical process cooling requirements best?
Path A (Augment in Place) is the right starting point for facilities where cooling tower failure directly impacts process or condenser performance — such as chemical plants, refineries, data centers, and combined-cycle power plants. The platform runs alongside existing inspection and water treatment programs for 4 weeks in shadow mode, generating fill condition classifications, fan health assessments, and chemistry excursion predictions logged for review but not triggering work orders. Facility teams compare AI predictions against existing inspection findings and actual degradation events before approving cutover with full traceability. No legacy programs retire in Path A — the existing water treatment contract and inspection schedule continue running as a control comparison. After 6–12 months of validation, most facilities progress to Path B or C to capture additional efficiency benefits from automated chemical dosing optimization and integrated cell outage planning.