A food processing company in the American Midwest had 47 open work orders on a Monday morning. The maintenance planner sorted them the way planners everywhere do — by who had complained most recently and what was obviously broken. A sticking warehouse door (reported three times over the weekend by a frustrated logistics manager) went to the top of the queue. A minor vibration note on chiller unit 7 (logged once by a night-shift operator with no follow-up) sat at position 34. By Wednesday, the door was fixed. By Thursday, chiller unit 7 seized. The compressor failure destroyed $380,000 worth of refrigerated product, triggered a regulatory hold on two production lines, and cost the plant four days of partial shutdown. The vibration note — which an AI system would have scored as a P1 based on asset criticality, failure progression rate, and downstream production impact — had been buried beneath 33 work orders that collectively had less financial consequence than the chiller alone. The loudest voice won. The most critical asset lost.
iFactory AI Priority Intelligence
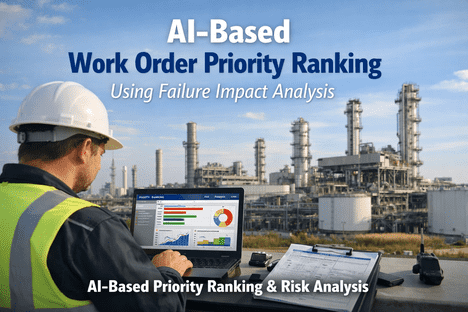
AI-Based Work Order Priority Ranking Using Failure Impact Analysis
How AI replaces gut-feel triage with a scored, defensible priority ranking that ensures the most consequential work always happens first
45%
Of technician time consumed by emergency work orders
70%
Of unplanned downtime traces to poor asset prioritisation
4.8x
Cost premium of emergency repairs vs planned maintenance
22%
Downtime reduction from risk-based prioritisation alone
Why "Whoever Shouts Loudest" Is the Worst Prioritisation System
In most plants, work order priority is set by one of three methods: whoever escalated loudest, whatever the planner remembers from this morning, or whichever work order has been open the longest. None of these methods consider what actually matters — the financial and operational consequence of delay. The result is that 70% of reactive maintenance goes to low-impact equipment simply because those issues are more visible, while the high-risk assets with hidden degradation patterns wait silently in the backlog until they fail catastrophically.
The Three Broken Priority Models
Loudest Voice Wins
Priority set by who escalates hardest. A VP's conference room projector outranks a chiller serving 400 people because someone with authority complained.
Priority by politics, not consequence
First In, First Out
CMMS sorts by submission date. A light switch reported Monday queues ahead of a hydraulic leak reported Tuesday — regardless of safety or production impact.
Priority by timestamp, not criticality
Gut Feel Triage
The planner spends 2+ hours each morning manually scanning the backlog and sorting by intuition. Quality depends entirely on one person's memory and judgement.
Priority by memory, not data
Recognise your Monday morning? See how AI-scored priority ranking eliminates triage entirely.
How AI Scores Work Order Priority
AI priority ranking replaces subjective triage with a composite score calculated from weighted factors that reflect the actual operational and financial consequence of each work order. Every work order is scored automatically in under 2 seconds — and the entire backlog is re-ranked in real time as new work orders enter and conditions change.
The AI Priority Scoring Framework
Safety Impact
Weight: 30%
Does this condition endanger people? Electrical hazards, pressure vessel risks, fall hazards, chemical exposure, and fire risks score highest. Safety always dominates the priority calculation.
1–3: No safety risk
8–10: Imminent personnel danger
Production Impact
Weight: 25%
How does this failure affect output? A bottleneck machine that stops the entire line scores higher than a redundant pump with a backup. AI maps the production dependency chain to calculate true impact.
1–3: No production effect
8–10: Full line shutdown
Asset Criticality
Weight: 20%
How important is this equipment to overall operations? Category A assets (production-stopping) outrank Category B (partial impact) and Category C (minimal consequence) using the ABC criticality classification.
Cat C: Minimal impact
Cat A: Production-critical
Cost of Delay
Weight: 15%
What does every hour of delay cost in downtime losses, emergency repair premiums, energy waste, product spoilage, or collateral damage to adjacent equipment? AI calculates the financial escalation rate per hour.
1–3: Under $500/hr delay
8–10: Over $50K/hr delay
Compliance & Regulatory
Weight: 10%
Is there a regulatory deadline, warranty expiration, or compliance audit date that makes timing non-negotiable? OSHA, EPA, NFPA, and industry-specific standards are evaluated automatically.
1–3: No regulatory risk
8–10: Regulatory violation imminent
From Score to Action — The Priority Tiers
Once every work order has a composite score, the system maps it to a priority tier that determines response time, approval workflow, and resource allocation. This mapping is consistent, transparent, and defensible — no more arguing about what gets done first.
P1
Critical
Score: 8.0–10.0
Imminent safety hazard or production-stopping failure. Immediate dispatch. Auto-escalation to supervisor. Parts pre-staged.
Response: immediate
P2
High
Score: 6.0–7.9
Significant production impact or developing safety risk. Scheduled within current shift or next available window. Supervisor notified.
Response: within 4 hours
P3
Medium
Score: 4.0–5.9
Moderate operational impact. Scheduled within 24–48 hours. Can be batched with other tasks in the same area for efficiency.
Response: within 48 hours
P4
Low
Score: 2.0–3.9
Minor operational inconvenience. Scheduled during next planned maintenance window. No production impact from delay.
Response: within 1 week
P5
Planned
Score: 0.1–1.9
Cosmetic, non-functional, or improvement items. Scheduled during next shutdown or when resources are available. Backlog-managed.
Response: next planned outage
What Makes AI Priority Ranking Different From Static CMMS Sorting
Most CMMS platforms let planners assign a P1–P5 label manually. AI priority ranking goes far beyond that — it calculates, adapts, and re-ranks continuously based on real-time data, not static labels set at the moment of submission.
How priority is set
Planner selects P1–P5 manually at submission based on description
AI calculates a composite score from 5 weighted factors using live data
When priority updates
Never — the label stays whatever was set at creation
Continuously — score adjusts as conditions change, time passes, and sensor data evolves
Failure progression
Invisible — a degrading asset does not automatically escalate its work order
Monitored — if the fault worsens, the priority score increases and the WO moves up the queue
Financial context
None — the system has no concept of downtime cost per asset
Built-in — cost-per-hour-of-delay is factored into every priority calculation
Backlog re-ranking
Manual — planner must re-sort the entire list when new WOs arrive
Automatic — entire backlog re-ranks in real time as conditions change
Still sorting your backlog manually every morning? See AI-scored priority ranking on your own work orders.
The Business Impact of Getting Priority Right
When the most consequential work always happens first — and low-impact work no longer crowds out critical maintenance — the financial and operational results are immediate and measurable.
22%
Reduction in unplanned downtime from risk-based prioritisation alone
45%
Reduction in emergency work order volume as predictive WOs take priority
4.8x
Cost savings per repair when planned work replaces emergency callouts
2.5hrs
Daily planner time recovered by eliminating manual backlog sorting
100%
Audit-ready documentation — every priority decision has a traceable score
25–40%
Higher budget approval rates when CapEx requests are backed by AI risk data
Frequently Asked Questions
Can we customise the scoring weights for our facility?
Yes. The five scoring factors and their weights are fully configurable. A hospital might weight Safety at 40% and Compliance at 20%. A manufacturing plant might weight Production Impact at 35% and Cost at 20%. The framework adapts to what matters most for your specific operation, industry, and regulatory environment.
How does AI know the criticality of each asset?
Asset criticality is imported from your existing asset registry or established during onboarding using the ABC classification method. Category A assets are production-stopping. Category B cause partial impact. Category C have minimal consequence. The AI enriches this with real-time data — failure frequency, repair cost history, and production dependency mapping — to maintain a live criticality score that evolves as conditions change.
What happens when two work orders have the same priority score?
Tie-breaking uses secondary factors: Remaining Useful Life (the asset closer to failure goes first), cost-of-delay escalation rate (the one getting more expensive faster goes first), and parts readiness (the one with parts in stock goes first, since it can be completed immediately). True ties are extremely rare with five weighted factors producing composite scores to two decimal places.
Does the priority score change over time if we do not act?
Yes. This is one of the most important features. If a work order sits in the backlog and the underlying condition worsens — sensor data shows progression, the RUL estimate drops, or a compliance deadline approaches — the priority score automatically increases and the work order moves up the queue. Conversely, if the condition stabilises, the score may hold or decrease. The backlog is a living, dynamic ranking.
Can supervisors override the AI priority?
Yes. AI scores are recommendations, not mandates. Supervisors can override any priority with a documented reason. The system logs every override — creating a feedback loop where the AI learns which human judgements improved outcomes and which did not. Over time, the need for overrides decreases as the model calibrates to your facility's specific patterns.
Ready to Prioritise by Consequence, Not by Complaint?
Your Most Critical Asset Should Never Be at Position 34 in the Queue.
iFactory's AI priority engine scores every work order against safety, production impact, asset criticality, cost of delay, and compliance — ensuring the most consequential work always happens first, every shift, without manual triage.