Biogas plants lose an estimated 18 to 34 percent of produced methane to undetected leaks every year — not from catastrophic equipment failure, but from slow, invisible escape at digester cover seams, flange connections, pressure relief valves, and aging pipework that no quarterly walkthrough or annual optical gas imaging survey can catch while it is still small. The same structures that make anaerobic digestion economically attractive — tall covered digesters, high-elevation piping, enclosed gas handling equipment — are exactly the structures that make manual inspection slow, hazardous, and infrequent. AI vision inspection changes that equation by combining cover condition monitoring, corrosion detection on exposed piping, and continuous methane plume visualization into a single system that never needs a confined space entry permit to do its job. This page covers what actually goes wrong at a biogas plant between inspections, and how continuous AI vision monitoring closes that gap on your own site.
What Happens Between Your Inspection Cycles
Most biogas facilities inspect digester covers and pipework on a quarterly or annual schedule, with methane detection handled by periodic optical gas imaging surveys or manual handheld sniffing rounds. That cadence made sense when the alternative was constant confined-space entry into gas-hazard zones, but it also means a small leak at a membrane seam or a flange connection can run undetected for months, compounding in cost the entire time — lost saleable gas, carbon credit exposure, and a slowly rising safety risk that nobody sees until it is large enough to smell or measure. Understanding what actually happens during that gap is the case for moving from periodic inspection to continuous monitoring, and it is worth walking through in some detail because the cost of the gap is rarely visible until someone adds it up after the fact.
A small seam separation begins at a digester cover anchor point or a gasket starts to degrade at a flange connection. The leak rate is too small to register on routine gas balance calculations.
The leak rate increases gradually as membrane stress or gasket wear progresses. Still below the threshold most manual walkthroughs would catch without a targeted OGI scan of that exact location.
Mass balance discrepancies start appearing in monthly gas production reporting, but by the time the numbers are reviewed and a root-cause investigation is scheduled, the leak has often been running for months.
The scheduled OGI survey finally locates the leak directly — after a full cycle of lost revenue, elevated safety risk, and emissions that a continuous monitoring system would have flagged in its first week.
Cover Condition, Piping Corrosion, and Methane Escape Are Three Different Problems
A biogas plant does not fail in one way — it fails in three distinct ways that happen to share the same root cause of infrequent inspection. Treating them as a single problem is why most facilities end up with gaps: a cover condition survey does not catch pipeline corrosion, and a corrosion inspection does not tell you where methane is actually escaping right now. Each failure mode also has a different consequence profile, which matters when deciding where to prioritize monitoring density — a slow-developing cover degradation issue gives you months of lead time if you are watching for it, while a compressor seal leak can escalate to a safety-relevant concentration in a matter of days.
Digester Cover Degradation
Membrane covers, whether fixed or floating, are exposed to constant UV, chemical stress from the gas phase, and mechanical wear at anchor points and seams. Undetected degradation leads to structural failure risk, gas escape, and eventual replacement costs far higher than early repair.
Piping and Flange Corrosion
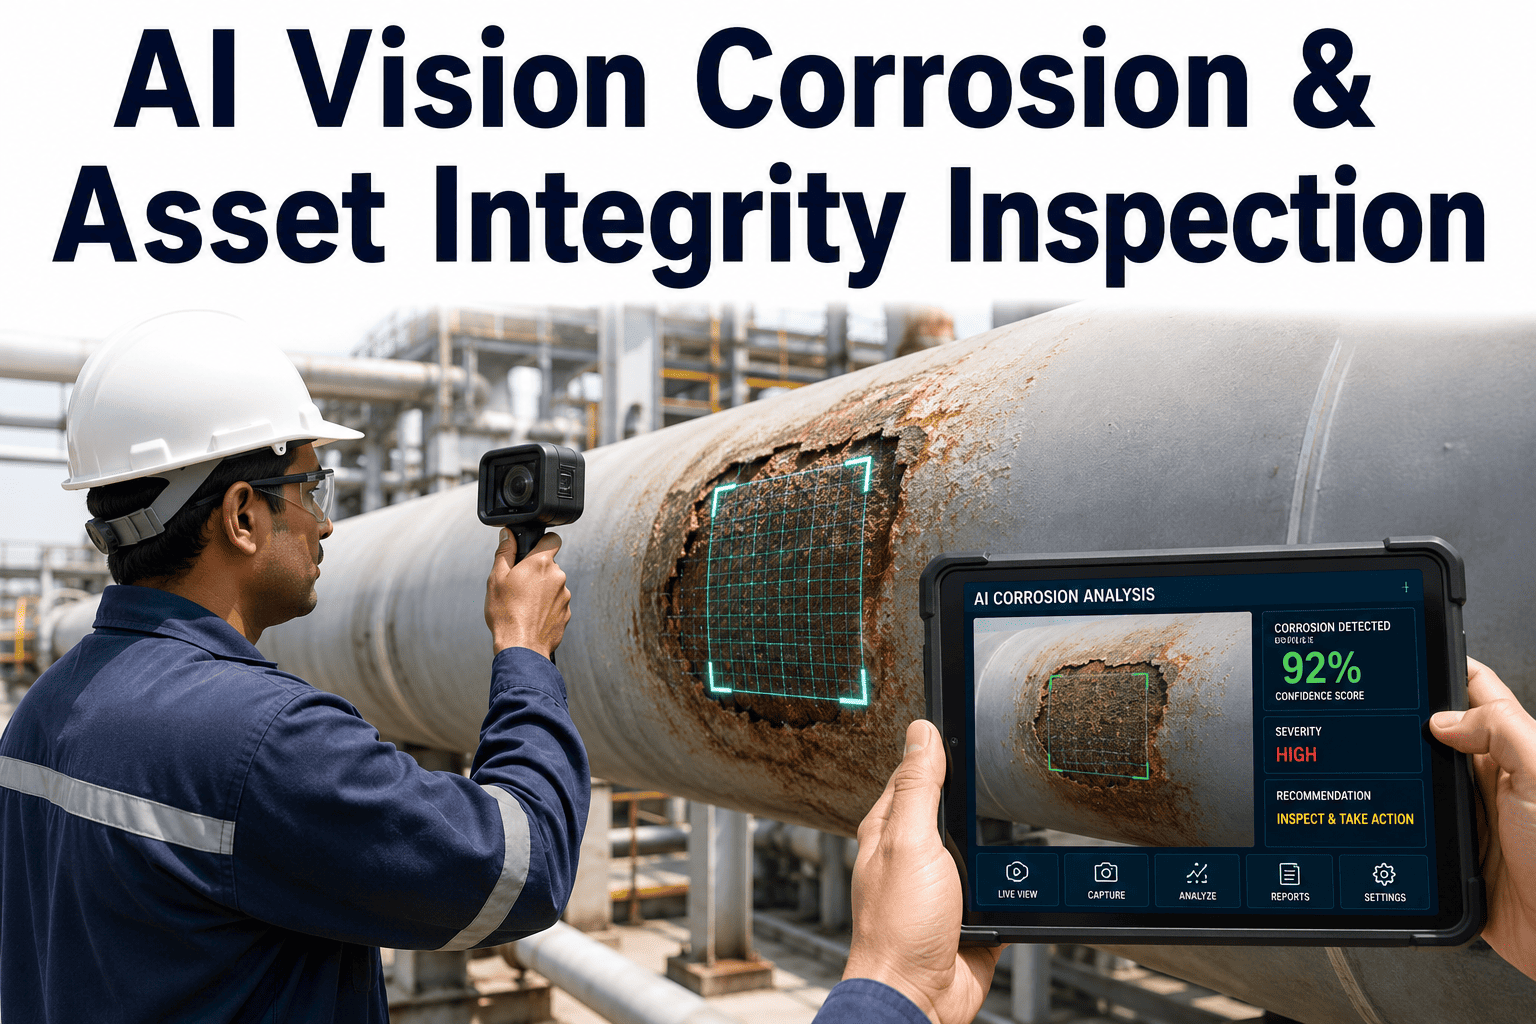
Exposed gas pipework, pressure relief valves, and flange connections corrode from moisture, hydrogen sulfide exposure, and general weathering. Early-stage corrosion is visually identifiable but rarely prioritized for inspection because access often requires elevated work or confined spaces.
Fugitive Methane Escape
Methane is invisible and odourless in the concentrations that matter for early detection. It escapes silently from seams, valve stems, and aging seals long before it reaches a concentration a person or a fixed-point sensor would notice.
Combining Visual, Thermal, and Optical Gas Imaging Into One Continuous Feed
iFactory's approach to biogas plant inspection layers three sensing modes onto the same physical infrastructure rather than running three separate inspection programs — visual and thermal cameras for cover and piping condition, and AI-enhanced optical gas imaging for methane visualization, all processed continuously rather than during scheduled survey windows. Each layer answers a different question, and combining them into one feed is what turns raw footage into a maintenance action instead of a report someone has to interpret later.
Fixed & Drone-Based Capture
Fixed cameras cover high-traffic risk zones continuously, while drone surveys handle elevated piping, cover seams, and areas that would otherwise require scaffolding or rope access to inspect visually.
AI-Enhanced OGI Imaging
Optical gas imaging cameras trained on methane plume signatures highlight invisible gas escape in real time, distinguishing genuine leaks from normal pressure fluctuations during feeding cycles.
Visual Condition Classification
Computer vision models trained on membrane and pipework degradation signatures flag cover seam separation, corrosion staging, and coating failure before they progress to a leak event.
Automated Alert & Work Order
Classified findings are written to the asset record automatically, with location, severity, and image evidence attached — routed as a maintenance work order rather than a report awaiting review.
What Changes When Monitoring Moves From Quarterly Surveys to Continuous Coverage
The core difference between a periodic inspection program and continuous AI vision monitoring is not just frequency — it is the length of time a developing problem is allowed to run before anyone knows it exists, and every day of that gap has a cost attached whether it is measured in lost gas, safety exposure, or eventual repair scope.
| Dimension | Periodic Manual Inspection | Continuous AI Vision Monitoring |
|---|---|---|
| Inspection frequency | Quarterly to annual OGI surveys and walkthroughs | Continuous, 24/7 coverage across monitored zones |
| Confined space entry | Required for internal cover and pipework checks | Eliminated for routine visual and gas monitoring |
| Leak detection lag | Weeks to months between leak onset and discovery | Near real-time detection as the plume forms |
| Cover degradation tracking | Point-in-time condition snapshot per survey | Ongoing trend tracking against historical baselines |
| Corrosion prioritization | Rarely prioritized due to elevated access difficulty | Flagged automatically from drone and fixed camera feeds |
| Reporting to maintenance | Manual report review and work order creation | Automated work order generation with evidence attached |
Where AI Vision Gets Deployed Across a Biogas Site
Coverage is built around the specific structures where leaks and degradation actually originate rather than blanketing the whole site uniformly — the goal is dense monitoring at the points that matter and efficient patrol coverage everywhere else. Getting this zoning right is largely a matter of matching monitoring density to consequence: a compression station leak escalates faster and carries higher immediate risk than a slow membrane seam separation, so the deployment plan typically weights coverage accordingly rather than treating every square meter of the site the same way.
Digester Covers
Membrane seams, anchor points, and access hatches monitored for seal integrity and structural condition across fixed and floating cover types.
Gas Holders
Storage membrane condition and pressure envelope integrity tracked continuously, with methane plume detection layered on the same monitoring points.
Pipework & Flanges
Exposed gas transfer piping, flange joints, and pressure relief valves surveyed for corrosion staging and gasket wear before failure develops.
Compression Stations
Compressor seals and connection points monitored for methane escape at the equipment class most prone to fugitive emissions on-site.
How iFactory Gets a Biogas Plant From Periodic Surveys to Continuous Monitoring
Most facilities considering this shift are not starting from zero — they already have some combination of OGI equipment, SCADA integration, and a maintenance system that the new monitoring layer needs to plug into rather than replace. A turnkey deployment means the site assessment accounts for what already exists on the ground, so the rollout adds continuous coverage without forcing a rebuild of infrastructure that is already working.
Site & Infrastructure Assessment
Engineers map digester covers, gas holders, pipework runs, and existing camera or OGI equipment to define what needs new hardware and what can be integrated as-is.
Camera & Sensor Deployment
Fixed cameras and OGI sensors are installed at priority zones, with drone survey profiles established for elevated or hard-to-reach structures.
Model Calibration
Vision and gas detection models are tuned against your site's specific baseline conditions, distinguishing normal operational variation from genuine developing defects.
Live Integration & Handover
Classified findings route into your maintenance and SCADA systems automatically, with operations staff trained on the monitoring dashboard before full handover.
What This Looks Like in Practice
A municipal-scale biogas facility running covered anaerobic digesters had relied on annual third-party OGI surveys to satisfy emissions compliance reporting, discovering leaks only when the survey team physically walked the site once a year. After deploying continuous AI vision monitoring across digester covers and pipework, the facility identified a developing seam separation at a cover anchor point within the first monitoring cycle — a defect that historical survey data suggested would likely have run undetected for several more months under the previous inspection cadence. The same deployment surfaced early-stage corrosion on a pressure relief valve connection that had never been flagged as a priority under the facility's existing maintenance schedule, precisely because the elevated access required for a manual inspection had made it a low-frequency check item.
Beyond the individual defect catches, the facility's operations team reported a shift in how they planned maintenance budgets and outage windows more broadly. Instead of reserving contingency funds for emergency repairs discovered during the annual survey, planners could schedule cover seam repairs and valve replacements during already-planned maintenance windows, since defects were surfacing weeks or months earlier than the previous inspection cadence would have allowed. That shift from reactive to planned maintenance spending is frequently the difference between a repair that costs a few thousand dollars and one that costs many times more once a small leak has progressed into a structural or safety issue requiring emergency response.
We used to find out about a leak when the annual survey team told us, months after it started. Now we get an alert the same week a seam starts to separate, before it has cost us any meaningful volume of gas.
Frequently Asked Questions
Stop Waiting for the Annual Survey to Find Your Next Leak
iFactory combines digester cover condition monitoring, piping corrosion detection, and real-time methane plume visualization into one continuous feed — routed directly into maintenance action, without confined space entry or a production interruption.