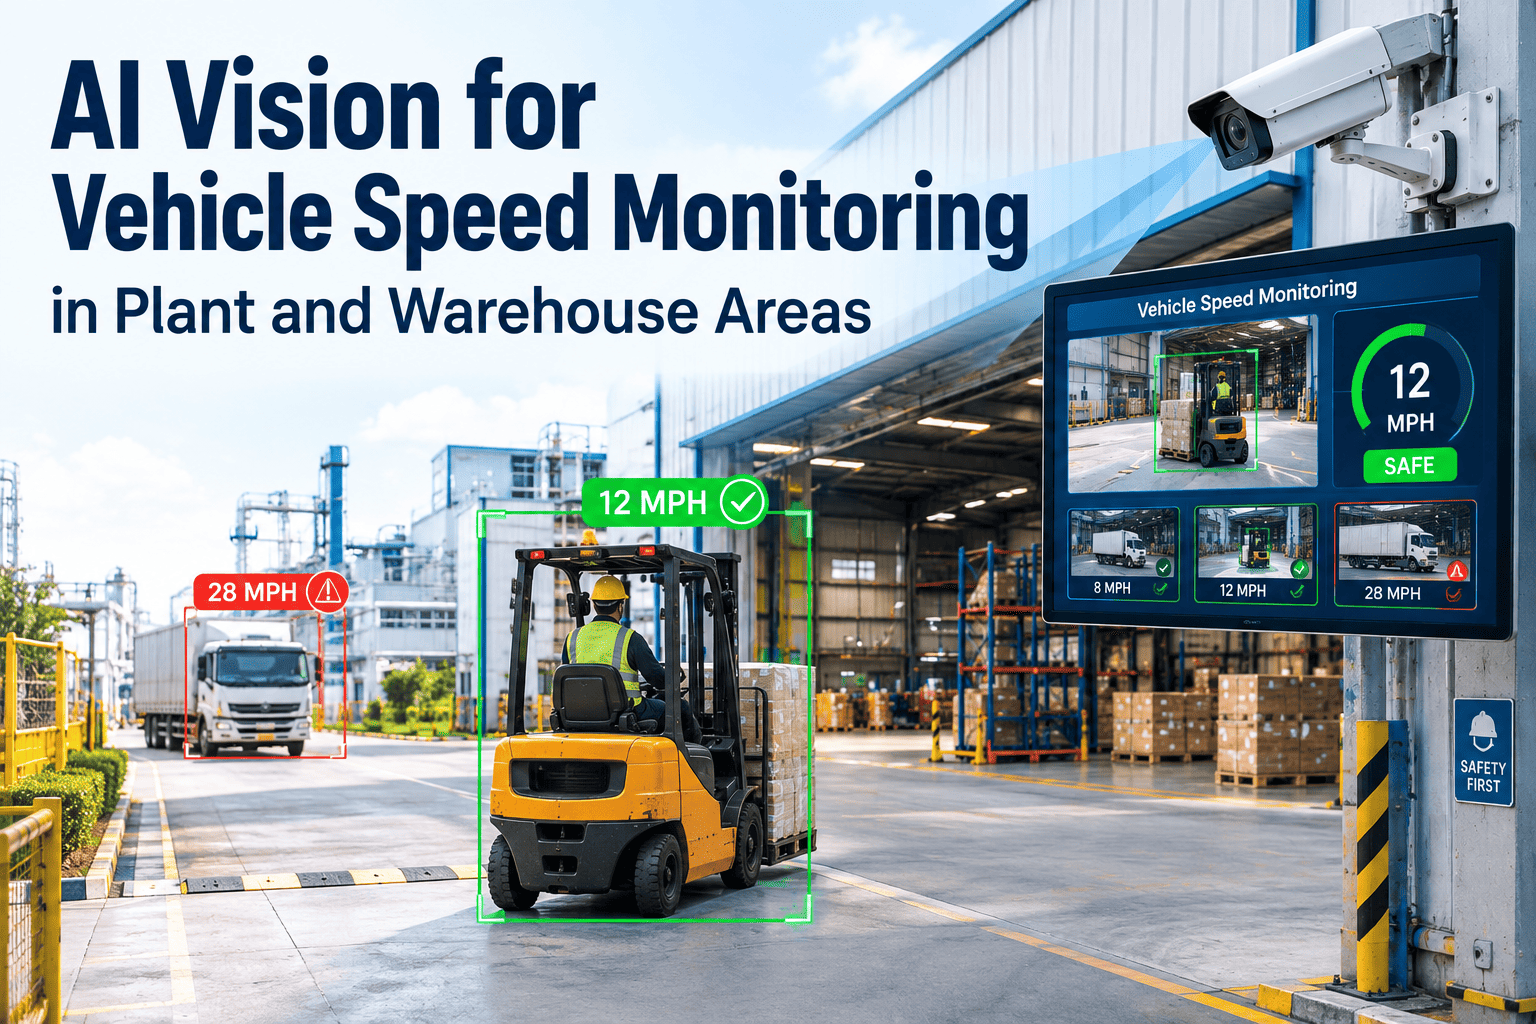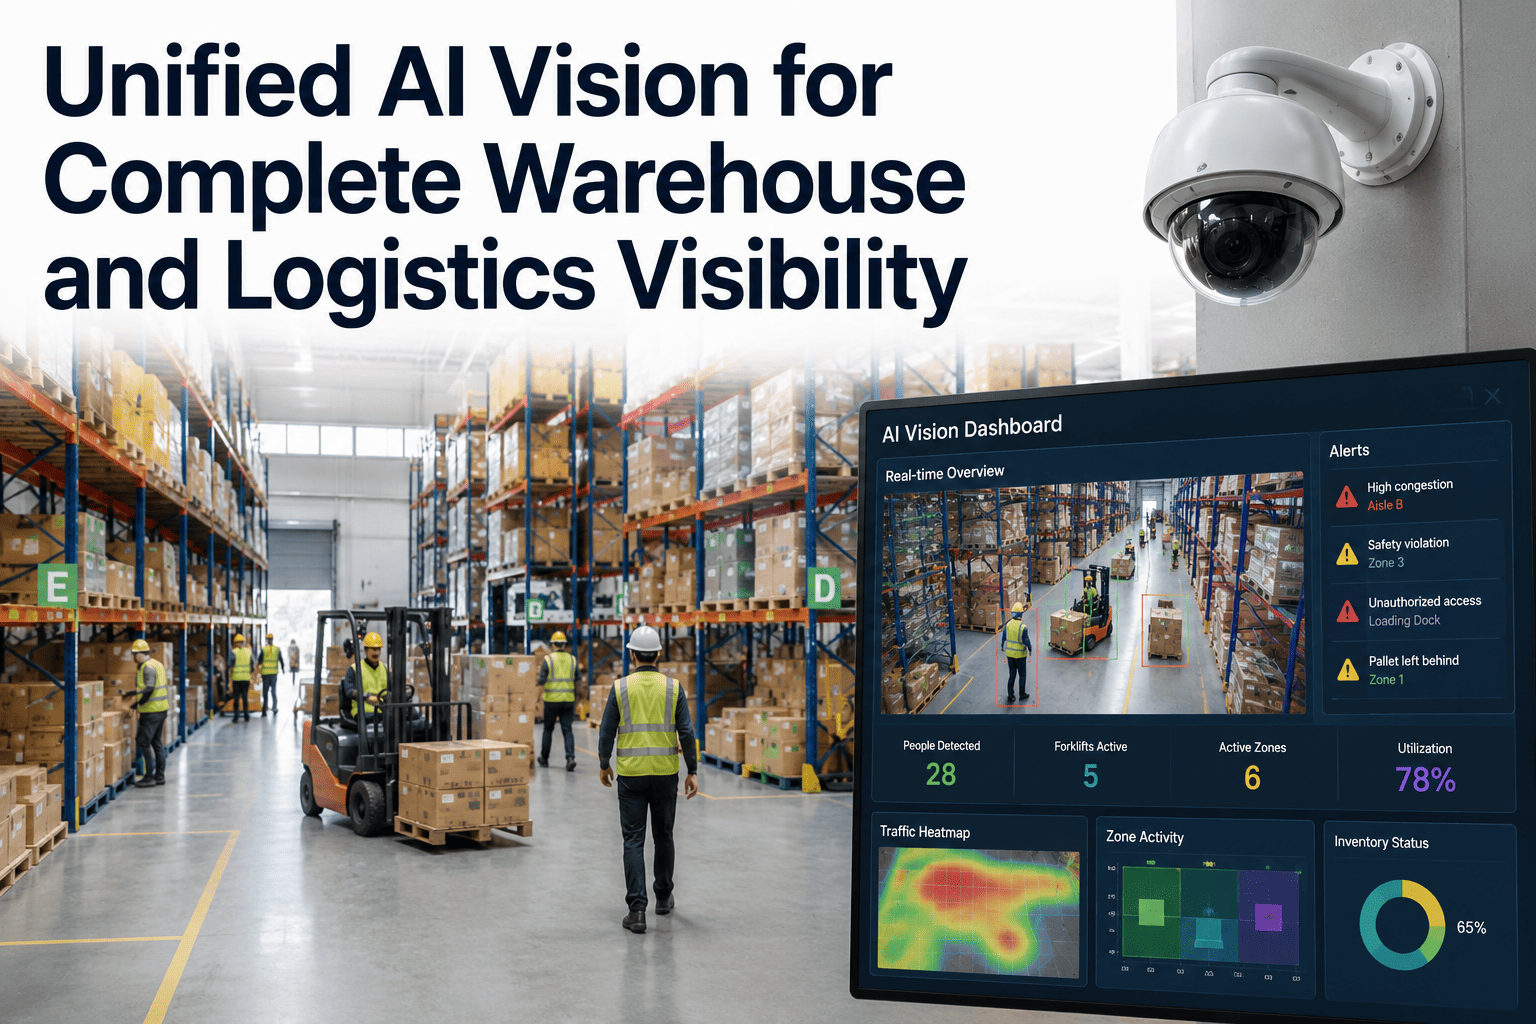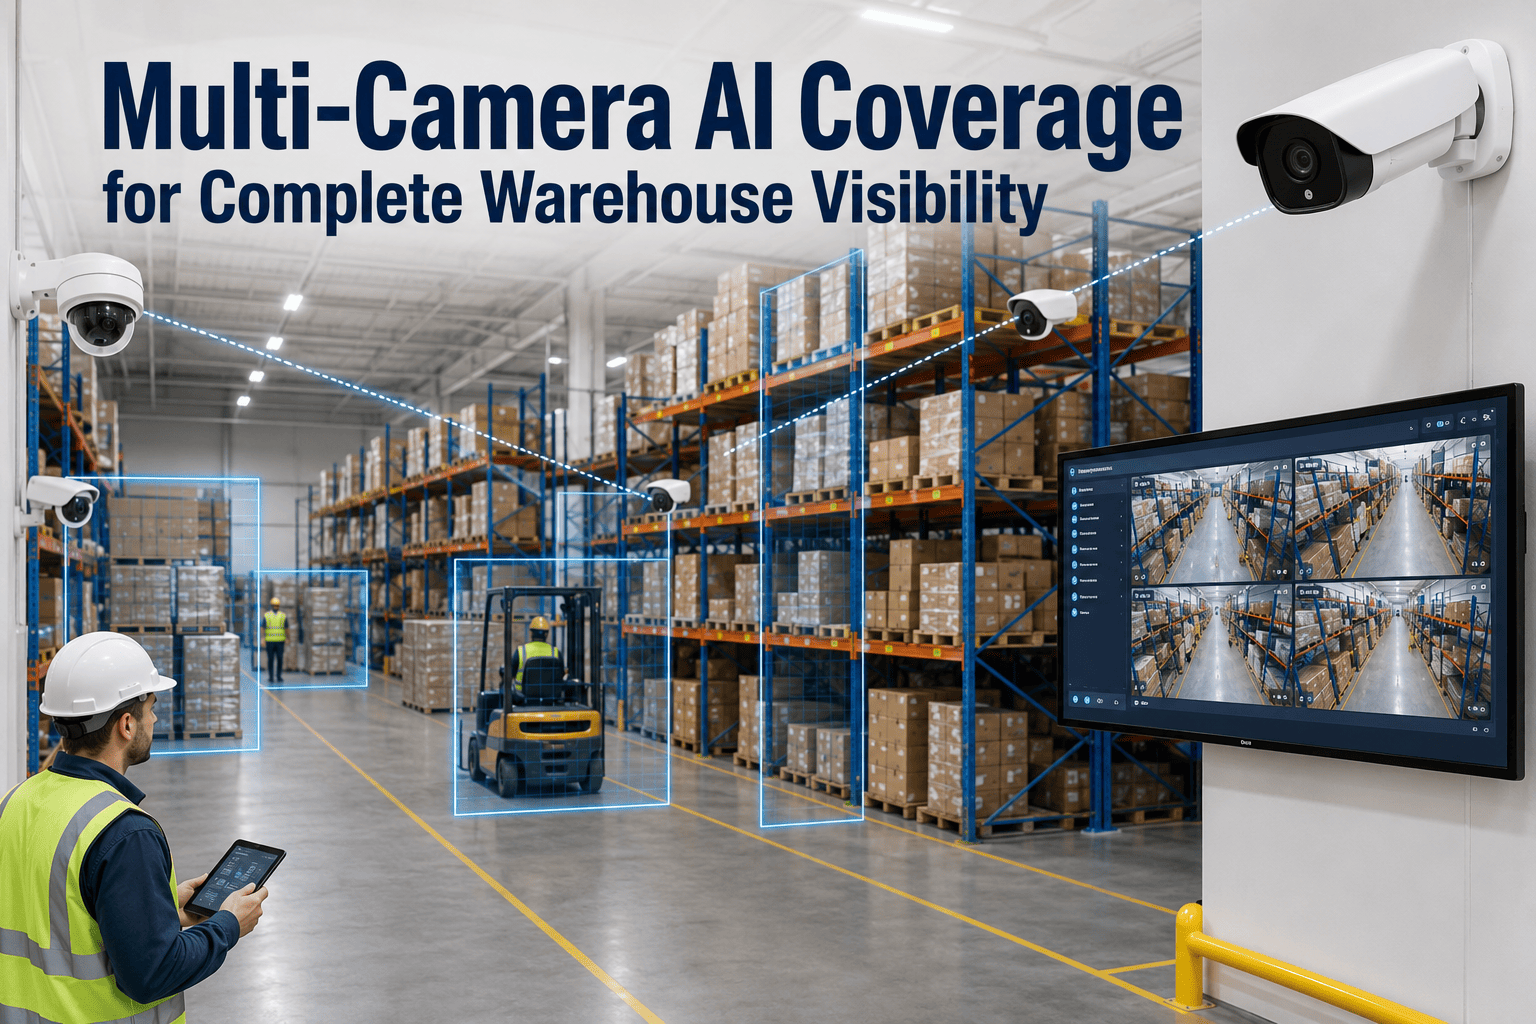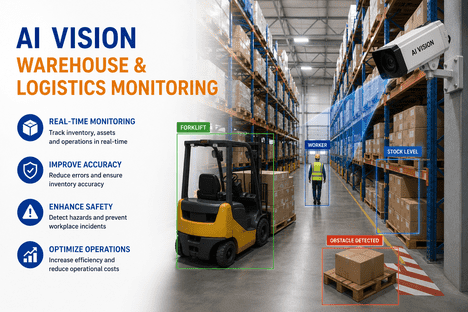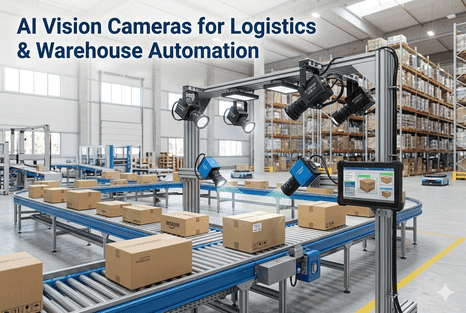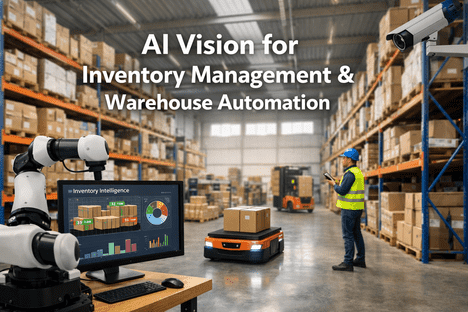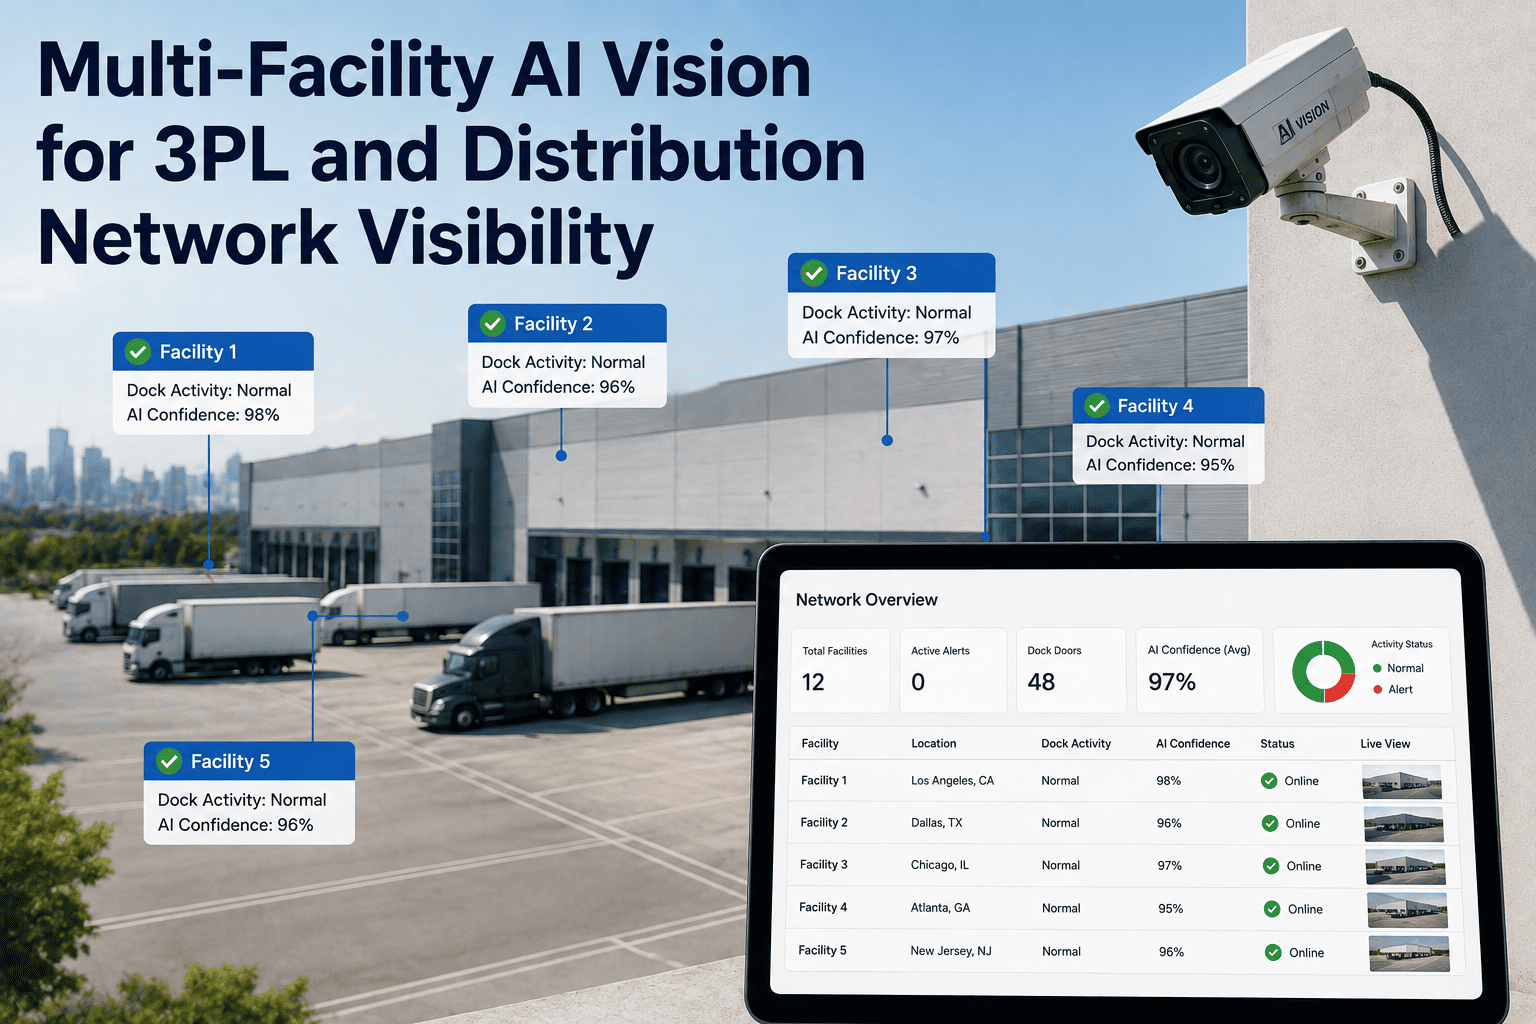
Running one distribution center on AI vision is a facility-level story about accuracy and safety. Running fifty of them raises an entirely different question: which sites are actually performing, which are quietly slipping, and where should the next round of process improvement budget go. Most 3PL and distribution networks answer that question with a patchwork of site-level reports that never quite line up on the same metrics, making a true cross-facility comparison a manual, spreadsheet-heavy exercise every single quarter. A single portfolio dashboard fed by AI vision at every site changes that, and our logistics intelligence team can show you what network-wide visibility looks like once every facility reports on the same terms.
One Dashboard, Every Facility, Same Metrics
Whether a network runs five distribution centers or five hundred, the core operating question is the same: which sites are performing above network average, which are trending down, and where is the next investment in process or training best spent. A shared AI vision layer across every facility answers that question with directly comparable data instead of reconciled spreadsheets.
Why Network Visibility Breaks Down at Scale
A single facility can usually answer basic operational questions with the tools already in place: how many orders shipped accurately, how many safety incidents occurred, how throughput compares to last week. The difficulty starts when a network operator tries to ask the same question across many facilities at once, because each site frequently tracks these metrics slightly differently, on different reporting cadences, with different definitions of what counts as an exception or an incident. What looks like a straightforward comparison question becomes a data reconciliation project before any actual analysis can happen, and by the time the comparison is ready, the underlying operating conditions at each site have often already moved on.
What a Portfolio Dashboard Actually Tracks
Site-Level Reporting Versus a Shared Portfolio View
| Question | Site-Level Reporting | Shared Portfolio Dashboard |
|---|---|---|
| Which facility has the best pick accuracy this month? | Requires collecting and reconciling separate reports from each site | Visible directly, ranked against the same accuracy definition network-wide |
| Is a specific site's safety trend improving or declining? | Depends on that site's own historical reporting consistency | Tracked continuously against a standardized incident definition |
| Where should the next process improvement investment go? | A judgment call based on incomplete or lagging comparisons | Directed by facilities showing the clearest measurable underperformance |
| How current is the data behind a network-level decision? | Often several weeks old by the time reports are compiled | Reflects near-continuous operating conditions across the network |
From Site Cameras to a Network-Level Decision
The value of this approach compounds as a network grows. A five-facility operation can often manage with informal comparison and occasional site visits, but a fifty- or five-hundred-facility network loses that option entirely, since no single operator can hold that many sites' current performance in their head or reconstruct it accurately from inconsistent reports. A standardized dashboard becomes less of a convenience and more of an operational necessity past a certain network size.
What Network Operators Actually Do With This Visibility
Why the Reporting Gap Widens as a Network Grows
A network operator managing five facilities can often compensate for inconsistent reporting through sheer familiarity, visiting each site regularly enough and knowing each site manager well enough to sense-check the numbers that come in. That informal compensation breaks down entirely once a network reaches dozens or hundreds of facilities, since no operator can maintain that level of personal familiarity across a portfolio that large, and the inconsistencies that were merely an annoyance at five sites become a genuine blind spot at fifty. A facility quietly underperforming on pick accuracy or trending toward a safety problem can go unnoticed for months if its self-reported numbers happen to look acceptable on paper, simply because no one at the network level has the bandwidth to dig into whether that facility's definition of an accurate pick actually matches the definition used elsewhere in the network.
This is the core reason standardized, camera-verified metrics become more valuable, not less, as a network scales. The facilities most likely to benefit from early intervention are often the ones furthest from network leadership's direct attention, and a shared dashboard is what surfaces those facilities without requiring a site visit or a manual audit to find them.
Managing the Change at the Site Level
Rolling out standardized metrics across an existing network inevitably changes how individual site managers are measured, and that shift is worth managing deliberately rather than treating as a purely technical deployment. A site manager who has spent years reporting metrics under a locally defined standard may initially see a new, network-wide definition as a threat, particularly if the new standard reveals performance gaps that a looser local definition had been masking. Framing the rollout around identifying opportunities for support and process improvement, rather than purely as a performance audit, tends to produce far better site-level buy-in than a rollout framed primarily around accountability. Sites that see early wins, whether through catching a genuine safety issue before it escalated or through recognition for strong measured performance under the new standard, tend to become the strongest internal advocates for expanding the rollout to the rest of the network.
Frequently Asked Questions
See Your Whole Network on One Standard
Share your current facility count and reporting setup. We'll show you what a standardized portfolio dashboard would surface across your network today.