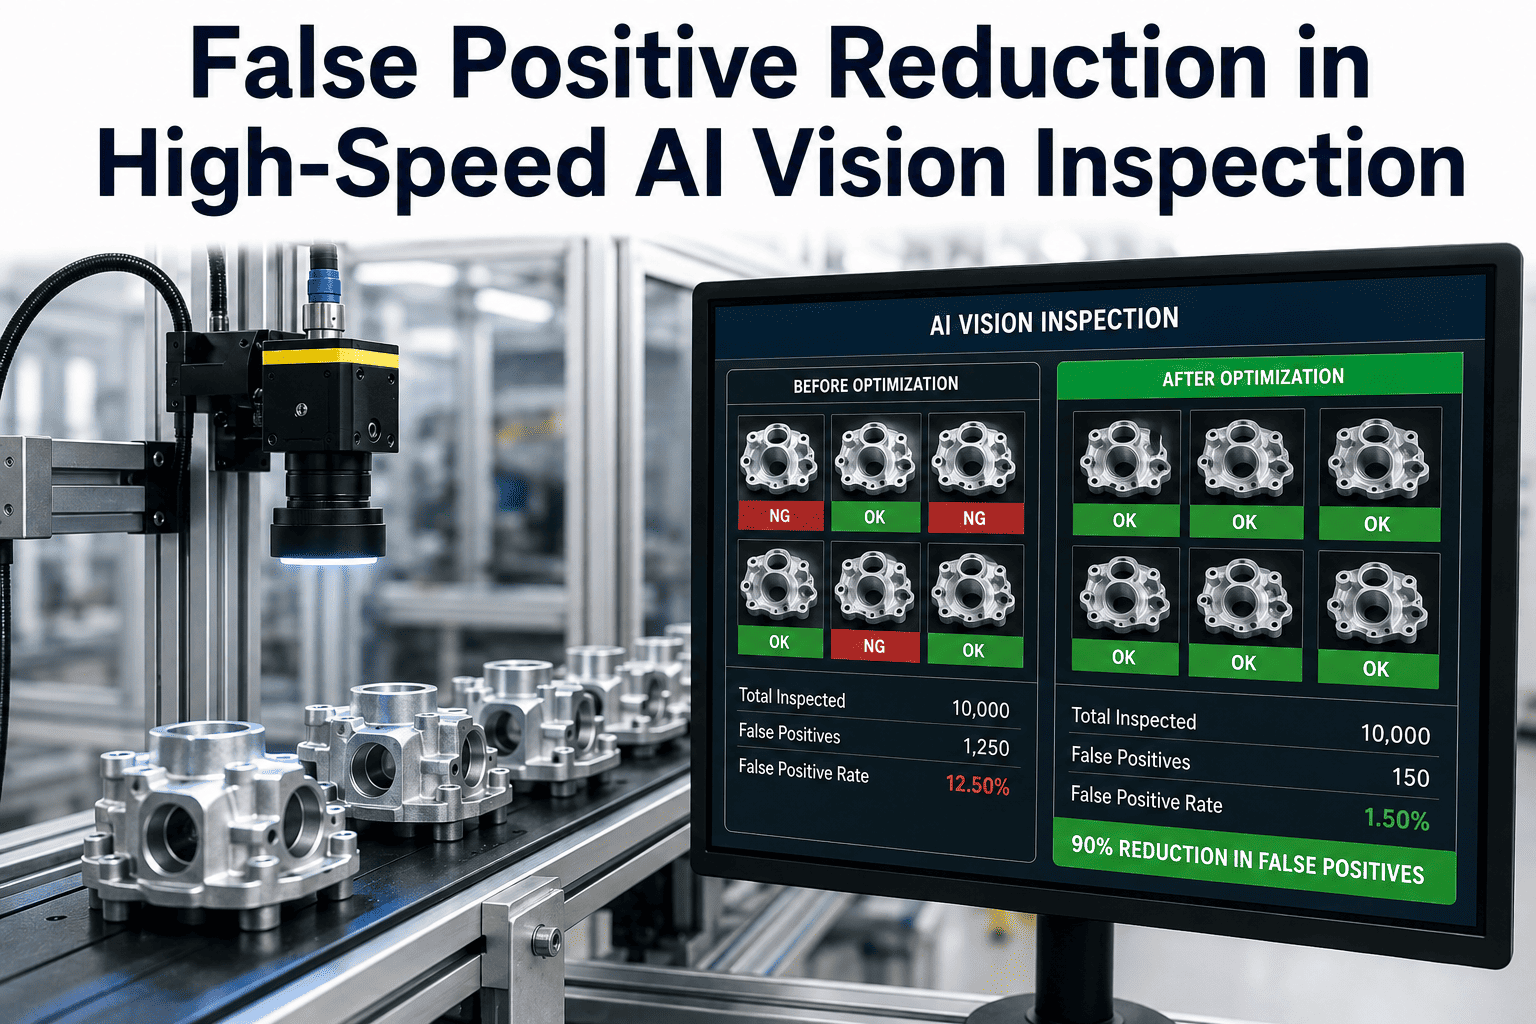
AI vision systems degrade silently. Accuracy drops one percent a month, false positives creep upward, one edge server falls two firmware versions behind, and by the time production reports a missed defect, the drift has been running six weeks. The defence is a disciplined weekly review that turns silent degradation into a numbered problem with an owner and a threshold. This checklist walks the MLOps lead, quality manager, and platform ops team through 40 metric-based checks across eight KPI dimensions — every check with an explicit target. Run it every Monday morning. To walk it against your live deployment, Book a Demo.
Review 1 of 8
Owner: MLOps Lead
Detection Accuracy and F1 Score Review
W1.1
Target ≥95%
Weekly rolling detection accuracy across all defect classes
Pull last-7-day accuracy from the labelled review sample. Any class below 95% opens an MLOps coaching ticket within 24 hours.
W1.2
Target ≥0.92
F1 score per defect class trended weekly
F1 balances precision and recall — accuracy alone hides imbalance. Any class F1 below 0.92 is flagged for confusion-matrix drill-down.
W1.3
Target 100%
Confusion matrix reviewed for every active class
Confusion matrix reveals class swaps. Missing entries mean the model has not seen that defect this week — critical for rare-defect classes.
W1.4
Target <1%
Week-over-week accuracy delta stays inside noise band
A single-week drop over 1% is the earliest drift signal. Two consecutive weeks triggers the drift investigation in Review 6.
W1.5
Target ≥200
Sample size for accuracy measurement is statistically meaningful
Fewer than 200 labelled samples per class weekly means accuracy is noise. Escalate under-sampled classes to the labelling team.
Review 2 of 8
Owner: Quality Lead
False Positive Rate Analysis
W2.1
Target <3%
Weekly false-positive rate across the deployment
Every FP is a shift-supervisor interruption. Above 3% erodes team trust within two weeks — non-negotiable ceiling.
W2.2
Target <5%
Per-zone false-positive rate reviewed
A single zone above 5% signals lighting change, camera drift, or occlusion. Site walk within 48 hours before retuning thresholds.
W2.3
Top 5
Top five false-positive patterns identified with root cause tag
Group the week's FPs by pattern — same asset, time of day, or lighting. Root-cause tag drives coaching or retraining.
W2.4
Target 100%
Every FP tagged by the closing technician on the CMMS record
False-positive flag on closure must sync back to the vision platform for retraining. Missing tags block the tuning batch.
W2.5
Trend ↓
4-week rolling FP trend heading downward
A stable FP rate is not enough — mature systems trend downward as thresholds tune. Flat or upward triggers investigation.
Two Reviews In, Six To Go — Want an Engineer on the Weekly Call?
The remaining reviews cover missed defects, latency, camera health, drift, alert response, and sign-off — the checks that catch silent degradation before production reports it. An iFactory engineer walks this against your live deployment in a 30-minute session. Book a Demo.
Review 3 of 8
Owner: Quality Lead
Missed Defect (False Negative) Investigation
W3.1
Target <2%
Weekly false-negative rate against ground-truth sample
A missed defect is worse than a false positive — it becomes a production escape. Ground-truth sampling of 100 items per class weekly is minimum.
W3.2
Target 0
Zero missed defects on critical-severity classes
Emergency and high-severity classes clear the week with zero misses. Any miss triggers a same-week model review and root-cause report.
W3.3
Target ≥95%
Field-reported defects cross-checked against detection log
Every defect reported by an operator or technician cross-checked against the vision log. Below 95% means blind spots or model gaps.
W3.4
Root cause
Every missed defect classified by root cause
Blind spot, low confidence, unknown class, or occlusion — each drives a different action: repositioning, threshold, or retraining.
W3.5
Target 48 hr
Missed defect samples fed into the training queue within 48 hours
Every miss becomes a training sample. Ingestion faster than 48 hours keeps the model current with real-world drift.
Review 4 of 8
Owner: Platform Ops
Processing Latency and Throughput
W4.1
Target <200 ms
Median inference latency per camera
Per-camera median measured over the week. Any camera exceeding 200 ms is overloaded or hitting a network bottleneck — investigate before next Monday.
W4.2
Target <500 ms
P95 inference latency across the deployment
The tail matters. 180 ms median with 900 ms P95 means occasional dropped frames and missed detections at peak load.
W4.3
Target ≥15 fps
Sustained frame rate per active camera
Sustained frame rate below 15 fps means the camera is effectively offline for high-speed events like arcing and forklift movement.
W4.4
Target <70%
GPU utilisation on edge inference servers
Sustained GPU above 70% means the node is under-sized for camera count. Add capacity next quarter.
W4.5
Target 0
Zero dropped inference batches in the week
Every dropped batch is a potential missed defect. Zero-drop is the target — non-zero triggers a capacity review same day.
Review 5 of 8
Owner: IT/OT Lead
Camera and Edge Compute Health
W5.1
Target ≥99.5%
Per-camera uptime across the week
Every camera reports weekly uptime. Below 99.5% triggers a hardware or network investigation — offline cameras are blind spots.
W5.2
Target 0
Zero unpatched security advisories on cameras or edge servers
Vision infrastructure sits on the OT network. Any unpatched CVE with public exploit is an incident waiting to happen — patch weekly.
W5.3
Target <35 °C
Edge server GPU temperature within thermal envelope
Sustained GPU temp above 35°C ambient in-rack accelerates hardware failure. Airflow and rack ventilation reviewed on any spike.
W5.4
Target 100%
Camera focus and calibration validated on a sample of 20% of cameras
Rotate through the fleet quarterly. Focus drift and lens contamination are the top physical failure modes and invisible to accuracy metrics.
W5.5
Target 100%
Firmware and inference-runtime versions inventory audited
Version drift is the source of silent behaviour differences. Every camera and edge server on the approved version — no exceptions.
Review 6 of 8
Owner: MLOps Lead
Model Drift Indicators
W6.1
Target <0.10
PSI (Population Stability Index) on input distribution
PSI below 0.10 stable, 0.10-0.25 moderate, above 0.25 significant drift needing retraining. Track weekly per feature.
W6.2
Target <0.05
KS-test p-value on prediction confidence distribution
KS test compares this week's confidence distribution to the training baseline. Statistical drift catches concept drift before accuracy tanks.
W6.3
Target ≥93%
Weekly A/B test between production and shadow model
Shadow model on the same traffic reveals whether the candidate learned this week's drift. Promotion decided on 4-week rolling average.
W6.4
Runbook
Drift alerts have documented runbooks
Every drift alert triggers a documented response, not on-call improvisation. Missing runbooks are the top reason drift alerts get silenced.
W6.5
Quarterly
Thresholds themselves reviewed for drift
Thresholds set at launch drift as much as the model. Quarterly threshold review scheduled on the calendar and logged weekly.
Sites running this 40-check review catch drift 6-8 weeks earlier than sites relying on incident reporting — cutting recurring incident cost by $180,000 annually.
6-8 wk
Earlier drift detection vs incident-triggered review
$180K
Annual recurring-incident cost avoidance
60 min
Weekly execution — every Monday morning
Review 7 of 8
Owner: EHS Lead
Alert Response Time Audit
W7.1
Target <60 s
Median detection-to-alert-dispatch time
From detection confirmed to responder push. Above 60 seconds median means an integration bottleneck — investigate before next shift.
W7.2
Target <5 min
Median responder acknowledgement time
Median acknowledge above 5 minutes signals mis-routed alerts or unaware responders. Route audit and coaching this week.
W7.3
Target ≥95%
First-tier acknowledgement rate
95% of alerts should acknowledge at Tier 1 before escalation. Below that, alerts are miscategorised or the responder rota is broken.
W7.4
Target <5%
Escalation-to-Tier-3 rate
More than 5% reaching the EHS lead means Tier 1-2 are broken or severity classification is over-triggering. Investigate.
W7.5
Target ≥94%
Work order first-visit closure rate
If techs close AI orders first-visit less than 94% of the time, they lack context — check annotation attachment.
Review 8 of 8
Owner: Program Owner
Weekly Sign-Off and Escalation
W8.1
Target 100%
Every check completed with a named owner
No check unowned or unrun. Missing sign-off flags red on the weekly report — program owner reviews before Monday close.
W8.2
Target 100%
Every red or amber finding has an assigned action and owner
A finding without an action rots in the log. Every non-green finding gets a tracked action with owner and target date before review closes.
W8.3
Target <2 wk
Open findings from prior weeks closed within 2 weeks
Ageing findings signal program discipline slipping. Two-week ceiling on open items — older items escalate to plant leadership review.
W8.4
Monthly
Monthly rollup for plant leadership
Four weekly reports aggregate into a monthly rollup showing KPI trends. Leadership sees one page, not 40 checks.
W8.5
Archived
Every weekly review archived with evidence and sign-off
Reports archived to shared drive with snapshots and screenshots. Auditors and insurance underwriters need the trail — retention aligned to policy.
40 Checks. 8 Dimensions. 60 Minutes Every Monday.
iFactory ships a pre-built weekly review dashboard that auto-populates every metric from your vision deployment — with target thresholds, week-over-week trends, and one-tap mobile sign-off. The check runs itself; you review the exceptions.
Auto-populated weekly dashboard from your deployment
Target-threshold traffic-light view on 40 metrics
One-tap sign-off with evidence archive
Monthly rollup for plant leadership
Frequently Asked Questions
Why weekly and not monthly or quarterly?
Model drift, sensor drift, and lighting drift accumulate at weekly timescales, not monthly. Waiting a month to catch a 3% accuracy drop means production ran four weeks of degraded detection before anyone knew. A 60-minute weekly review catches drift 6-8 weeks earlier than incident-triggered review, with compounding cost avoidance in six figures per year per site. For a walkthrough on your live deployment, Book a Demo.
Do we need a data scientist to run this review?
No. The heavy statistical work — PSI, KS test, F1 score, confusion matrix — is computed automatically and rendered as pass or fail against thresholds. The reviewer looks at green, amber, and red badges and drills into red items. Review 6 (model drift) benefits from a data scientist for root cause when drift fires, but a maintenance engineer or quality lead runs the weekly review itself. For a demo of the auto-populated dashboard, Book a Demo.
What is the fastest failure this review typically catches?
W5.1 — per-camera uptime — is the most-frequent red-flag firer. A camera that dropped offline Wednesday and no one noticed appears in Monday's review as a hard number, not an incident report. Second-most-common is W4.3 (frame rate below 15 fps) which usually signals OT-segment congestion. Both are fixable inside a day once seen. For a review of your current health dashboard, contact our engineering team.
How is drift distinguished from normal weekly variation?
Single-week accuracy drops under 1% sit inside the noise band and are logged but not actioned. Two consecutive weeks of drop, a PSI above 0.10, or a KS p-value below 0.05 all indicate drift beyond noise — and trigger a documented runbook in Review 6. This distinction is why the review works — everyone sees when a genuine signal breaks the noise floor. For engineering detail on the statistics, contact our engineering team.
Can the review be automated so we do not have to run it manually?
Yes — most items automate. The platform auto-computes every metric, applies thresholds, and generates the weekly report with green, amber, and red badges. What does not automate is the human decision on amber and red findings — the 30-60 minute Monday meeting still happens to assign actions and owners. The value is the disciplined weekly rhythm, not the manual maths. For a demo of the automated report, Book a Demo.