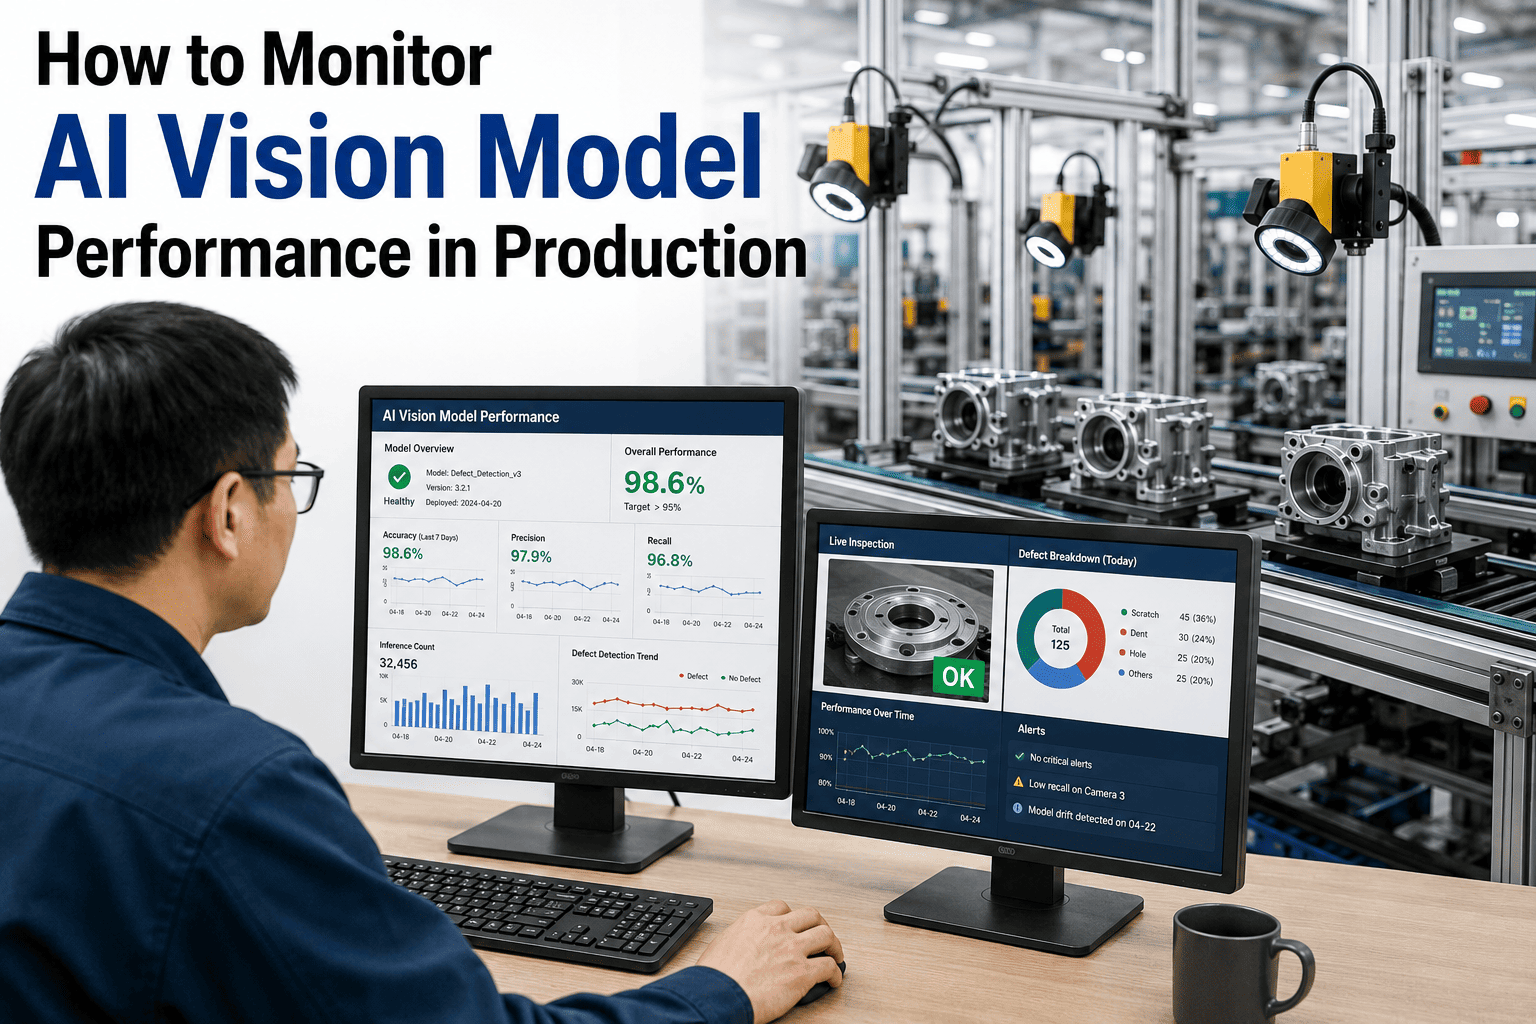
A vision model that scored 99% accuracy on installation day can quietly slide to 94% by week six — and nobody notices until a defect ships or a fault goes undetected, because the dashboard still shows green. This is model drift, and it rarely announces itself. Lighting shifts, lens fouling, a new product variant, or a camera nudged out of position during maintenance all degrade performance gradually enough to escape casual notice. Tuned systems on stable lines reach 99%+ accuracy with false positive rates under 2%, but that number only holds if someone is actually checking it every week. This checklist gives your team the seven-point review that catches drift before it costs a shift's worth of output. Book a demo to see this review automated inside iFactory's dashboard.
Drift compounds silently. A vision model degrading half a point of accuracy per week looks fine on any single day, but by the time a monthly review catches it, four weeks of missed defects or false rejections have already happened. Weekly review catches the trend line while it is still small enough to fix with a threshold adjustment rather than a full retrain.
Metric 1: Detection Accuracy Trend
Accuracy is not a single number to glance at — it is a trend line to watch. A model sitting at 97% today that was at 99% three weeks ago is already telling you something a snapshot view will never show.
Metric 2: False Positive Rate
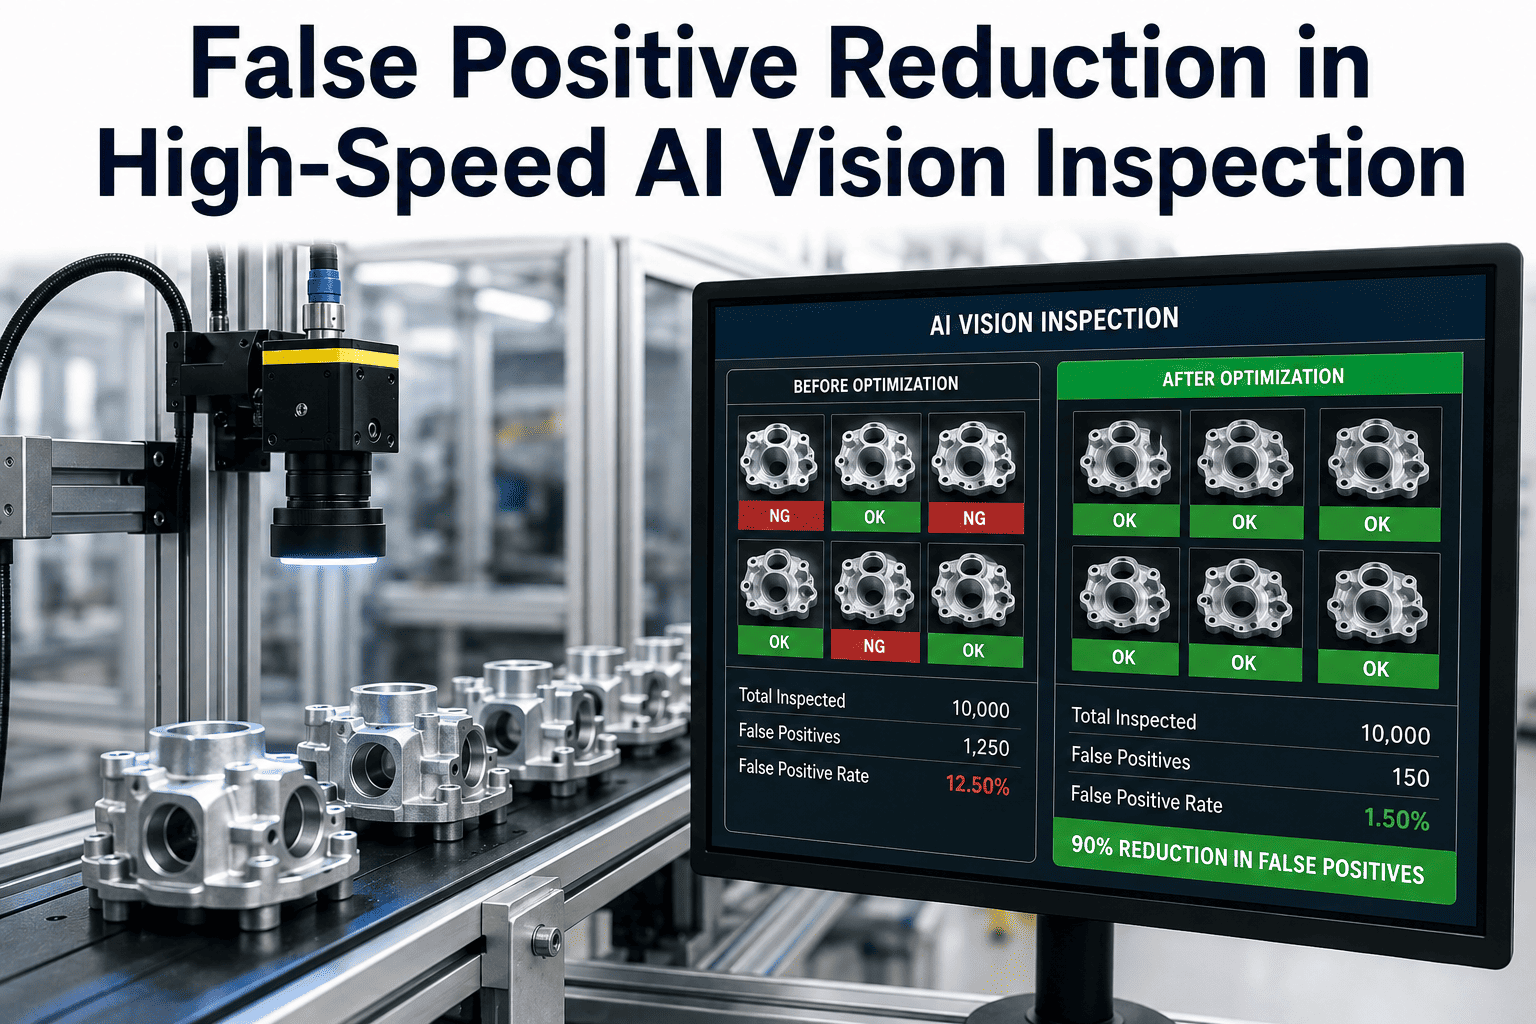
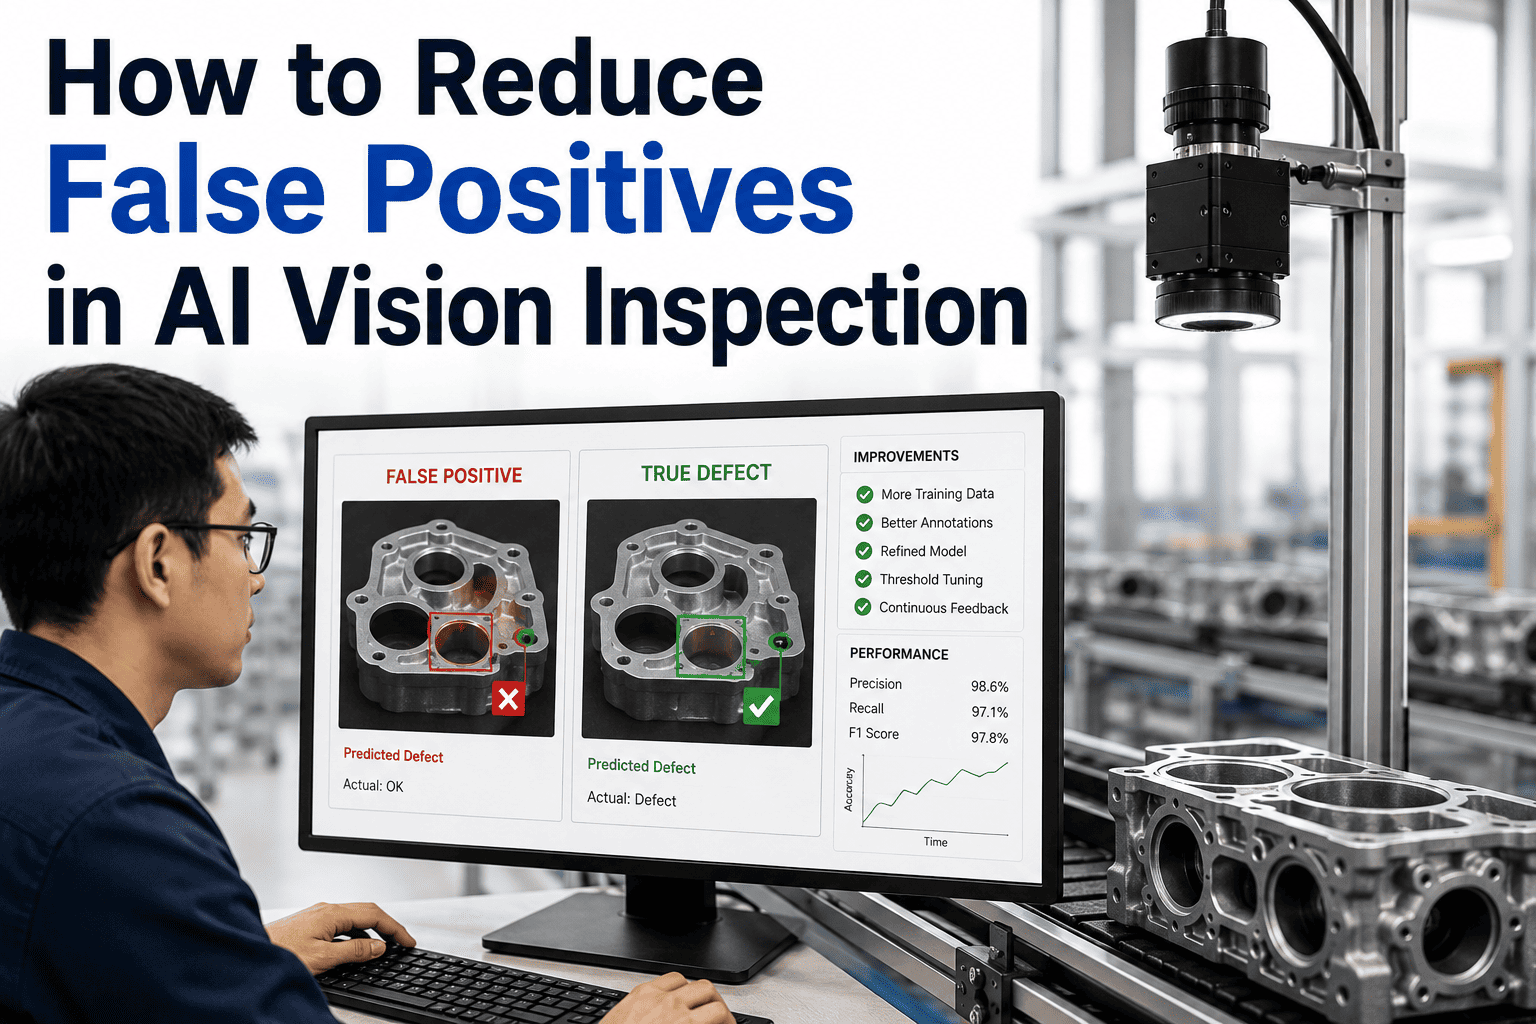
A false positive rate above 3 to 5 percent is the point where operators stop trusting the system and start overriding it — which quietly eliminates the entire quality control value the camera was installed to provide. Rising false positives before rising false negatives is often the earliest visible sign of drift.
Metric 3: Missed Defect Count
False negatives are more dangerous than false positives — a missed defect ships, and the last chance to catch it disappears the moment the part leaves the inspection station. This metric needs a feedback source, since the vision system itself cannot flag what it failed to see. Start free trial to see missed-defect feedback loops built into the platform.
Metric 4: Processing Latency
Latency creep rarely comes from the model itself — it usually signals edge hardware strain, a growing image queue, or a network bottleneck feeding the inference engine. Left unchecked, rising latency eventually forces inspection to sample fewer parts rather than run at full line speed.
Metric 5: Camera Health and Image Quality
The most capable model in your library delivers poor results if the imaging system feeding it produces inconsistent images. Lens fouling, drifting focus, and lighting degradation each individually look undetectable — but cumulatively they create an imaging environment that no longer matches what the model was trained on.
Model drift is often a calibration problem wearing a different name. Rising false positives that look like model degradation frequently trace back to lens geometry, lighting intensity, or trigger timing that shifted after commissioning. Checking camera health before assuming the model itself needs retraining saves weeks of unnecessary retraining cycles.
Metric 6: Model Drift Indicators
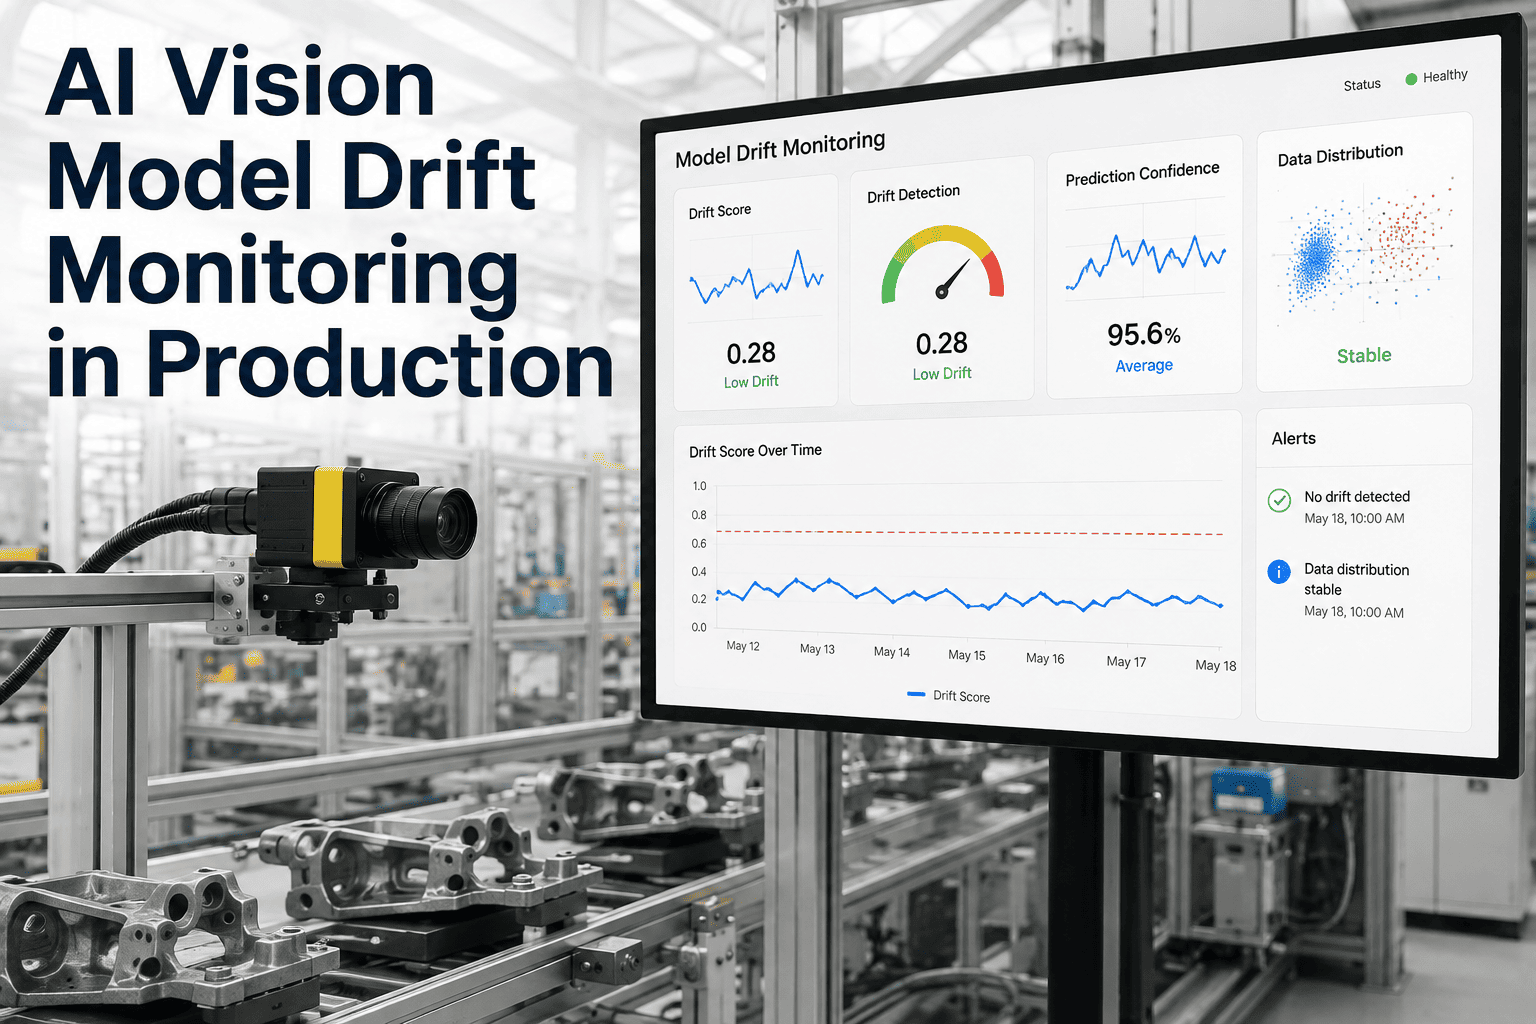
Drift shows up statistically before it shows up as an obvious accuracy drop. Watching the distribution of input images and confidence scores over time catches the shift while it is still a subtle signal rather than a production incident.
Metric 7: Alert Response Times
A perfectly accurate detection is worthless if nobody responds to the alert it generates. This metric closes the loop between what the vision system catches and what your team actually acts on within a reasonable window. Book a demo to see response time tracking built into the weekly dashboard.
Weekly Review Cadence: Time and Ownership
| Metric | Review Time | Owner | Critical Checks | Total Checks |
|---|---|---|---|---|
| 1. Accuracy Trend | 15 min | Quality Engineer | 2 | 4 |
| 2. False Positive Rate | 15 min | Quality Engineer | 2 | 4 |
| 3. Missed Defect Count | 20 min | Quality Manager | 2 | 4 |
| 4. Processing Latency | 10 min | Controls Engineer | 1 | 4 |
| 5. Camera Health | 20 min | Maintenance Tech | 2 | 4 |
| 6. Drift Indicators | 15 min | Data Science / Vendor | 2 | 4 |
| 7. Alert Response Times | 10 min | Maintenance Manager | 2 | 4 |
Stop Running This Review Manually Every Week
iFactory's dashboard tracks all seven metrics continuously and flags drift the moment a trend crosses threshold — accuracy, false positive rate, latency, camera health, and alert response times, all in one view instead of seven separate exports.
What Teams Report After Adopting This Weekly Cadence
Frequently Asked Questions
Catch Drift Before It Costs a Shift's Output
iFactory continuously monitors detection accuracy, false positive rate, latency, camera health, and drift indicators across every vision station, surfacing exactly what this checklist asks for automatically, every week, without the manual export.