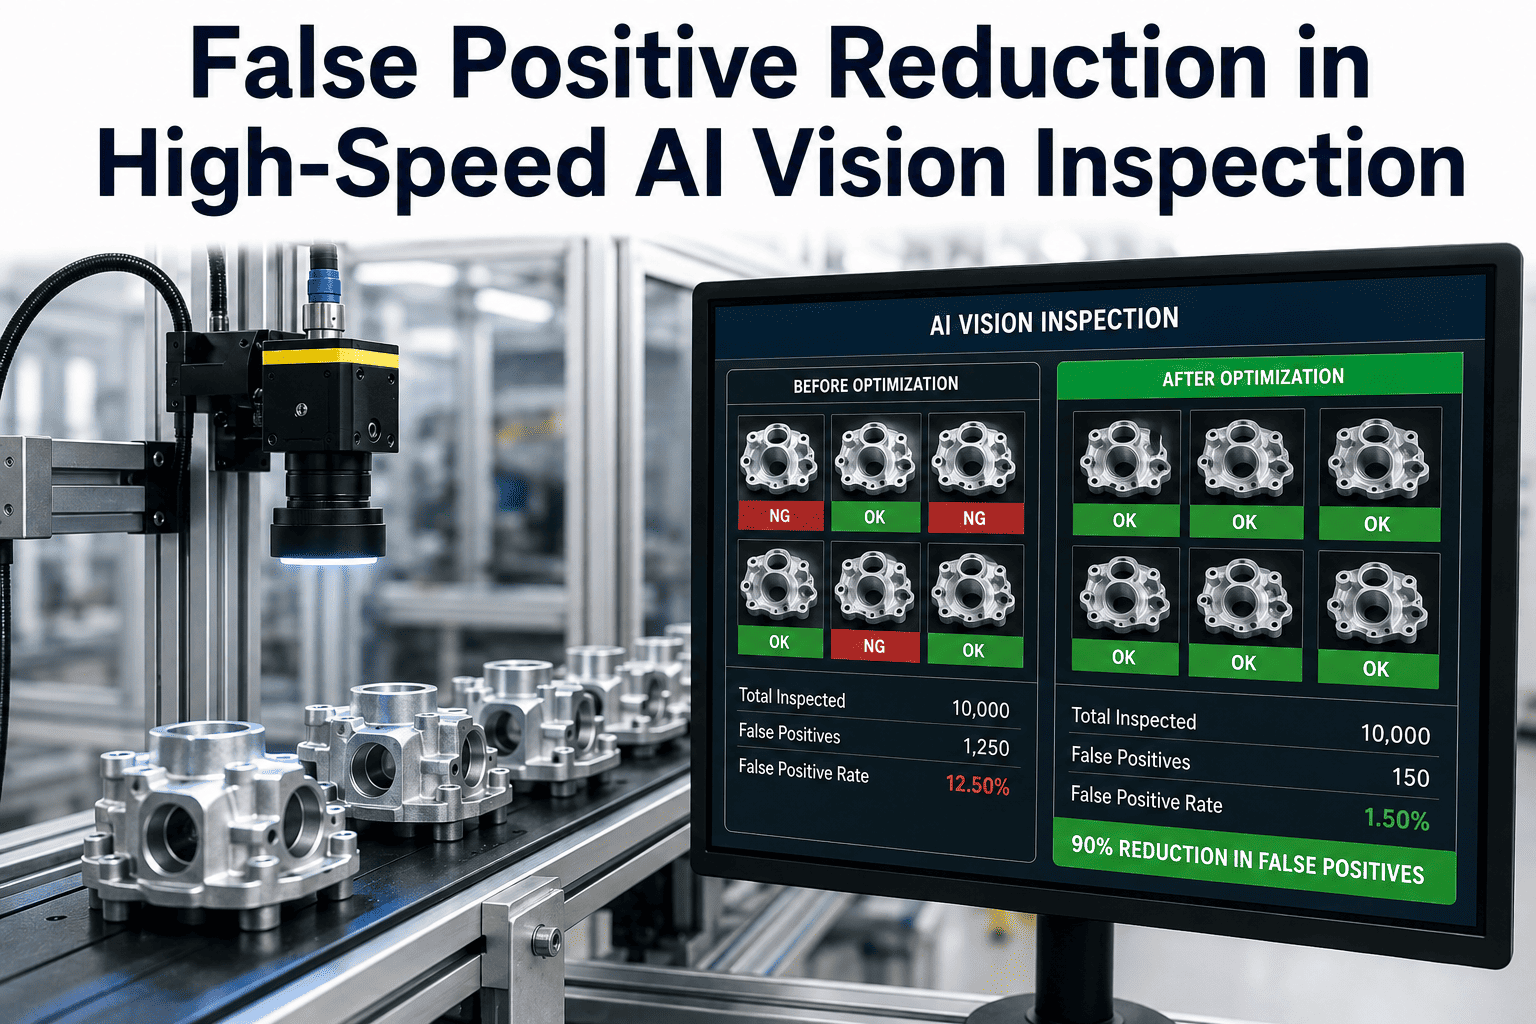
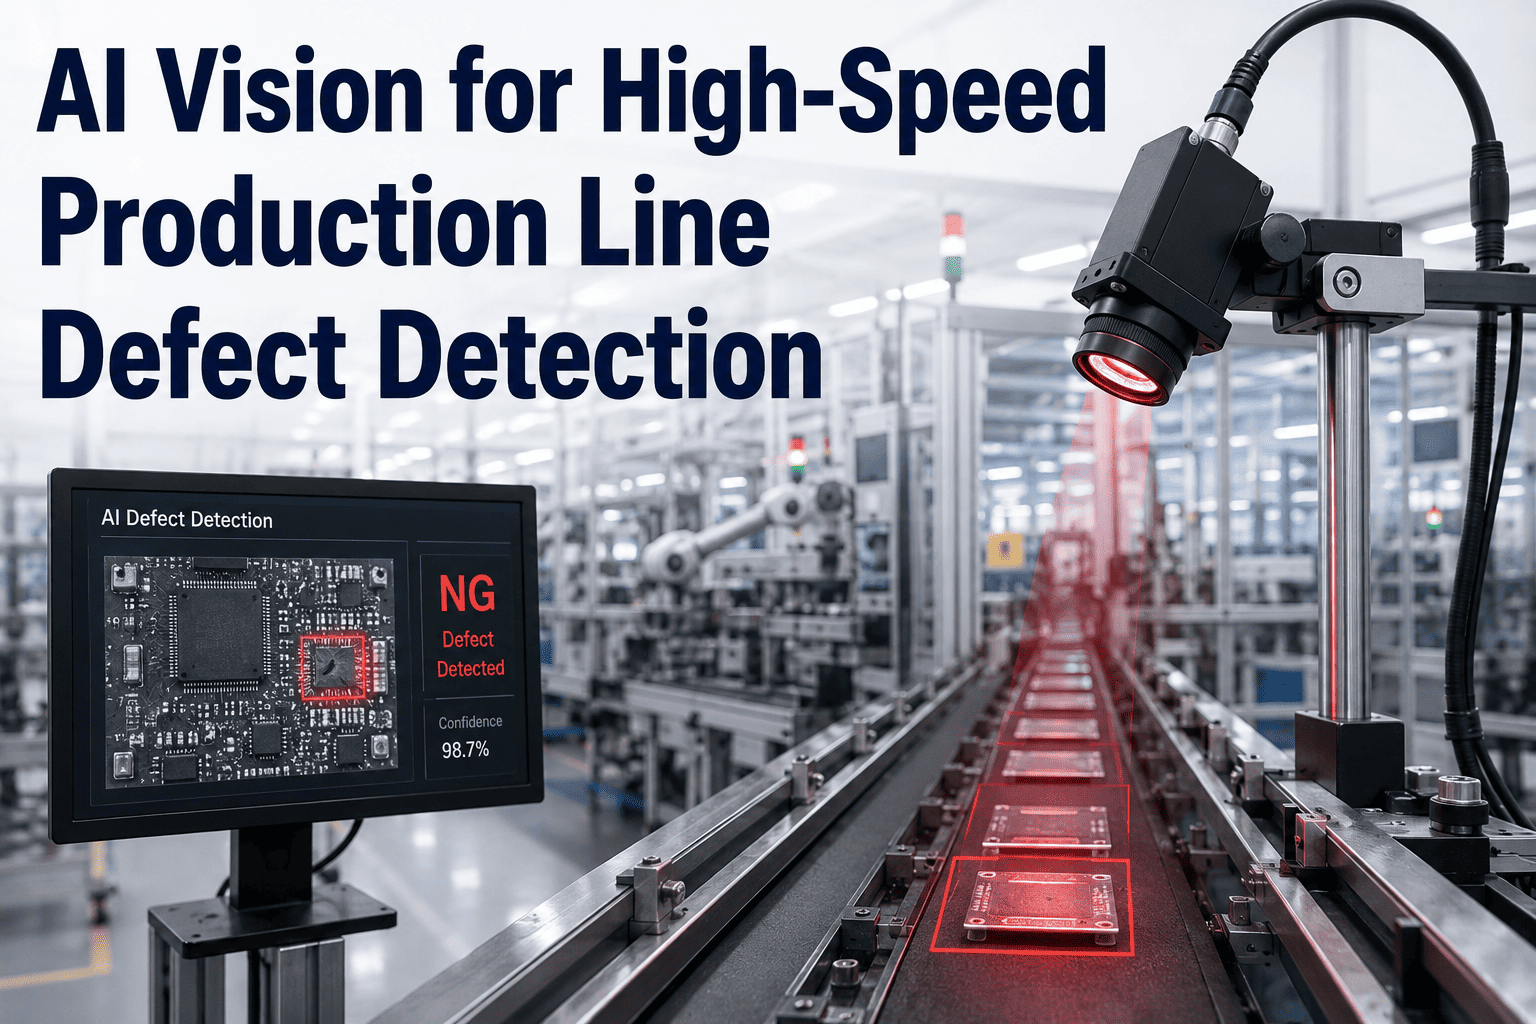
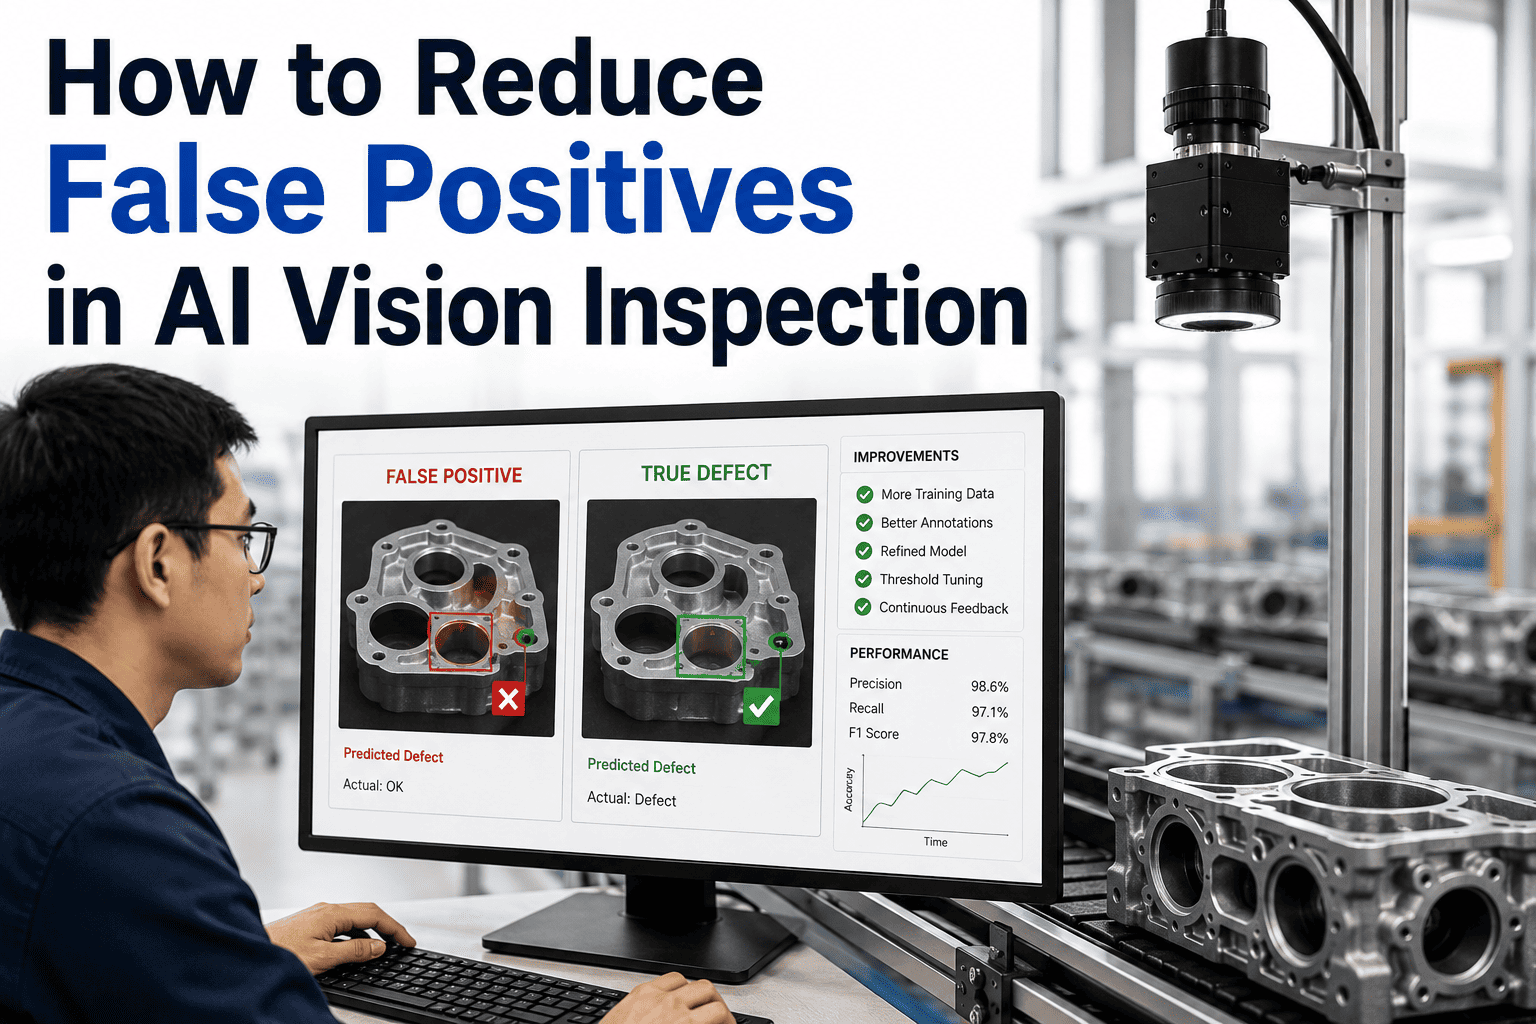
A false positive rate above three to five percent is the threshold at which production operators stop trusting an AI vision system — and when operators stop trusting it, they start overriding it. Overridden systems do not protect quality. The false positive problem in high-speed AI vision inspection is not a minor calibration inconvenience; it is the single most common reason AI inspection programs are abandoned or rolled back after deployment, regardless of how accurate the underlying model is on true defects. iFactory addresses false positive reduction through a layered methodology: confidence threshold calibration per defect class, multi-frame confirmation on borderline detections, hard negative mining during model retraining, and region-of-interest filtering that eliminates the systematic false detections caused by fixture reflections, part markings, and surface texture variation. The complete calibration process is documented at iFactory support.
AI Vision · False Positive Reduction · Accuracy Optimization
False Positive Reduction in High-Speed AI Vision Inspection
Multi-frame confirmation, hard negative mining, and per-class confidence threshold tuning reduce false positive rates below 1% — without loosening detection sensitivity on true defects. When operators trust the system, the system protects quality.
The Operator Trust Threshold
Above 5%
Operators override and bypass the system. AI provides zero quality protection.
2% – 5%
High reinspection labor. Operator frustration builds. System adoption at risk.
1% – 2%
Acceptable. Reinspection workload manageable. Operators generally trust results.
Below 1%
Target state. Full operator trust. Auto-reject enabled without reinspection overhead.
Source: iFactory deployment data 2026 · Averroes.ai False Positive Research 2026
The Real Cost of False Positives
False Positives Are Not a Nuisance — They Are an OEE Problem With a Calculable Cost
Every false positive carries three costs that most quality programs fail to account for together: the direct cost of reinspecting a good part, the indirect cost of the operator time that reinspection consumes, and the systemic cost of eroded system trust that eventually causes operators to disable or override the AI entirely. A plant running 10,000 parts per shift at a 5% false positive rate generates 500 good parts per shift being pulled for manual reinspection — labor that compounds daily.
375 min
Reinspection time per shift (6.25 hours of labor)
$175
Direct reinspection labor cost per shift
$63,875
Annual direct labor cost (5 days/week, 2 shifts)
$0
At below 1% false positive rate with iFactory calibration
Excludes: operator confidence degradation, system override behavior, OEE reduction from line holds on borderline parts, and downstream costs of defects that slip through when operators start ignoring AI alerts.
Root Cause Taxonomy
Where False Positives Actually Come From: Six Root Cause Categories
Most false positive reduction programs target confidence thresholds first — adjusting the number until the false positive rate drops to an acceptable level. That approach produces one of two outcomes: the threshold is raised high enough to eliminate false positives but also starts missing real defects, or the threshold is left too low and the false positive problem persists. Sustainable false positive reduction requires identifying and addressing each root cause category independently.
C1
Undertrained Acceptable Variation
Model Training Issue
The model has not seen enough examples of acceptable surface variation — natural gloss differences, resin lot changes, minor mold release residue — and classifies them as defects because they differ from the nominal training examples. This is the most common root cause of false positives in production deployments. Fix: augment training with examples of acceptable variation across the full production envelope.
C2
Fixture and Conveyor Reflections
Optical / Hardware Issue
Specular reflections from conveyor belt edges, fixture clamps, or part carriers appear consistently in the same image region and are classified as defects if the model was not trained to exclude them. These produce systematic false positives in a fixed location — always the same pixel region on every image. Fix: apply a region-of-interest mask that excludes the fixture zone, and add fixture reflection examples to training as non-defect class.
C3
Lighting Intensity Drift
Optical / Hardware Issue
LED illuminators degrade over time — light output decreases by 10 to 20% over 10,000 hours of operation. The model was calibrated on images at full LED brightness; as illumination decreases, image intensity drops, and intensity-based defect signals that were trained at a specific brightness level begin producing more false detections. Fix: implement lighting intensity monitoring with calibration triggers, and retrain or recalibrate when intensity drift exceeds 5%.
C4
Part Position Variation
Mechanical / Handling Issue
When a part presents to the inspection station at a position or orientation outside the calibration envelope, features that are correctly classified as non-defect at the nominal position produce ambiguous signals at the offset position. Edge features, part markings, and intentional surface texture shift in the image coordinate system and may fall in a defect-sensitive region of the model's field of view. Fix: improve part fixturing repeatability and expand position tolerance in the region-of-interest configuration.
C5
Single-Frame Decision on Ambiguous Image
Model / Architecture Issue
At high production speeds, occasional motion blur, vibration-induced focus shift, or timing jitter in the camera trigger produces a single degraded image that contains artefacts the model cannot reliably distinguish from real defects. The model returns a borderline-confidence detection that should not trigger an auto-reject but does because the threshold is applied uniformly. Fix: implement multi-frame confirmation for detections below a confidence band, requiring two or more consecutive frames to confirm before auto-reject fires.
C6
Uniform Threshold Across Defect Classes
Configuration Issue
Setting a single confidence threshold across all defect classes inflates false positive rates on the defect classes where the model naturally produces lower confidence scores — typically cosmetic or borderline defect classes where the visual difference from acceptable variation is small. A threshold tuned for a clear-cut crack defect is too low for a subtle gloss deviation. Fix: calibrate a separate confidence threshold per defect class based on the actual score distribution observed during production, not the distribution observed during validation.
A medical equipment manufacturer reduced false rejections from 12,000 per week to 246 — without changing their defect escape rate. The same methodology is available for your line.
iFactory's false positive reduction program diagnoses the root cause category for your specific inspection system and applies the correct technical fix — not a blanket threshold change that trades false positives for missed defects.
Reduction Methodology
Five Technical Methods That Drive False Positive Rates Below 1%
Each method below targets a specific mechanism of false positive generation. Deploying all five in sequence — rather than stopping at threshold adjustment — is what separates a production-stable inspection system from one that requires constant manual intervention to maintain acceptable false rejection rates.
Method 01
Per-Class Confidence Threshold Calibration
After an initial deployment period of one to two weeks, iFactory generates a confidence score distribution plot for every defect class — showing where true positive scores cluster and where false positive scores cluster. The auto-reject threshold for each class is set at the inflection point between the two distributions, which is rarely the same value across defect classes. A crack defect may have scores that cluster above 0.94 for true positives, while a cosmetic gloss deviation clusters above 0.82. Setting a uniform threshold of 0.90 misses gloss deviations and over-rejects on other classes simultaneously. Per-class calibration eliminates this mismatch.
Typical outcome: 40–60% reduction in false positive rate from calibration alone, with no change in true defect recall.
Method 02
Multi-Frame Confirmation for Borderline Detections
Detections that score within a configurable band above the reject threshold — typically 0.05 to 0.10 confidence points above the auto-reject threshold — are held pending confirmation from the next one or two inspection frames rather than immediately triggering an auto-reject. A genuine surface defect appears consistently across multiple frames as the part moves through the inspection zone. A false positive caused by vibration, motion blur, or a single degraded image does not reappear in the next frame. Multi-frame confirmation eliminates this category of false positive without adding significant latency at typical production speeds.
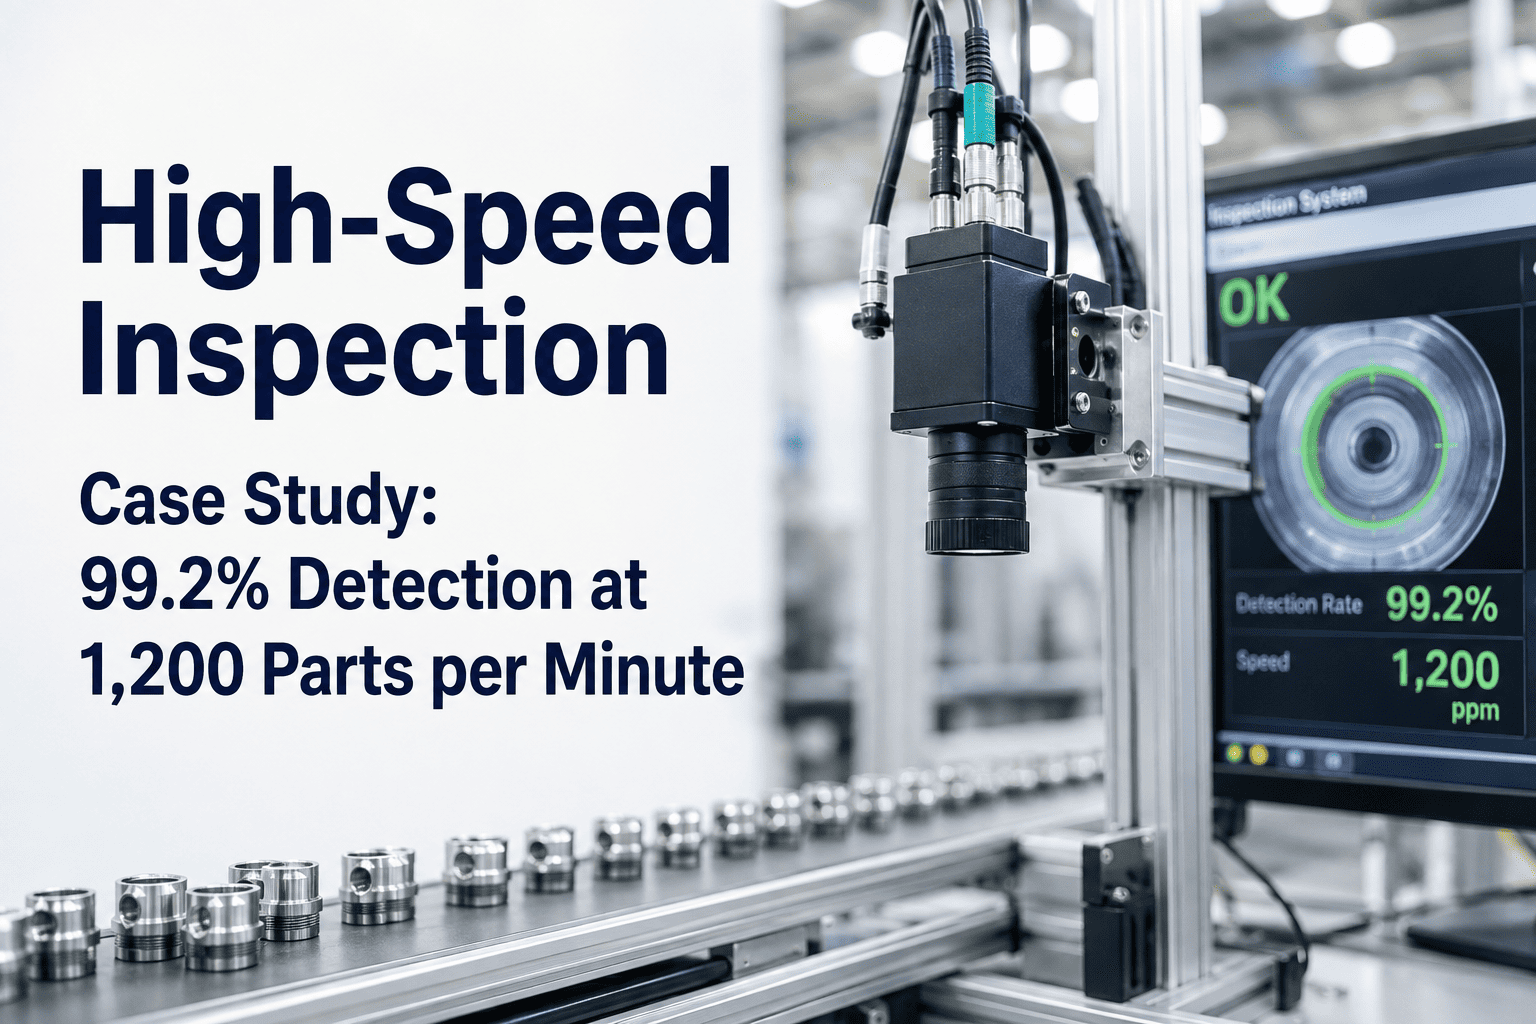
Typical outcome: Eliminates 60–80% of single-frame artefact false positives at speeds up to 350 parts per minute.
Method 03
Hard Negative Mining During Retraining
Standard model retraining adds new defect examples to the training set. Hard negative mining adds the other type of example the model needs: the near-misses — good parts or acceptable variations that the model incorrectly classified as defects with high confidence during production. These are the hardest cases for the model and the ones it learns most from. iFactory's retraining pipeline automatically identifies high-confidence false positives from the production log, queues them for operator label verification, and incorporates confirmed good-part examples into the next training cycle as hard negatives. Each retraining cycle systematically closes the confidence gap on the model's most problematic false positive patterns.
Typical outcome: 15–25% further false positive reduction per retraining cycle applied to hard negative examples.
Method 04
Region-of-Interest Masking
Systematic false positives that consistently appear in the same image location — fixture reflections, conveyor seams, part number stamps, parting line marks, and ejector pin witness marks — are eliminated by defining region-of-interest masks that exclude these zones from defect classification inference. The mask is defined at the pixel level and updates automatically when the part program changes. This prevents the model from being re-exposed to known non-defect image features after every part changeover. ROI masking is also the correct fix for edge features that fall outside the part boundary at borderline part positions.
Typical outcome: Eliminates systematic location-specific false positives entirely. Most effective on fixture and conveyor reflection sources.
Method 05
Minimum Defect Size Filtering
The AI model may classify image noise, lens dust, or minor sensor artefacts as defects when their visual appearance approximates a small defect signature at the model's resolution. Minimum defect size filtering applies a pixel-area threshold below which detected anomalies are not promoted to production alerts — they are logged for analysis but do not trigger auto-reject or operator review queues. The size threshold is set per defect class based on the minimum size that constitutes a genuine quality concern under the applicable specification, preventing sub-specification artefacts from generating false positive events.
Typical outcome: Eliminates 20–40% of false positives caused by image noise and optical artefacts without affecting detection of genuine minimum-spec defects.
Implementation Sequence
The False Positive Reduction Sequence: What to Fix First and in What Order
Applying false positive reduction methods in the wrong order wastes effort. Recalibrating thresholds before fixing root cause C2 (fixture reflections) means the threshold adjustment is compensating for a systematic hardware issue that will resurface whenever the fixture geometry changes. The correct sequence addresses root causes before calibrating thresholds, and calibrates thresholds before retraining.
1
Diagnose False Positive Source
Pull the 50 most recent false positive images from the production log. Categorize by location (same zone every time = hardware/fixturing), by defect class (one class overwhelmingly over-represented = threshold or training issue), or by time pattern (spikes at shift start = lighting warm-up drift). The distribution tells you which root cause category to address first.
Day 1–2
2
Fix Hardware and Optical Root Causes
Apply ROI masks for systematic location-specific false positives. Clean lenses, check LED intensity and replace degraded modules. Improve part fixturing repeatability if position variation is identified as the source. These fixes are not model or software changes — they address the physical image quality entering the model.
Day 2–5
3
Calibrate Per-Class Thresholds
After hardware fixes are in place, generate confidence score distributions for each defect class from one week of production data. Set auto-reject, operator-review, and auto-pass thresholds per class based on the actual distributions — not the validation dataset distributions. Validate the new thresholds against the held-out false positive image set before applying to production.
Day 5–8
4
Enable Multi-Frame Confirmation
Configure the confidence band for multi-frame confirmation based on the borderline score range identified in step 3. Set the frame confirmation count (typically 2 of 3) and verify that cycle time budget allows the hold period at current line speed. For lines above 300 parts per minute, the hold is typically one conveyor pitch duration — under 200ms.
Day 8–10
5
Retrain with Hard Negatives
After two to four weeks of production under the new thresholds, collect the false positives that remain in the production log. Operator-verify labels, add confirmed good-part examples as hard negatives to the training set, and retrain. Evaluate the retrained model against the false positive test set and the defect recall test set before promoting to production. Measure and document the false positive rate change.
Week 4–6
6
Monitor and Maintain
False positive rates drift as production conditions change — new material lots, seasonal temperature changes, LED aging, and tooling wear all affect image characteristics over time. iFactory tracks false positive rate as a live KPI on the quality dashboard and triggers a calibration review automatically when the rate exceeds the defined threshold for three consecutive shifts.
Ongoing
The Precision-Recall Balance
The Only Correct Way to Reduce False Positives: Without Increasing False Negatives
Every method above is designed to reduce false positives while holding defect recall constant — or improving it. The table below shows what happens to defect recall under each reduction method when applied correctly versus incorrectly. The incorrect approach (raise threshold uniformly) trades false positive reduction for missed defects. The correct approach maintains or improves both metrics simultaneously.
| Method |
Effect on False Positive Rate |
Effect on Defect Recall (Correct Application) |
Effect on Defect Recall (Incorrect Application) |
| Raise threshold uniformly |
Decreases |
Decreases — misses borderline defects |
Decreases significantly |
| Per-class threshold calibration |
Decreases substantially |
Maintained or improved |
Neutral if class distribution not analyzed |
| Multi-frame confirmation |
Decreases on single-frame artefacts |
Unaffected — genuine defects persist across frames |
Minor latency if confirmation window too long |
| Hard negative mining |
Decreases progressively per cycle |
Maintained or improved |
Neutral if hard negatives mislabeled |
| ROI masking |
Eliminates systematic location FPs |
Unaffected on masked regions (non-product zones) |
Decreases if product zone masked incorrectly |
| Minimum size filtering |
Decreases sub-spec artefact FPs |
Maintained if size threshold above spec minimum |
Misses minimum-spec defects if threshold too large |
Frequently Asked Questions
What Quality Engineers Ask About False Positive Reduction
What is an acceptable false positive rate for AI vision inspection, and how is that number determined?
The acceptable false positive rate depends on the cost trade-off between reinspection labor and the consequence of a defect escape — which differs by product, defect class, and customer requirement. For most production deployments, the practical target is below 2% to maintain operator trust and below 1% for automated reject lines where a human operator is not reviewing every flagged part. The specific threshold at which operators begin routinely overriding the system — typically 3 to 5% — is the hard ceiling, because a system being bypassed provides zero quality protection. iFactory establishes the target false positive rate during the pre-deployment scoping discussion and designs the calibration program to achieve and sustain it. Contact
iFactory support to discuss the appropriate target for your specific application.
How does hard negative mining work in practice on a production inspection line?
Hard negative mining in production inspection works through a structured feedback loop. Every detection the AI system makes is logged with its confidence score and the captured image. False positives — good parts incorrectly flagged — are identified either by operator override (the operator disagrees with the rejection) or by downstream verification (the part was re-inspected manually and found conforming). These images, along with their operator-confirmed labels, are added to a retraining dataset as hard negatives — the most challenging good-part examples the model has encountered. The next retraining cycle uses this dataset to tighten the model's decision boundary specifically on the patterns it was most confused by. At iFactory, this process is automated: the system surfaces the highest-confidence false positives for operator review weekly, collects the verified labels, and includes them in the next scheduled retraining run.
Book a demo to see the active learning pipeline.
Does raising the confidence threshold always reduce false positives, and is there a risk of missing real defects?
Raising the confidence threshold does reduce false positives — but it also reduces true positive detections if the threshold is raised past the point where some real defect classes naturally score. The risk is real and significant: defect classes where the visual difference from acceptable variation is subtle (a minor gloss deviation, a fine surface scratch near the acceptance boundary) produce lower model confidence scores than obvious defects like through-cracks or dimensional failures. A uniform threshold raise that eliminates false positives on obvious classes may simultaneously begin missing the subtle ones. The correct approach is per-class threshold calibration based on the actual score distributions of true positives and false positives observed in production — which sets each class's threshold at the point that maximizes false positive reduction without degrading recall on genuine defects of that class.
How quickly can false positive rates be reduced after a system is already in production?
Hardware and optical root causes (fixture reflections, lighting drift, ROI masking gaps) can typically be resolved within two to five days once diagnosed. Per-class threshold calibration requires one week of production data for the confidence score distributions to be statistically meaningful, then one to two days to recalibrate and validate. Multi-frame confirmation is a configuration change that can be enabled in hours. The full sequence from diagnosis to initial calibration typically takes two to three weeks. Hard negative retraining requires four to six weeks to collect sufficient false positive examples from production, complete the retraining cycle, and validate the new model. Combined, most deployments reach a stable sub-1% false positive rate within six weeks of starting a structured reduction program — not six months. Contact
iFactory support to begin the diagnosis for your existing system.
Can false positive rates stay low over time as production conditions change, or does the system need constant recalibration?
Without active monitoring, false positive rates will drift upward as production conditions change — new material lots, tooling wear, LED aging, seasonal temperature shifts, and new product variants all change the image characteristics that the model was calibrated on. The key to sustaining low false positive rates is a structured monitoring program rather than periodic manual recalibration campaigns. iFactory tracks false positive rate as a live KPI on the quality dashboard, compared against the baseline established at calibration. When the rate drifts above a defined alert threshold for three consecutive shifts, the system automatically flags the increase and identifies which defect class or image region is responsible — giving the engineering team a specific target rather than a general alarm. Most production environments require a minor threshold recalibration every two to four months and a full hard negative retraining cycle every six to twelve months to sustain performance.
Your AI Inspection System Is Only as Good as Operators' Willingness to Trust It. Let's Get Your False Positive Rate Below 1%.
Per-class threshold calibration, multi-frame confirmation, hard negative mining, and structured monitoring — applied in the correct sequence, for your specific inspection system and production conditions.