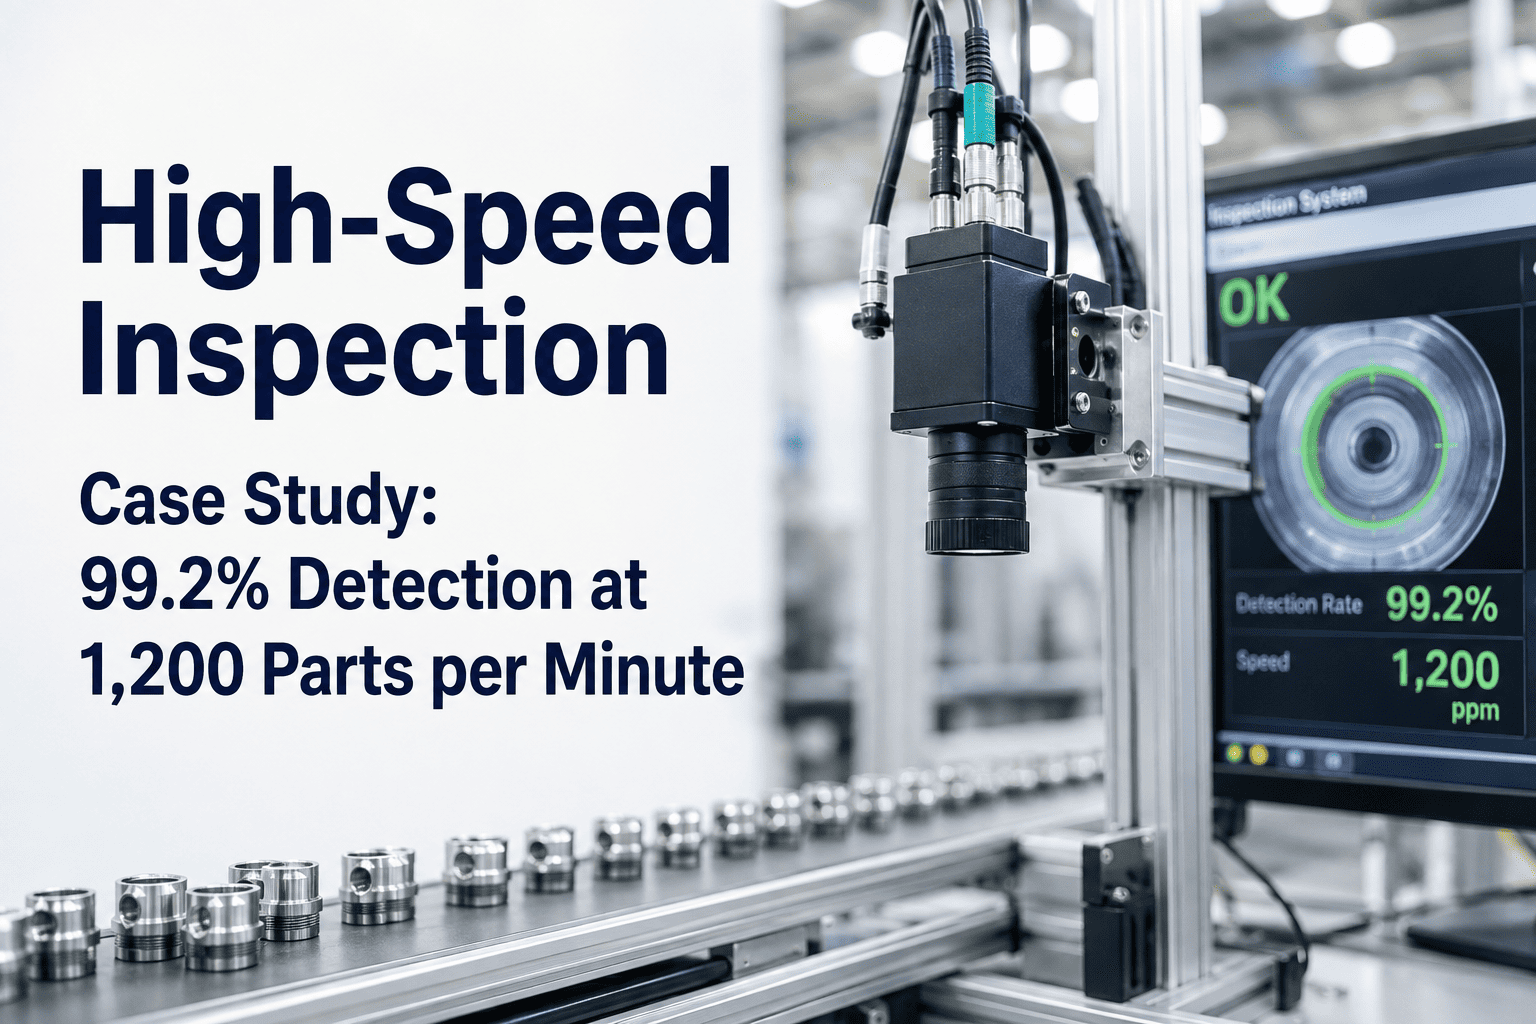
A consumer goods line running 1,200 parts per minute gives an inspector roughly fifty milliseconds to see, judge, and act on each part — a decision window shorter than a human blink. No inspection team on earth can hold that pace for eight hours. This is the case study of a mid-size consumer goods manufacturer who ran head-first into that ceiling, deployed iFactory's AI Vision Camera at full line speed, and moved from routine scrap and slow-downs to 99.2 percent detection accuracy at production throughput. Every number below is from the deployment; every step is reproducible on your own line via a Book a Demo.
99.2% Detection at 1,200 Parts a Minute — The Full Deployment
A consumer goods manufacturer's inspection station was the bottleneck of the plant. iFactory's AI Vision Camera turned it into the fastest, most accurate station on the line — full coverage, no slowdown, and a $640,000 annual reduction in scrap that the finance team could trace line by line, month by month.
A Line Running Faster Than Anyone Could Actually Inspect It
The plant's packaging line ran at 1,200 parts per minute — twenty parts every second. At that speed, a human inspector is being asked to make a pass or fail judgment roughly every fifty milliseconds, a rate far below the biological floor for reliable visual decision-making. Studies of manual inspection consistently show accuracy degrading fifteen to twenty-five percent after just a couple hours of continuous observation, and even skilled inspectors miss a substantial share of real defects under production conditions well below this line's speed. The plant's existing approach was a mix of sample-based manual checks and a legacy fixed-threshold vision system that flagged so many false positives operators had started overriding it by default — the exact failure mode that turns an inspection investment into an ignored alarm.
Inspection Was Sampled, Not Complete
Manual spot checks covered a small fraction of total output. The vast majority of parts left the line with no direct human or machine verification of their actual quality, relying entirely on statistical inference from the sampled subset.
The Legacy Vision System Cried Wolf
A rules-based system from a decade earlier flagged benign variation as defects so often that line operators began ignoring alerts entirely, defeating the purpose of automation.
Escaped Defects Reached Distribution
Because inspection coverage was incomplete, defective units routinely slipped through sampling gaps and reached fulfillment, triggering customer complaints and return processing.
Quality Data Lived In Silos
Defect information existed as handwritten shift notes and disconnected spreadsheets. Root cause analysis on recurring defects took days of manual reconciliation before any pattern was visible to the quality engineering team.
From Site Audit To Full Line Speed In Four Phases
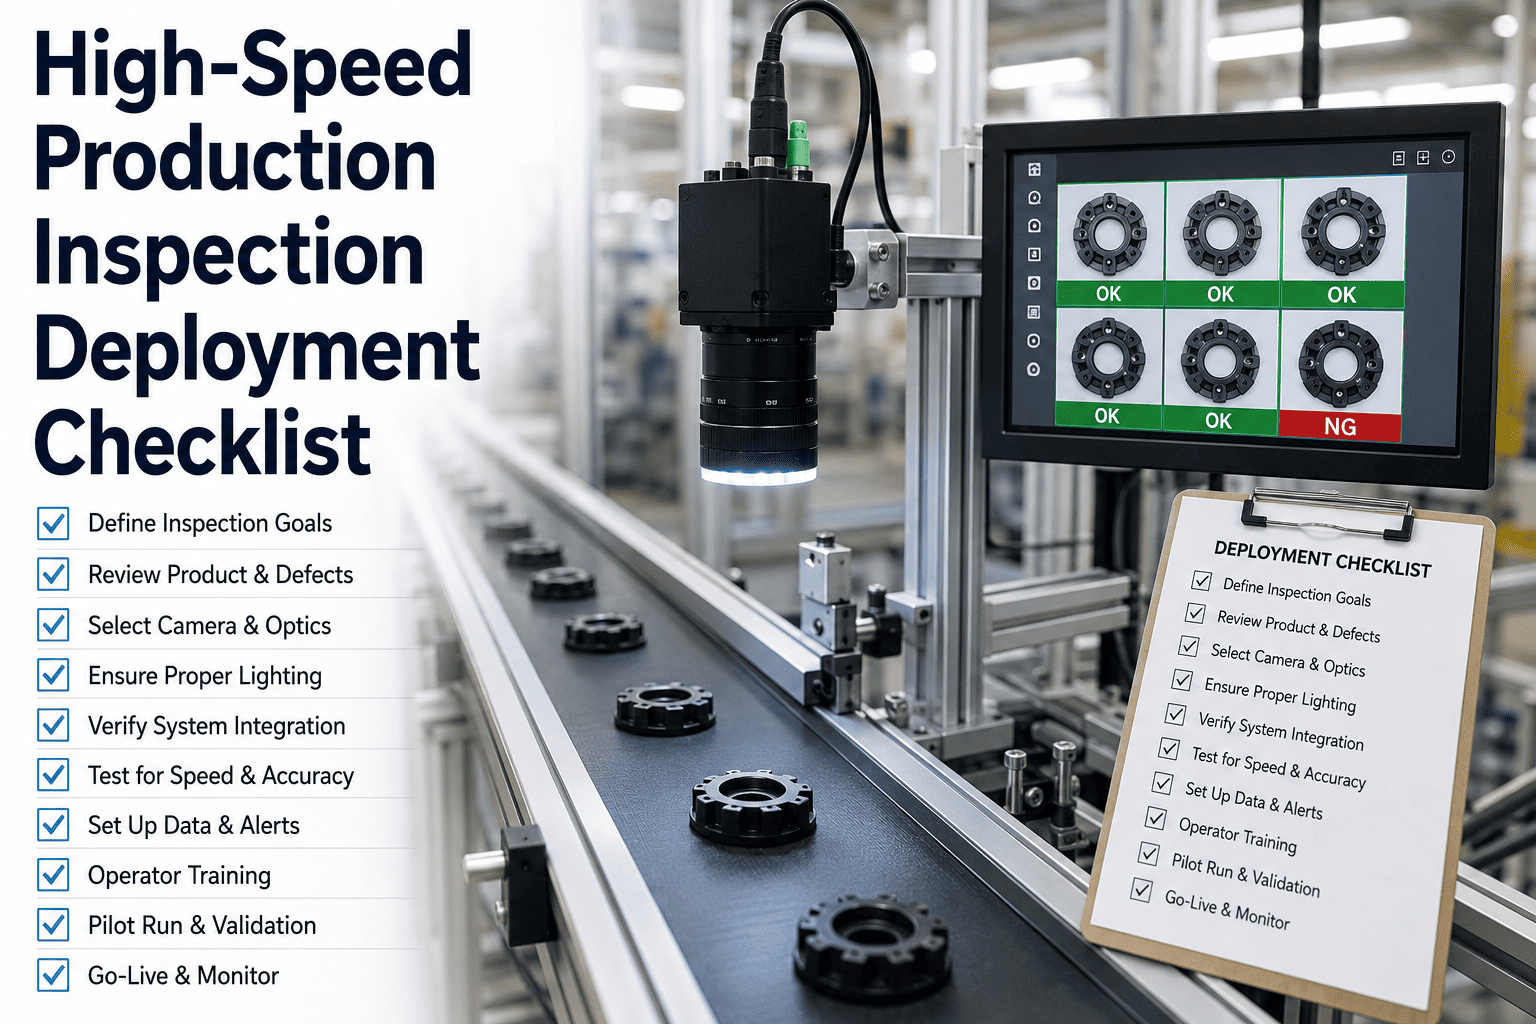
The engagement followed a structured rollout designed to prove accuracy before committing to full-line coverage, so the manufacturer never had to trust a black box. Each phase built directly on validated results from the one before it, and the line kept running production throughout — there was no point in the nine-week engagement where the plant had to accept a shutdown, a slowdown, or a leap of faith. The team treated every phase gate as a decision point: if pilot accuracy hadn't cleared the bar against the manual baseline, cutover to full production authority simply would not have happened.
Site Audit & Camera Specification
Engineers assessed the exact line speed, part geometry, lighting conditions, and existing defect history to specify camera placement, resolution, and processing hardware matched to 1,200 parts per minute throughput.
Model Training On Real Defect Data
The model was trained on existing quality records, physical sample parts, and synthetic data augmentation, building an effective detection model from several hundred labeled defect examples per defect category rather than requiring a pristine dataset from scratch.
Pilot Validation Against Manual Baseline
The system ran in parallel with existing inspection for a defined pilot window, with every AI decision cross-checked against manual review to validate accuracy and calibrate detection thresholds before any line control authority was granted.
Full-Speed Production Cutover
With pilot accuracy validated and false positive thresholds calibrated to minimize operator review burden, the system was cut over to full production authority at complete 1,200 parts per minute line speed.
What Changed When The Camera Went Live
The comparison below is the plant's own before-and-after data across the metrics that mattered most to the quality and operations teams. The gap between the two columns is the entire business case for the deployment, measured in the exact units the plant already tracked before iFactory arrived — nothing here required inventing a new metric to make the story look good. Every row reflects the same reporting cadence the quality team had used for years, just with radically different numbers feeding into it every single shift.
| Metric | Before iFactory | After iFactory |
|---|---|---|
| Detection Accuracy | Sampled coverage, inconsistent | 99.2% at full line speed |
| Inspection Coverage | Statistical sample only | 100% of parts, every unit |
| False Positive Rate | High enough operators overrode alerts | Under 0.8% |
| Inspection Speed | Bottleneck below line speed | Full 1,200 parts per minute, no slowdown |
| Annual Scrap Cost | Baseline cost of poor quality | $640,000 reduction |
| Defect Root Cause Time | Days of manual reconciliation | Minutes, from structured trend data |
Three Engineering Decisions Behind The 99.2% Number
High detection accuracy at high line speed does not come from a single breakthrough — it comes from a stack of specific engineering choices that compound. Manufacturers evaluating vision inspection often ask about the accuracy percentage in isolation, but the number only means something in the context of the throughput it was measured at and the false positive rate that came with it. These are the three engineering decisions that mattered most in this deployment, and the ones worth asking about in any evaluation of a competing system.
Sub-100ms Edge Inference
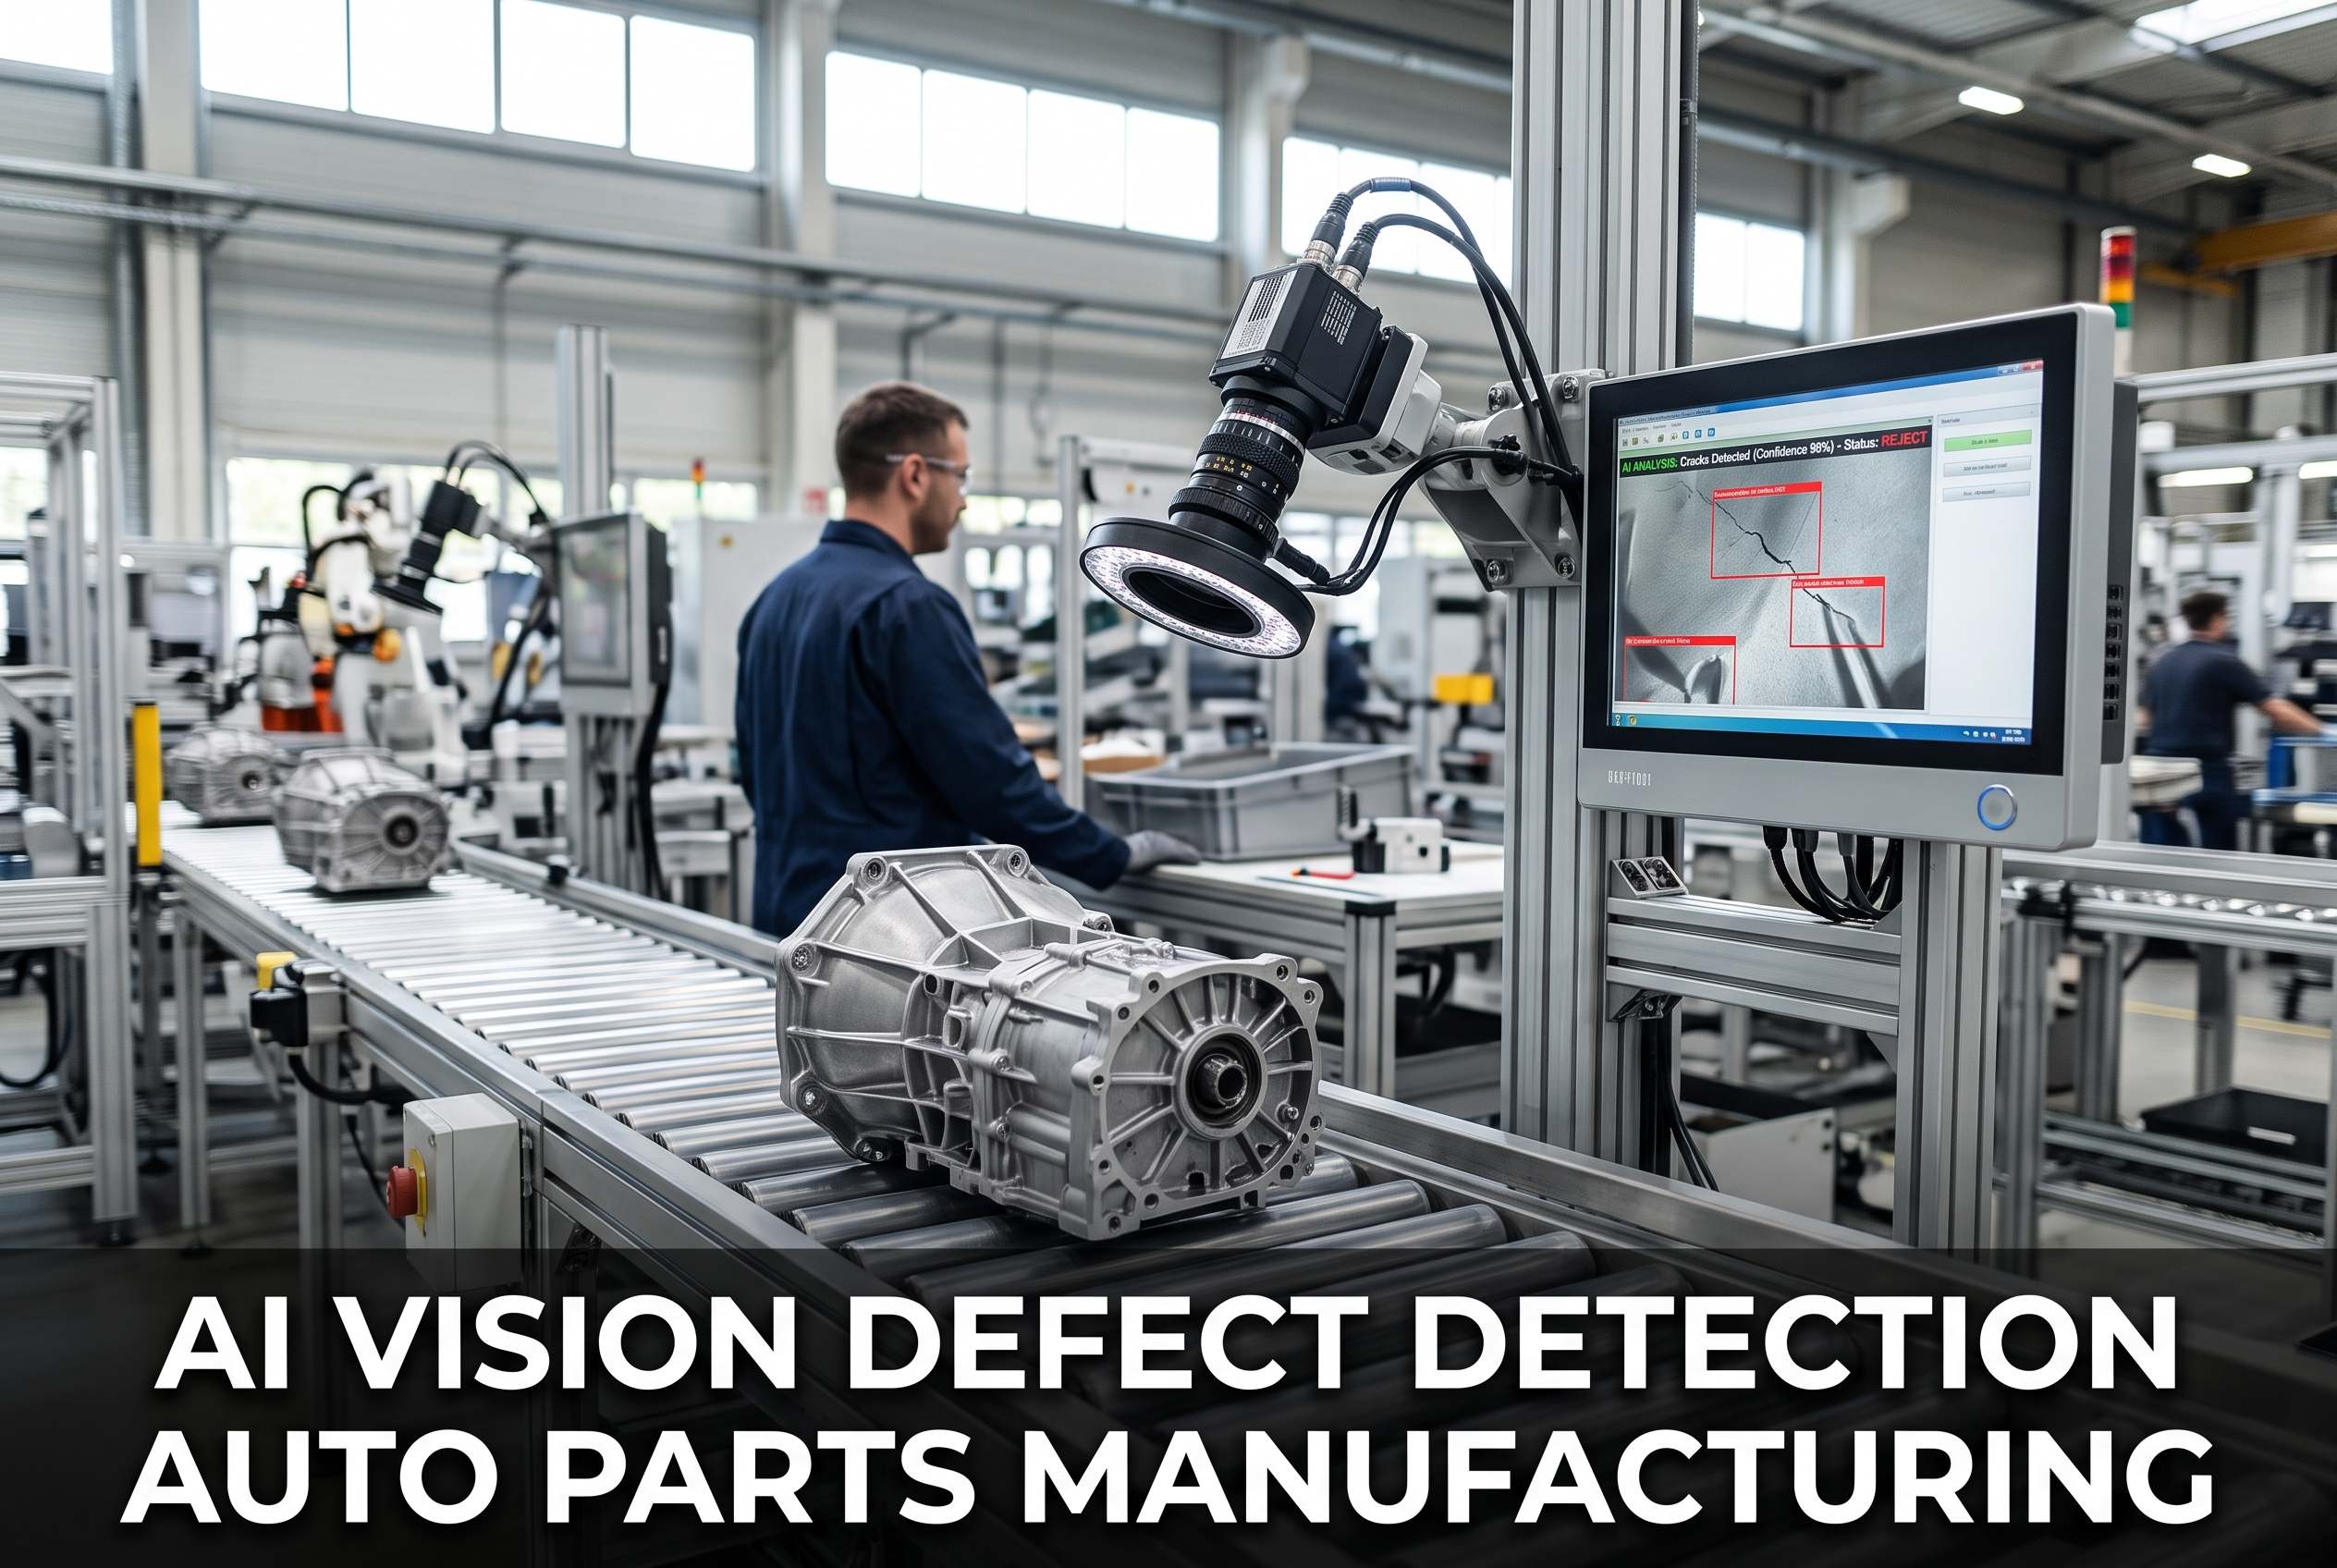
Image capture, defect classification, and routing decision complete in well under 100 milliseconds per part, keeping pace with a line moving twenty parts every second without introducing any inspection-station bottleneck. This is the specific technical requirement that separated a viable deployment from the legacy system's failed attempt at the same line speed.
Defect-Specific Model Training
Rather than one general-purpose model, detection thresholds were tuned per defect category — surface flaws, dimensional deviation, and assembly errors each trained and calibrated separately for the specific product geometry, since a single blended threshold tends to underperform on at least one defect class.
False Positive Calibration As A Primary Objective
Detection thresholds were deliberately calibrated during the pilot phase to minimize false positive burden on operators — a system nobody trusts because it over-flags is a system that gets ignored, no matter how accurate the underlying model.
See The Same Accuracy Curve On Your Line
We'll walk through your part geometry, current defect rates, and line speed to show what a comparable pilot would look like before you commit to anything.
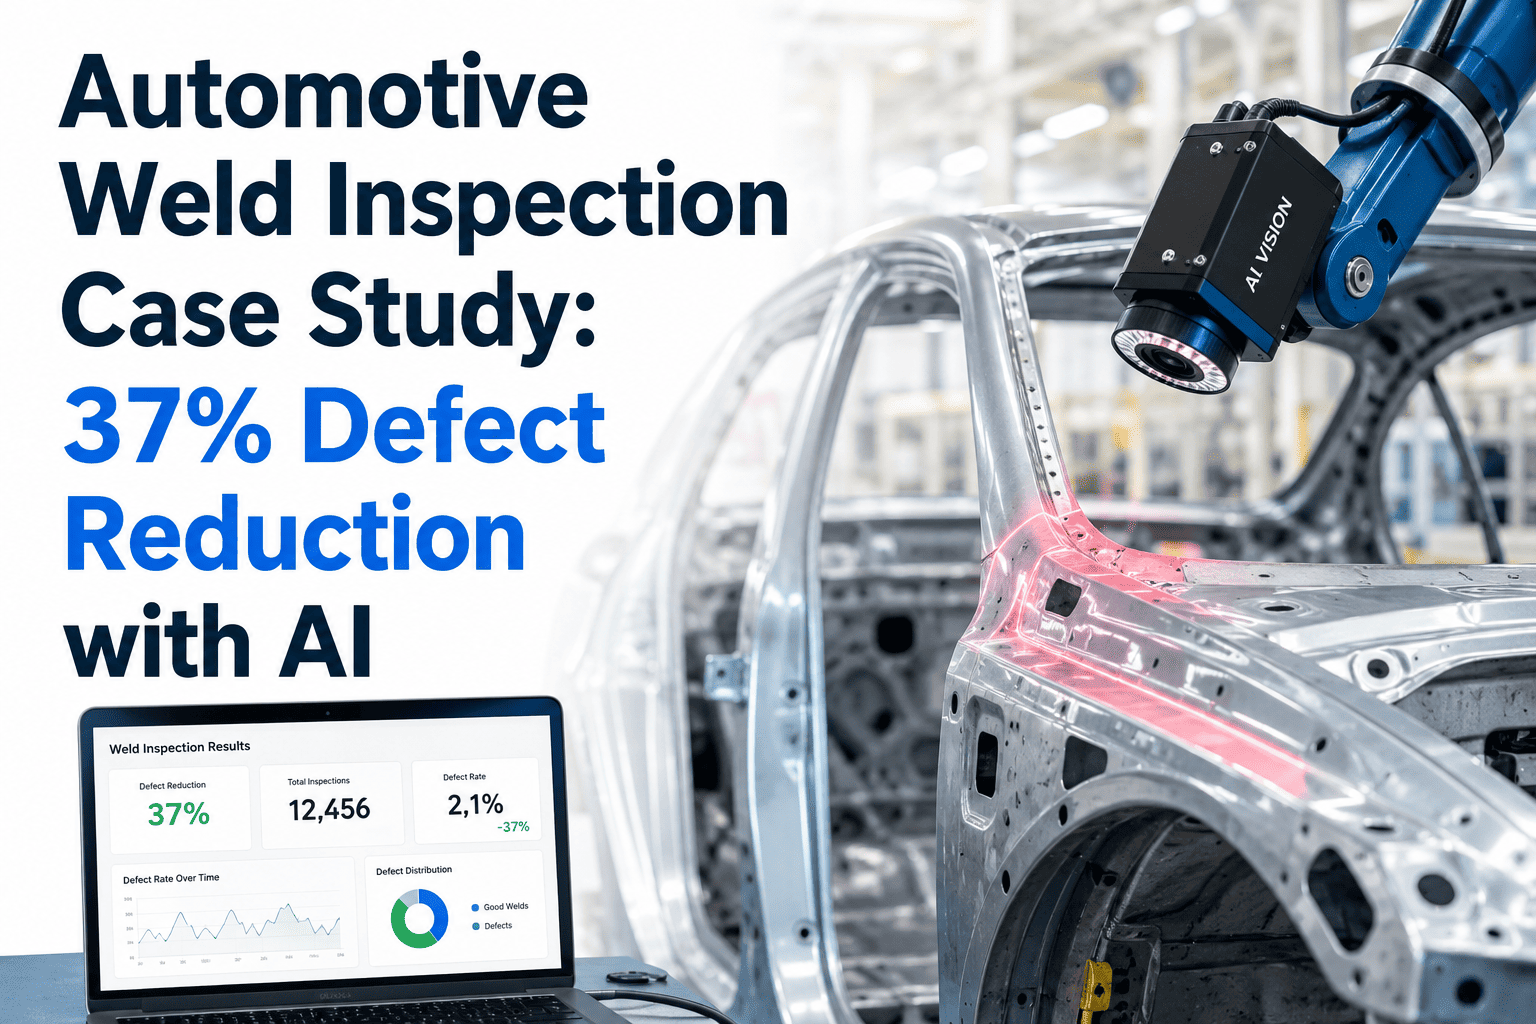
Where The $640,000 In Annual Savings Actually Came From
The headline savings number is a composite of several distinct cost reductions, not a single line item. Understanding the breakdown matters because it shows the return is structural, not a one-time accounting adjustment — each of these categories keeps compounding every production week going forward, and none of them depends on a favorable assumption that might not hold up under scrutiny from finance. The largest single contributor is scrap and rework, which tracks directly to the jump in detection coverage from a statistical sample to every unit produced.
From First Call To Full Production In Weeks, Not Quarters
One of the most common concerns before a deployment like this is how long it will take and how disruptive it will be to a line that cannot afford unplanned downtime. The honest timeline from this engagement is below — a structured rollout with validation gates, not a single high-risk cutover where the plant has to bet an entire production shift on an unproven system. Every week in this timeline had a defined deliverable and a defined go/no-go checkpoint before moving forward.
What This Kind Of Accuracy Unlocks Beyond The Inspection Station
Full-coverage, high-accuracy inspection doesn't just replace a manual checkpoint. It generates a structured, timestamped dataset for every single unit produced — data the plant never had before at this resolution, and data that reshapes decisions well beyond the inspection line itself. Quality, maintenance, and operations teams each found uses for the data that weren't part of the original business case, which is common in deployments like this: the inspection accuracy is the entry point, but the dataset it produces is often where the second wave of value shows up, sometimes exceeding the original scrap-reduction case within the first full year of operation.
Serial-Level Audit Trail
Every unit's inspection record — image, defect category, confidence score, and disposition — is logged and searchable, turning customer complaints into minute-scale lookups instead of multi-day investigations.
Real-Time Defect Trending
Defects are automatically tagged by type, shift, and station, surfacing recurring patterns within minutes instead of the days it previously took to reconcile paper logs into a usable trend.
Drift Detection Before Failure
Gradual quality drift — a die wearing, a fixture loosening — shows up as a trend in the detection data well before it produces a defect rate spike, giving maintenance a lead indicator instead of a lagging one.
Repeatable Rollout Playbook
The four-phase deployment model validated on this line becomes the template for expanding coverage to additional lines and product variants without repeating the full evaluation cycle each time.
This Isn't An Outlier Result — It's Where The Industry Is Headed
The numbers in this case study track closely with what's happening across high-speed manufacturing more broadly. Modern AI vision inspection systems now routinely achieve ninety-five to ninety-nine percent detection accuracy while inspecting well over ten thousand parts per hour at sub-100 millisecond inference speed — figures that would have sounded implausible a decade ago and are now baseline expectations for a properly engineered deployment. The gap between what manual inspection can physically deliver and what a production line actually needs has been widening for years, and this case study is one concrete data point in a much larger shift.
The Human Ceiling
Manual inspection tops out around two to three items per minute for careful visual review, while modern vision systems process over ten thousand parts per hour — a gap that only widens as line speeds increase across the industry and product complexity grows alongside them, leaving manual sampling further behind every single year.
The Fatigue Curve
Inspector accuracy degrades meaningfully within the first couple hours of a shift and continues declining toward the end, meaning the defects most likely to escape are concentrated exactly when production volume and shift fatigue are often highest simultaneously.
The Consistency Problem
Different inspectors classify identical defects differently often enough that the same part can pass on one shift and fail on the next, creating disputes between shifts and inconsistent quality standards that vision-based thresholds eliminate by design and by definition.
We'd tried a rules-based vision system years earlier and it flagged so many false positives that operators just started ignoring the alarms — it became noise instead of signal, and honestly it set us back because it made the whole team skeptical of vision inspection generally. iFactory's system is the first one that actually earned the operators' trust, because the false positive rate stayed low enough that when it flagged something, people knew to take it seriously. We're catching defects at full line speed that used to slip through our sampling gaps entirely, and the scrap number speaks for itself. What surprised me most wasn't the accuracy — it was how fast the root cause data let us fix upstream problems we didn't even know we had.
Frequently Asked Questions
Q: Will AI vision inspection actually keep up with a line running well over 1,000 parts per minute?
Q: How much labeled defect data do we need before the model is accurate enough to trust?
Q: What happens when we introduce a new product variant or change part geometry?
Q: How is the false positive problem managed so operators aren't buried in reject reviews?
Q: How long does a comparable deployment take from first conversation to full production authority?
Turn Your Inspection Station From Bottleneck To Benchmark
Book thirty minutes with our team, bring your line speed and current defect data, and see what a pilot on your own production line could look like — including a realistic estimate of the accuracy and scrap savings you could expect at your specific throughput.