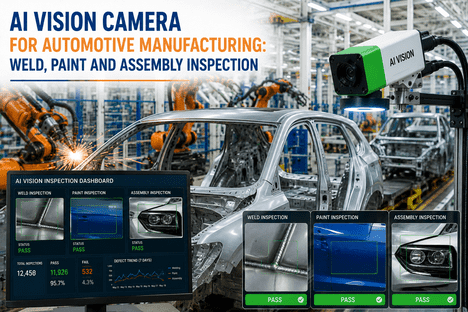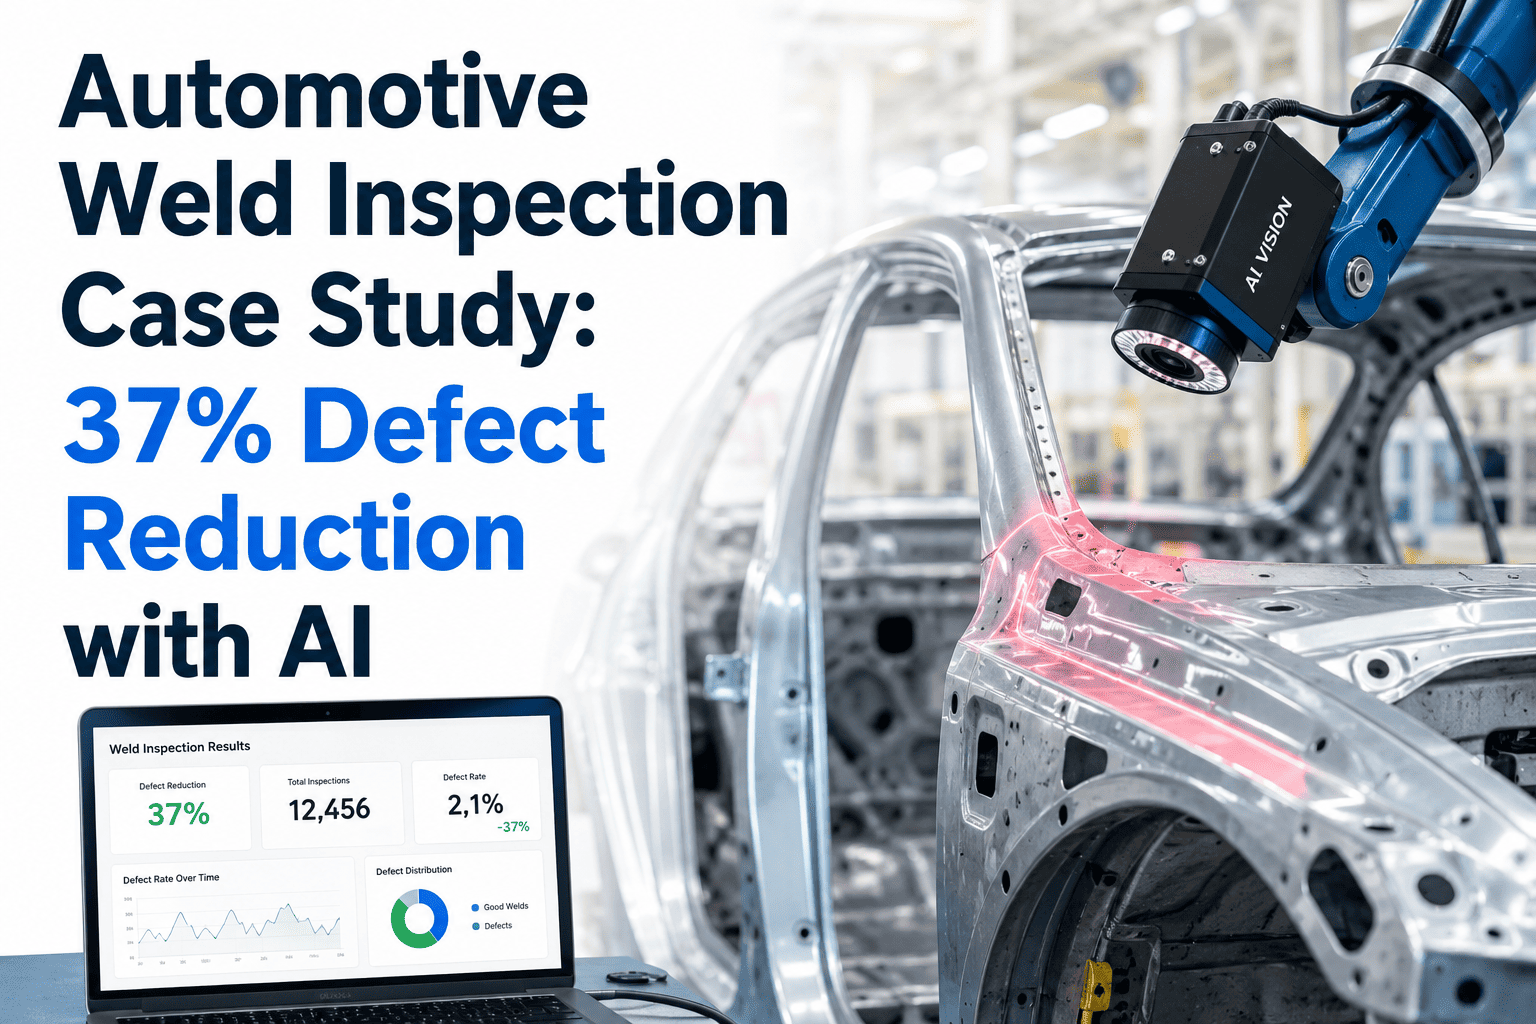
Forty-eight welding stations. Thousands of spot and seam welds per vehicle body. A manual inspection process catching roughly eight out of every ten defects on a good day, and fewer than that after six hours into a shift. That was the starting point for an automotive OEM body shop before it deployed AI vision inspection across its full weld line. What follows is a look at what changed over the twelve months after go-live, powered by iFactory's AI Vision Cameras.
82% to 99.1% weld defect detection. 37% less rework. 25% fewer warranty claims.
How an automotive body shop replaced sampling-based manual weld inspection with 100% AI-inspected coverage across 48 stations — and what the numbers looked like a year later.
Manual inspection was catching most defects — just not enough of them
The body shop wasn't running a broken process. Trained inspectors, documented procedures, periodic ultrasonic spot checks — the fundamentals were in place, and the plant was performing in line with industry norms for manual weld inspection. That's precisely what makes the starting number worth sitting with: even a well-run manual program tops out around 80% detection under optimal conditions, and inspector fatigue pulls that lower as a shift wears on. This wasn't a case of a poorly managed line finally getting fixed. It was a well-managed line running up against a hard structural limit that better training or more inspectors couldn't solve.
The math behind that gap is structural, not a people problem. A single vehicle body can carry several thousand resistance spot welds, plus seam and MIG welds at structural joints. Inspecting all of them by eye, at line speed, for every vehicle, isn't physically achievable — so manual programs sample. A representative slice of welds gets checked, ultrasonic testing covers a smaller slice still, and the rest passes on the statistical assumption that if the sample is clean, the population probably is too. That assumption held often enough to run the plant, but "often enough" was leaving real defects in structural welds that didn't surface until a warranty claim months or years later.
Quality leadership at the plant had also tried the conventional levers before considering a vision-based approach: adding inspector headcount, rotating shifts more frequently to manage fatigue, tightening ultrasonic sampling frequency. Each helped marginally, and each came with a real cost in labor hours or line disruption. None of them addressed the fundamental ceiling — that a sampling-based process, however well executed, cannot deliver the coverage that full inline inspection provides by design.
Weeks 1-3: Line assessment and defect library build
Each of the 48 stations was mapped for weld type — spot, seam, and MIG were all represented — and historical defect data was used to build the initial training set for the vision model.
Weeks 4-7: Camera installation across all 48 stations
Cameras were installed at each station without halting production, working station by station during scheduled changeovers to avoid unplanned downtime.
Weeks 8-14: Shadow-mode validation against destructive testing
The AI ran in parallel with the existing manual process, and its assessments were checked against destructive peel-test results on matched samples to validate detection accuracy before it drove any line decisions.
Week 15 onward: Live inline inspection, full coverage
Every weld at every one of the 48 stations began passing through inline inspection, with automated defect classification and work orders routed directly to the line.
The shift from sampling to full coverage is the core structural change behind every number in this case study — not a smarter version of the old process, but a different inspection model entirely. Book a 30-minute session and we'll walk through what full-coverage inspection would look like on your specific weld mix.
What changed at each stage of the inspection process
Catching defects earlier changes what "rework" actually means
Under the manual process, a missed weld defect frequently wasn't caught until several stations downstream — sometimes not until final inspection or a later quality gate. By that point, correcting it meant reworking a body shell that had already had additional welds, coatings, or components added on top of the original defect, which is a fundamentally more expensive and time-consuming fix than correcting the weld at the point it was made.
The rework math compounds in a way that's easy to underestimate from the outside. A weld defect caught at the same station it occurred typically means a localized re-weld and re-inspection — minutes of labor. The same defect caught three or four stations later, after paint prep or subsequent structural welds have gone on top, can mean partial disassembly, access constraints, and rework that touches multiple downstream processes rather than one. Multiply that difference across every defect that used to escape the 80% detection ceiling, and the total labor-hour reduction adds up quickly even before accounting for line disruption avoided by not pulling a body shell out of sequence for a late-stage fix.
Defect forms during welding
Porosity, spatter, or incomplete fusion occurs at the weld station, the same as it always did.
AI flags it immediately
Inline inspection catches the defect within the weld cycle itself, before the body shell advances to the next station.
Correction happens at the source
Rework is a single-station fix rather than a multi-station teardown, because nothing has been built on top of the defect yet.
Rework hours compound down
Across 48 stations and full production volume, cheaper, earlier fixes accumulate into the 37% reduction in total rework hours.
The defects that used to escape are the ones that used to become claims
The connection between detection rate and warranty claims is direct and largely mechanical. Every defect that manual sampling missed under the old process had one of two outcomes: it was caught downstream at a later quality gate, or it made it into a finished vehicle and became a field failure — often a structural or safety-related warranty claim months or years after the sale, well after the original weld station is a distant memory in the production record.
Moving detection rate from roughly 80% to 99.1%, with 100% weld coverage instead of a 5-10% sample, closes most of that escape path. The 25% reduction in weld-related warranty claims over the twelve-month tracking period reflects defects that would previously have reached a customer's vehicle and instead were caught, classified, and corrected on the line before the body shell ever left the plant.
Warranty claims tied to structural weld failures also carry a cost profile that makes this reduction disproportionately valuable relative to its size. These aren't minor cosmetic claims — a structural weld failure can trigger extended investigation, a wider batch review to check whether the same defect signature appears in other vehicles from the same production window, and in serious cases regulatory scrutiny. A 25% reduction in a claim category with that severity profile carries weight well beyond what the percentage alone suggests.
See what full-coverage weld inspection would catch on your line
Bring your current weld mix and inspection sampling rate to a live session — we'll show detection running on weld types from your industry.
A realistic picture of the deployment, not just the highlight numbers
A credible case study includes what stayed the same, not only what improved. Destructive peel testing wasn't eliminated — it shifted role, from a compensatory sampling strategy needed because inline coverage didn't exist, to a periodic validation activity confirming that the AI model's assessments continue to correlate with actual weld metallurgy over time. Line speed didn't change either; inspection now runs inline at sub-second inference per weld, so throughput at the 48 stations was unaffected by adding full coverage where sampling used to be the norm.
Staffing on the inspection side changed in shape more than in size. Rather than reducing headcount, the plant redirected inspector time from routine visual sampling toward reviewing AI-flagged defects, investigating root causes, and managing the periodic destructive-test validation program — work that requires judgment and experience rather than repetitive scanning, and that inspectors generally found more engaging than the sampling routine it replaced.
The pattern generalizes — the exact numbers depend on your starting point
This deployment ran across spot, seam, and MIG welding processes at 48 stations, which is a large but not unusual footprint for a body-in-white line. The underlying mechanism — moving from sampled to full-coverage inspection, catching defects at the point of formation instead of stations later — applies broadly across automotive weld lines regardless of exact station count or weld mix.
What varies by facility is the size of the gap between current manual detection rate and what full AI coverage typically achieves. A plant already running disciplined manual inspection with strong ultrasonic sampling will likely see a smaller jump in raw detection percentage than this case study shows, but still gains the coverage expansion from 5-10% of welds to 100%. A plant with more inspector turnover, tighter staffing, or a wider weld-type mix often has more room to improve, and the rework and warranty gains tend to scale accordingly.
The fifteen-week deployment timeline in this case study is also a reasonable planning reference rather than a fixed rule. Facilities with fewer stations or a narrower weld-type mix have sometimes moved faster; those with more complex weld geometries or a wider defect library requiring deeper model training have occasionally taken longer to complete shadow-mode validation before going live. The variable that matters most for timeline planning is usually how much historical defect and destructive-test data already exists to seed the initial training set — more existing data generally means a shorter path to a validated model.
About this deployment, answered plainly
Ready to see what your weld line's numbers could look like?
Bring your current inspection process and defect data — we'll show you where full coverage would have caught what sampling missed.