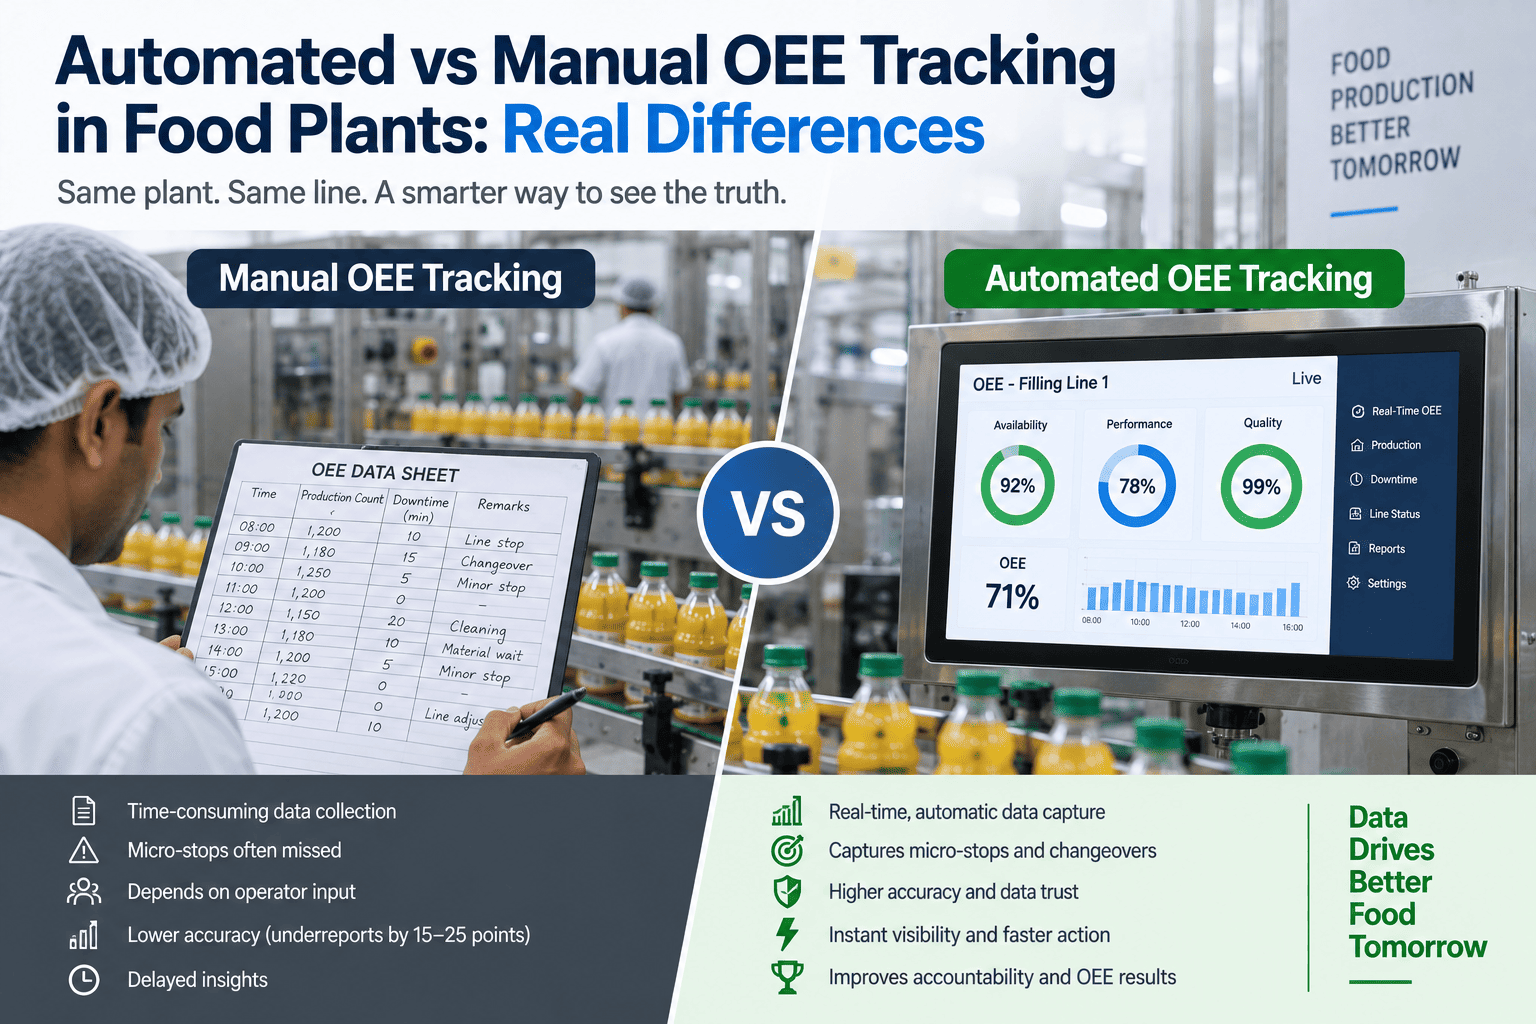
Here's the uncomfortable thing about manual OEE in a food plant: it isn't slightly optimistic, it's structurally blind. When a plant switches from clipboard-and-spreadsheet tracking to automated measurement, the OEE number typically drops 15 to 25 points overnight — not because anything on the line changed, but because the automated system finally counts what the manual one couldn't see. The micro-stops on a filler that pause four seconds forty times a shift. The changeover that ran 20 minutes over standard but got logged at standard. Manual and automated OEE run the exact same formula; they just disagree, badly, on what happened. This guide compares the two honestly on the three things that matter — accuracy, speed, and trust. You can book a demo to see the gap on one of your own lines.
Same Formula, Different Truth: What Manual OEE Can't See in a Food Plant
Manual OEE underreports micro-stops and changeover by 15 to 25 points. Here's how automated and manual tracking really compare on accuracy, speed, and trust — and why the gap is hidden capacity, not a rounding error.
Manual OEE Doesn't Measure Wrong. It Fails to Measure at All.
It's tempting to think manual tracking is just less precise, off by a few points you can mentally adjust for. It isn't. The losses manual tracking misses are entire categories, not rounding — and in a food plant they happen to be the largest categories. When the automated number comes in 15 to 25 points lower, that whole gap is real loss that was happening all along, invisible to the clipboard. Here's what lives in that gap.
And this is why the plants most confident in their OEE are often the ones with the biggest hidden gap. A well-run manual program with tidy spreadsheets and disciplined operators produces a clean, believable number — which is exactly what makes its blindness dangerous, because nobody questions a number that looks this professional. The discipline goes into recording the losses that are easy to see, while the ones that dominate a food line slip through no matter how conscientious the logger. Neatness isn't accuracy; a beautifully maintained manual OEE can be just as blind as a sloppy one.
A filler or labeler that pauses for a few seconds, many times an hour, is the signature loss on a food packaging line — and nobody hand-logs a four-second stop. These cumulative micro-stops routinely hide 30-plus minutes of lost time per shift that manual reports never capture.
An allergen or format changeover that overran by 20 minutes gets written down as the standard time, because that's what the sheet expects. The overrun — often the single biggest recoverable loss on a high-mix food line — quietly disappears.
A line running below rated speed from material variation or operator caution bleeds a silent 10-to-20 percent performance loss. Manual performance math uses the nameplate cycle time, crediting speed the line never actually reached.
Post-changeover stabilization rejects and fill-weight giveaway get estimated or forgotten by shift-end, so quality loss reaches the report cleaner than the shift really was.
Manual vs. Automated on the Three Things That Matter
Both methods compute Availability times Performance times Quality. But how the data is captured, when it arrives, and whether you can trust it changes everything about what the number is worth. Read this down the three dimensions that actually decide whether OEE improves anything.
| Dimension | Manual (Clipboard / Spreadsheet) | Automated (Direct from Line) |
|---|---|---|
| Micro-stop capture | Missed — too short and frequent to log by hand | Every sub-minute stop counted automatically |
| Changeover time | Recorded at standard, overruns lost | Actual duration, timed to the second |
| Speed loss | Nameplate assumed, real speed unknown | Real cycle time measured continuously |
| When you get it | End of shift or next day — stale | Live, during the shift, in time to act |
| Cross-shift consistency | Each shift codes losses its own way | One logic applies to every shift and line |
| Trust in the number | Known to be optimistic, quietly discounted | Defensible enough to act and benchmark on |
See Your Real OEE Number, Not the Clipboard's
iFactory captures every micro-stop, changeover, and speed loss directly from the line, second by second — so the number you act on is the one that's actually true.
You Can't Improve What You Never Counted
Accuracy is where the two methods diverge most, and it's not a close call. Manual data collection systematically underreports a large share of losses — by some measures 30 to 50 percent — and it does so precisely on the losses that dominate a food plant's OEE. The consequence isn't just a wrong headline number; it's that improvement effort gets aimed at the wrong target, because the real biggest loss was never visible to aim at.
Micro-stops, changeover overruns, and speed sag aren't minor categories in food — they're the dominant ones. A method blind to exactly these produces a number that's not just high, but wrong about where the capacity is going.
Plants that launch improvement off manual data chase the loss they can see instead of the loss that's biggest. Plants that install automated capture first achieve two to three times better improvement results, because they're working the real Pareto.
Honesty matters here: an automated system is only as good as its sensor placement and stop-categorization logic. Misconfigured, it reports bad data very precisely. The advantage is real, but it comes from automation done correctly, not from automation alone.
A Number You Get Tomorrow Can't Fix a Problem You Had Today
Even a perfectly accurate manual number has a fatal timing problem: it arrives after the shift it describes is over. OEE calculated end-of-shift or next-day is already stale — the pattern that could have been caught and fixed in real time has become yesterday's problem, and the loss it represents is already spent. Speed of feedback is what turns OEE from a scorecard into a control.
The number describes a shift that's already gone. A recurring micro-stop that cost 30 minutes today is discovered tomorrow, by which point it's cost 30 more. The data documents loss; it doesn't prevent it.
The loss surfaces as it happens, so a supervisor can investigate and fix it during the shift rather than reading about it the next morning. The same feedback that measures the loss is what lets you stop it.
The Real Cost of Manual OEE Is That Nobody Believes It
This is the dimension that quietly undermines everything. When a plant knows its OEE number is optimistic — and everyone always knows — the number stops driving decisions. It gets reported up, discounted mentally, and ignored operationally. A metric nobody trusts is worse than no metric, because it creates the illusion of measurement while the real losses continue unmanaged. Trust is what an accurate, consistent, timely number buys you.
When one logic applies across every shift, line, and site, a 75 percent in one place means the same as a 75 percent in another. Manual coding — where Shift A calls changeover planned and Shift B calls it unplanned — makes cross-comparison meaningless.
Operators and managers act on data they believe. When the number is defensible — every loss traceable to a real event — the morning meeting argues about the fix, not about whether the number is right.
The first honest number lands below expectation and it stings. But that gap between the comfortable estimate and the real figure is exactly the recoverable capacity — you can't reclaim a loss you were pretending wasn't there.
Each shift of accurate, consistent data adds to a record you can actually analyze for patterns. Manual data can't compound into insight because it isn't consistent enough to trend — every shift means something slightly different.
The Food-Specific Losses Are Exactly the Ones Manual Misses
This gap hits food and beverage harder than most sectors, because the losses that dominate a food plant are precisely the ones manual tracking is worst at capturing. It's not a coincidence — it's the structure of food production meeting the limits of a clipboard.
A line running well over a thousand units a minute pauses for seconds constantly. At that speed, each stop is invisible to a human logger but adds up fast — and it's the signature food-line loss.
With 30 to 100-plus SKUs on a line, changeovers are constant, and their overruns are the biggest single availability loss — exactly the thing that gets logged at standard rather than actual.
CIP can consume 15 to 25 percent of shift time, and distinguishing planned sanitation from unplanned overrun by hand is nearly impossible — so the overrun hides inside "planned."
Post-changeover stabilization scrap and fill-weight giveaway are real quality losses that manual quality tracking rounds away, understating the true quality factor.
Automated Done Right — Every Loss, Categorized, in Real Time
The honest caveat about automated OEE — that it's only as good as its logic — is exactly why the how matters. iFactory captures loss directly from the line, categorizes it correctly against the food-specific loss structure, and does it consistently across every shift and line, so the number is both accurate and trusted.
What Operations Teams Ask About Automated vs Manual OEE
Stop Managing a Food Plant on a Number You Don't Believe
iFactory replaces clipboard OEE with second-by-second capture from the line, categorized the way food production actually works and consistent across every shift — so the number is accurate, current, and finally worth acting on.