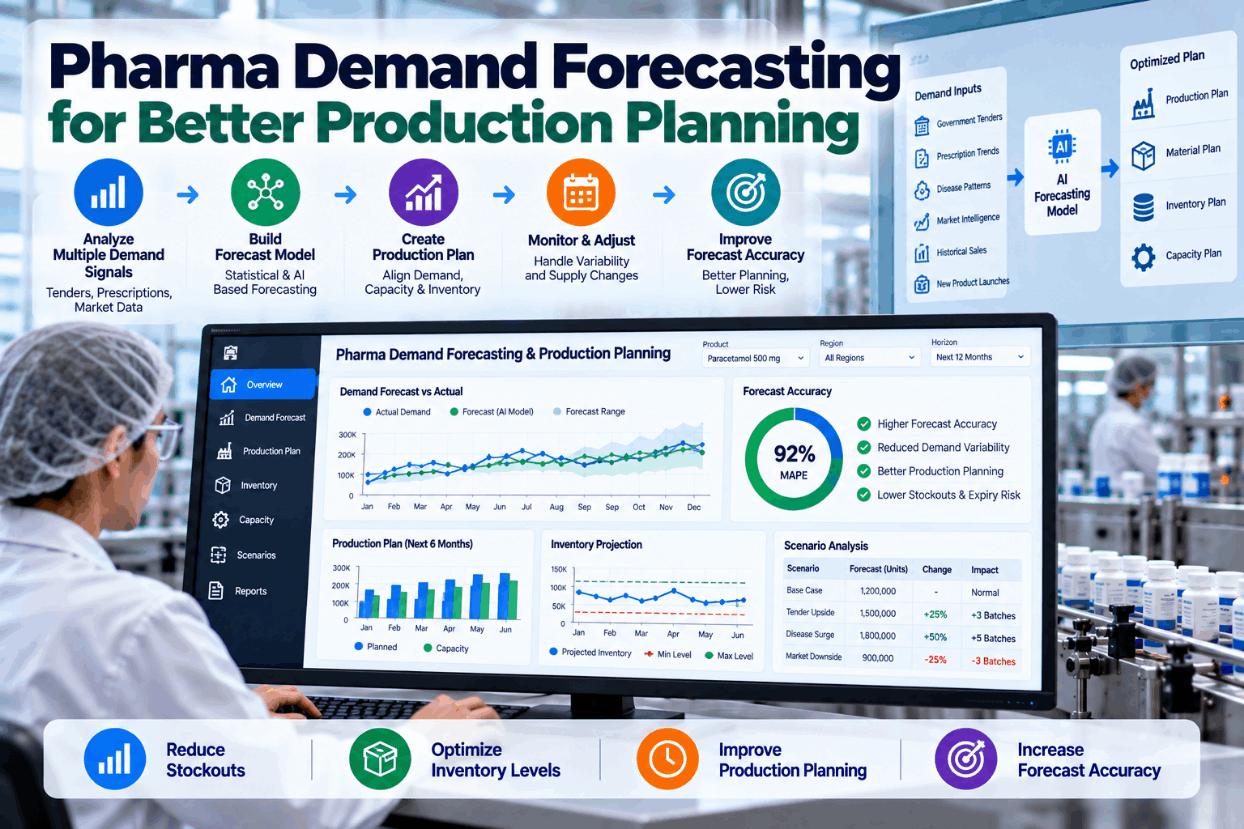
An automotive forecast can look right in total and still be wrong where it matters. Dealer orders lag the market, EV demand shifts the mix between lines, and fleet and tender orders arrive in lumps. A plan built on one blended number leaves the planning team short of one powertrain and long on another. AI forecasting combines dealer orders, market signals and mix shift into forecasts by model, variant and powertrain, with a range the S&OP meeting can plan against. This page covers the signals to use, a worked example and how to check the forecast. Planning teams can see it on their own order history in a forecasting walk-through.
AI Demand Forecasting for Automotive Manufacturers
Mix dealer orders, market signals and EV mix shift in one AI forecast by model, variant and powertrain, so the planning team schedules against a range, on a turnkey on-prem server.
- Dealer, retail, market and tender signals in one model
- Forecasts at the level you schedule, not only in total
- Ranges and what-if cases for the S&OP meeting
Why Automotive Demand Forecasts Miss
The total is rarely the problem. The mix is.
Most forecasts are judged on total volume, but lines, suppliers and shifts are planned by variant and powertrain. When the forecast is built in a spreadsheet from last year's orders and one planner's judgment, shifts in mix surface only after the schedule is frozen. Our production planning specialists can review where your forecast loses accuracy.
Lagging orders
Dealer orders trail the market.
Mix hidden in totals
A good total masks wrong variants.
Manual S&OP inputs
Spreadsheets merged by hand.
One number, no range
No view of the downside or upside.
The Signals an Automotive Forecast Should Use
Each signal answers a different question about demand.
The table is the template for the data inventory. Each line names a signal your company already holds, what it shows and how the forecast uses it. Start with the signals you can trust and add the rest in stages, since a smaller, clean data set beats a large, messy one. See it mapped to your data in a working session.
A forecast that is accurate in total can still be wrong for every variant. Track error by model, variant and powertrain, and weight it by volume, so the number reflects what the plant has to build.
A Worked Example: Right in Total, Wrong in Mix
Same total, different plant.
Take a model family planned at 10,000 units a month: 7,000 ICE, 1,500 hybrid and 1,500 EV. The month ends at 10,000 units again, but the actual mix is 6,500 ICE, 1,500 hybrid and 2,000 EV as EV share rises from 15 to 20 percent. All figures are illustrative.
See Your Own Demand Forecast by Variant
Bring your order and dispatch history, and we show a forecast by model, variant and powertrain, with its error measured against your own past months.
Plan Against a Range, Not One Number
EV share is the input that moves the most.
Using the same example, hold hybrid at 1,500 and let EV share vary. The total stays at 10,000 units, but the load on each line changes. Show all three cases in the S&OP meeting so the plant can agree how much flexibility it needs.
EV share 15%
EV about 1,500 units. ICE about 7,000 units.
EV share 20%
EV about 2,000 units. ICE about 6,500 units.
EV share 25%
EV about 2,500 units. ICE about 6,000 units.
Ask the Forecast What If
Change one assumption and see the plan move.
Planners can test a change in EV share, a new tender or a dealer stock correction during the meeting and see the forecast update. The answer comes from the same model as the dashboard. Try it on your own data in a live walk-through.
From Signals to the Production Schedule
A forecast is useful when the schedule can use it.
The forecast runs every cycle through the same five steps, and planners keep the final say on what goes into the plan. Plan the routine with our implementation team.
Collect
Orders, stock, retail and market data.
Forecast
Model, variant and powertrain volumes.
Review
Planners and S&OP agree the range.
Schedule
The agreed case feeds production plans.
Learn
Error is tracked and the model improves.
Automotive Demand Forecasting Best Practices
Trust comes from measuring the forecast, not from the model.
These are common gaps in automotive forecasting programs. A short readiness review can catch them before the first S&OP cycle.
What works
- Forecasts at variant and powertrain level
- Low, base and high cases in every S&OP
- Error tracked each month against actuals
- Fleet and tender orders kept separate
What fails
- Judging the forecast on total volume only
- Treating dealer orders as final demand
- Overriding the forecast with no record
- One number with no range
How iFactory Runs AI Demand Forecasting
Signals, forecasts and the schedule in one place.
iFactory connects to your order, dispatch and planning systems, combines the signals you choose and produces forecasts and ranges your planners can review. Everything runs on your on-prem server, and the forecast feeds production scheduling. Fit questions go to our solutions team.
Multi-signal forecast
Dealer, retail, market and tender data.
Mix-level forecasts
Model, variant and powertrain views.
Forecast ranges
Low, base and high cases.
What-if scenarios
Test EV share and tender changes.
Schedule link
The agreed case feeds the plan.
On-prem
Order and plan data stay in the company.
The figures and exchanges on this page are illustrative. Forecast accuracy depends on your order history, data quality, product mix and market conditions, and we measure it against your own past periods during the pilot. No accuracy level is guaranteed.
Turnkey AI: Delivered, Connected and Live in 6–12 Weeks
You do not build this. It arrives ready.
iFactory ships as a pre-configured NVIDIA AI server with the software pre-loaded, racked and ready. Rack it, plug in power and Ethernet, and the AI is live on your network. Our team handles cabling, network setup, ERP, MES, PLC and SCADA integration, planner training and 24×7 remote monitoring. Data stays on your network. For an implementation guide and a quote matched to your plant, request a turnkey quote.
Ship, network and connect data
Server installed. Order and dispatch history connected and checked.
Setup and back-test
Forecasts configured and tested against past months. Live pilot on a model family.
Go-live and S&OP review
Roll-out across model families. Planners trained. Error tracked each cycle.
Frequently Asked Questions
How does AI demand forecasting work for automotive manufacturers?
It combines signals such as dealer orders, stock, retail registrations, market conditions and powertrain mix, learns how they related to past demand, and produces forecasts by model, variant and powertrain with a range.
What data do we need to start?
Order and dispatch history by variant, dealer stock, retail or registration data and your current forecast and plan versions. Market data and tender pipelines can be added in stages.
How does it handle EV mix shift?
The forecast is built by powertrain, not only in total, and EV share is a visible input. Planners can test higher and lower EV shares and see the effect on each line before the plan is agreed.
How do we measure forecast accuracy?
Compare forecast with actual at the level you schedule, such as variant or powertrain, and weight the error by volume. The pilot back-tests the forecast against your own past months before it goes live.
How does it support the S&OP process?
It gives the meeting low, base and high cases, shows which signals moved the forecast and records planner overrides, so the agreed plan and its reasons are on record.
What are the best practices for planning teams?
Forecast at the level you schedule, keep tender and fleet orders separate, plan against a range, track error every month and record every override with a reason.
What does it cost and what is the return?
Cost depends on the number of plants, model families and systems connected, so we issue a turnkey quote after a short scoping call. The return depends on how much your forecast error costs in stock, overtime and missed orders, and the pilot measures it on your data.
How do we start?
Start with a short session on your order history and planning process. A 6-week pilot then connects your data, back-tests the forecast and runs it alongside your current plan for a model family. To plan it, contact our team.
Forecast Demand at the Level You Schedule
In thirty minutes we take your order history, build a forecast by variant and powertrain and show its error against your own past months. You keep the results either way.
- 1Order and dispatch history by variant
- 2Dealer stock and retail or registration data
- 3Your current forecast and plan versions
- 4Powertrain and EV mix assumptions
- 5Fleet and tender pipeline