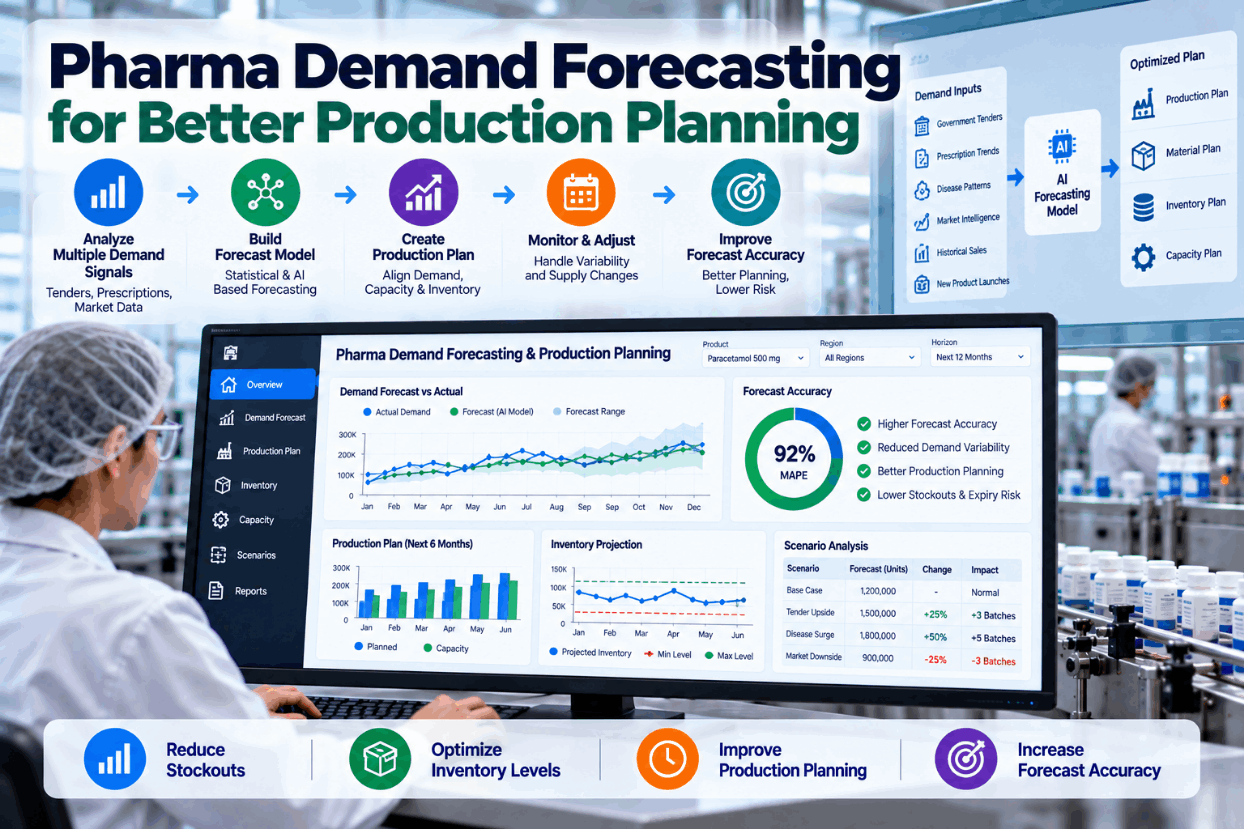
Pharma demand does not behave like consumer demand. It depends on public tenders that can double or erase a market overnight, on prescriptions shaped by guidelines and formularies, on disease seasons and outbreaks, and on launches and patent expiries that reset the whole picture. Yet many plants plan production from a single statistical forecast in a spreadsheet. The result is familiar: shortages of one product, excess stock of another and a schedule that changes every week. This guide explains the demand drivers that matter in pharma, how to forecast tenders, how to measure forecast quality and how to turn a forecast into a production plan that holds. To see demand-driven planning in practice, book a short walkthrough.
Pharma Demand Forecasting for Better Production Planning: Tenders, Prescriptions and Disease Patterns
Statistical, tender and event forecasts combined into one demand picture, linked to capacity and campaigns, so production plans survive contact with reality.
Why Pharma Demand Is So Hard to Forecast
Accenture’s pharmaceutical supply chain study found forecast error of about 33% for generics manufacturers, compared with around 12% for biologics, and reported that 60% of companies still ran sales and operations planning on spreadsheets. The same study estimated the industry wastes about $4 billion a year on expired or obsolete product. Poor forecasts cost on both sides: too little, and patients face shortages; too much, and product expires.
Shortages show the stakes. The US GAO reported 102 active drug shortages as of July 31, 2024, with demand increases a factor in 65% of them, up from 49% in 2019. Many of those are low-margin generics where plants have little spare capacity, so a demand surge that was not foreseen cannot be absorbed.
Better forecasting will not remove uncertainty, but it can make it visible and plan for it. We can review your current forecast process on a call.
The Demand Drivers That Matter in Pharma
A useful forecast separates demand into its drivers, because each behaves differently and needs a different method.
Public and hospital tenders award large volumes to one or few suppliers, so demand jumps or vanishes with each award.
Retail prescription demand follows trends in guidelines, formularies, prescriber habits and patient populations.
Respiratory, allergy and some antibiotic demand rises and falls with the seasons.
Epidemics and outbreaks can multiply demand for specific products in weeks.
Wholesaler and pharmacy stock changes can make shipments differ sharply from actual use.
New launches ramp up, and generic entry or withdrawals can cut demand quickly.
Most forecast errors come from treating these as one series. Splitting them lets each be forecast with the right method and reviewed by the people who understand it. See driver-based forecasts in a demo.
Forecasting Tender-Driven Demand
Tenders are the hardest part of pharma demand and the most important in many markets. They need scenario planning rather than a single number.
Tender outcomes should also feed back into win-probability estimates, so the next bid starts from evidence rather than instinct.
Buyers’ own estimates can be unreliable too. A 14-year study of South Africa’s public tenders found government demand estimates were off by more than 50% in most drug classes studied, so plants should track actual call-offs against tendered volumes rather than trusting stated quantities.
The same study found fewer firms winning contracts over time in many categories, which concentrates supply risk. Planning for tender swings is part of a resilient supply plan.
Measuring Forecast Quality the Right Way
You cannot improve a forecast without measuring it. Two measures matter most: error and bias.
Illustrative numbers. Error shows how far off each month was; bias shows whether the forecast leans consistently high or low.
Measure at the level decisions are made: product family for capacity, individual pack for scheduling.
Bias is often the more useful measure. A forecast with moderate error but no bias averages out over time; one with consistent bias drives steady overproduction or shortage. Track both by product group and driver, and at the lead time that matters for production decisions, not just one month ahead.
Forecast value added, comparing each adjustment with the statistical baseline, shows whether manual overrides help or hurt. It is a standard view in our forecast reports.
Turning the Forecast Into a Production Plan
A forecast only helps if it drives decisions. In pharma, that means linking it to campaigns, materials and capacity.
Driver-based forecast with scenarios for tenders and events.
Monthly consensus balancing demand, supply and finance.
Demand translated into campaigns on constrained equipment.
API and excipient needs planned against supplier lead times.
Campaigns sequenced with cleaning and changeover rules.
Safety stock sized to forecast error and supply risk.
Two horizons matter at once. The long horizon, months to a year or more, drives API purchases, campaign slots and capacity decisions, and needs a stable view of volume by product family. The short horizon, weeks, drives the detailed schedule and needs accuracy by pack and market. Mixing the two in one forecast usually serves neither well, so most planning processes keep them linked but separate.
Lead times set the horizon. API and some excipients can take months to source, and campaign slots on shared equipment fill early. The forecast must be good enough, far enough ahead, to support those decisions, even if near-term details change.
Connecting the forecast directly to campaign planning shows the capacity impact of each tender scenario before it is decided. We link them during integration.
Statistical and Machine Learning Approaches
There is no single best forecasting method. The right mix depends on the driver and the data available.
- Exponential smoothing and seasonal models
- Work well on steady prescription demand
- Easy to explain and audit
- Need little data per product
- Struggle with many external drivers
- Good baseline for comparison
- Learn from many drivers at once
- Use epidemiology, tenders and channel data
- Handle complex seasonal and event patterns
- Need more data and careful validation
- Harder to explain without good tooling
- Best judged against the statistical baseline
Most strong forecasting processes combine both: statistical baselines for stable demand, machine learning where external signals add real information, and human judgment for tenders and launches, all measured against each other.
Whatever the method, the forecast should explain itself: which drivers moved it and by how much. Ask our specialists how that works in practice.
Demand Forecasting Checklist for Pharma Plants
Use this checklist to strengthen forecasting and its link to production.
Most plants gain fastest by splitting demand by driver and measuring bias. Our team can help run a quick baseline assessment.
What Better Forecasting Is Worth
The value of better forecasting shows up in several places at once.
For a single plant, start by measuring current forecast error and bias, the cost of recent shortages and write-offs, and how often the schedule changes inside the frozen window. Those numbers frame a realistic case.
We can build that baseline from a few months of your data in a short assessment.
How iFactory Delivers Demand-Driven Production Planning
Tenders, prescriptions, seasons, channel and events modelled separately.
Win, lose and partial outcomes with probabilities and triggers.
Error, bias and value added by product group and horizon.
Scenarios translated into campaigns on constrained equipment.
API and excipient needs against supplier lead times.
One demand picture for sales, supply and finance.
It works with your ERP and existing planning tools. Bring a year of demand data and we will show a driver-based forecast in a session.
See Your Demand Split by the Drivers Behind It
Share two years of sales, tender and shipment data for a product family. We build driver-based forecasts, measure error and bias and show the capacity impact of each tender scenario.
Tender award expected in 6 weeks. Win scenario adds 38% to Q3 demand and exceeds planned campaign capacity.
A Tender Decision With the Capacity View
This exchange shows how a supply planner might use iFactory ahead of a tender award.
iFactory ships as a pre-configured NVIDIA AI server, racked and ready with the demand forecasting and planning analytics models loaded. Rack it, plug in power and Ethernet, and the AI is live on your network. Our scope covers sensors and data connections across planning, ERP and production systems, PLC/SCADA, MES, LIMS and ERP integration, cabling and network setup, operator and quality team training, and 24×7 remote monitoring.
Server installed, sensors and system links live, historical batch, lab and maintenance records loaded.
Models trained on your own batches and equipment, then run in parallel on one area with your quality and engineering teams reviewing every output.
Rollout to the agreed areas under your change control and validation procedures, team training and 24×7 remote monitoring in place.
Software, server and integration come as one package. For pricing across your portfolio, contact our sales team.
Frequently Asked Questions
Demand is driven by tenders that award large volumes to few suppliers, prescription trends, disease seasons and outbreaks, channel stock movements and product launches or generic entry, each behaving differently.
Accenture’s supply chain study reported forecast error of around 33% for generics manufacturers and around 12% for biologics. Accuracy varies widely by product and driver.
With scenarios rather than a single number: a tender calendar, win probabilities, win, lose and partial volume profiles, and decision dates for materials and capacity.
Track error, such as mean absolute percentage error, and bias by product group, measured at the lead time that matters for production decisions.
Through S&OP, the forecast is translated into campaigns on constrained equipment, material plans against supplier lead times and safety stock targets.
A first product family can usually be forecast and linked to capacity within a 6–12 week rollout. Plan it with our planners.
Plan Production on Demand You Actually Understand
iFactory forecasts pharma demand by its real drivers, puts numbers on tender risk and links every scenario to capacity and materials, so plans stay stable and shelves stay stocked.
Illustrative. Tender-driven products carry the widest error and need scenario planning.