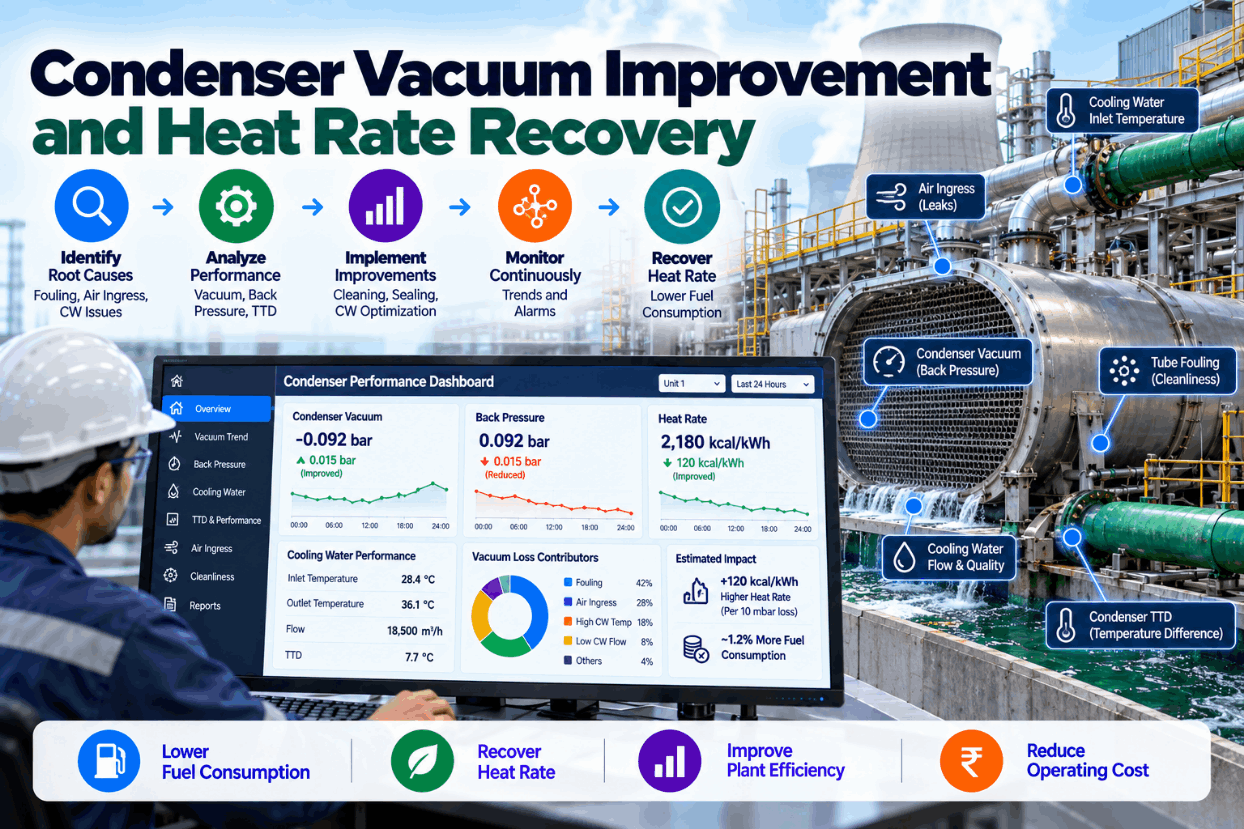
The condenser sets the back end of the steam cycle. When vacuum is poor, the turbine exhausts against higher pressure, extracts less work from every kilogram of steam and the unit burns more fuel for each megawatt-hour. Few single parameters move heat rate as much, and few are as often accepted as normal. Vacuum loss usually comes from a handful of causes: fouled tubes, air in-leakage, low or warm cooling water, and struggling air removal equipment. This guide explains how to measure vacuum performance against what it should be, how to tell the causes apart, what each fix is worth and how to keep the gains across the whole cooling water cycle. To see a condenser deviation analysis on your unit, book a short walkthrough.
Condenser Vacuum Improvement and Heat Rate Recovery: Find the Cause, Put a Number on the Fix
Backpressure compared with what it should be at every load and cooling water condition, with the loss split between fouling, air ingress, cooling water and air removal.
Why Condenser Vacuum Hits Heat Rate So Hard
Every steam turbine is designed for an exhaust pressure. When the condenser cannot hold it, the last stages of the low-pressure turbine do less work, and the same steam flow produces less power. In turbine-follow operation the unit burns more fuel to hold load; in boiler-follow operation it simply produces less. Either way, heat rate rises.
The size of the effect depends on the unit, its turbine design and where it operates on the exhaust loss curve, so any single rule of thumb should be treated with care. Published examples show the scale. POWER magazine describes a plant where cutting condenser pressure from 3 to 1 inch of mercury would improve heat rate by nearly 6%. A technical paper from Conco on a 452.75 MW unit showed heat rate rising by about 140 Btu/kWh as backpressure went from 2.68 to 4.0 inches of mercury. One inch of mercury is about 33.9 mbar.
Because the effect is unit-specific, the first job is to calculate what vacuum loss costs on your own unit using its correction curves. We can walk through that calculation on a call.
The Condenser KPIs That Tell the Real Story
Raw backpressure is not enough. It changes naturally with load and cooling water temperature. These KPIs separate normal variation from real loss.
Expected backpressure is the anchor. Without it, a hot afternoon looks like a condenser problem and a cool night hides a real one. We build that expected curve for each unit during set-up.
Telling the Causes Apart
Each cause of vacuum loss leaves a different pattern across the KPIs. Reading them together points to the fix.
| Pattern | Most likely cause | Confirm by | Typical fix |
|---|---|---|---|
| TTD rising slowly over weeks, oxygen normal | Tube fouling or scaling | Cleanliness factor trend, tube inspection | On-load ball cleaning or off-load cleaning |
| Subcooling and dissolved oxygen rising, air flow up | Air in-leakage | Helium or tracer leak test | Seal glands, joints, valves and expansion bellows |
| Cooling water rise high, TTD normal | Low cooling water flow | Pump performance, waterbox pressure loss | Clear debris, restore pump capacity |
| Inlet temperature high, TTD normal | Warm cooling water supply | Cooling tower approach | Tower repairs, fan and fill work |
| Air flow at pump limit, vacuum unstable | Weak air removal | Vacuum pump or ejector test | Service pump, check seal water temperature |
| Sudden step change | Tube leak isolation, debris, valve change | Event log | Investigate the event |
Most units have more than one cause at a time. Splitting the deviation between them, even approximately, lets the team fix the largest first. That split is standard in our vacuum reports.
Putting a Number on Vacuum Loss
Here is how a daily vacuum deviation turns into a fuel cost. The numbers are illustrative; use your own unit’s correction curve.
Illustrative figures. The correction factor varies widely by unit and load, so always use the turbine maker’s curve or a calibrated model.
Multiply the penalty by generation and fuel cost and the value of a fix becomes clear. It also shows how to rank fixes: a cleaning that recovers 6 mbar is worth more than a leak repair that recovers 1 mbar, even if the leak is easier to find.
Tracking the daily penalty turns vacuum from a technical parameter into a cost line the whole station watches. That view is part of the dashboard.
Finding and Fixing Air In-Leakage
Air in-leakage is the most elusive cause of vacuum loss. Air blankets tube surfaces, reduces heat transfer and raises dissolved oxygen, which also increases corrosion risk.
Rising air removal flow, subcooling and dissolved oxygen.
Isolate air removal briefly to measure the rate of vacuum decay, under a controlled procedure.
Use helium or other tracer gas around suspect joints with a detector on the air removal exhaust.
Rank leaks by size and ease of repair; some wait for an outage.
Seal the leak and confirm air flow and oxygen return to normal.
Common leak points include turbine gland seals, low-pressure heater and drain connections, expansion joints, valve glands under vacuum, instrument connections and rupture discs. A survey after every outage is good practice, because work on the vacuum boundary often disturbs seals.
Trending air flow continuously means new leaks are noticed in days, not at the next test. Our engineers set the alert levels per unit.
Vacuum Depends on the Whole Cooling Water Cycle
The condenser is only as good as the cooling water reaching it. Many vacuum problems start outside the condenser.
River, sea or tower temperature sets the floor for achievable vacuum.
Worn cooling water pumps or running fewer pumps than needed cut flow and raise the temperature rise.
Blocked travelling screens and tube sheets reduce flow and cause hot spots.
Poor tower performance raises cold water temperature for every unit it serves.
Cycles of concentration and treatment decide how fast tubes foul.
Ball cleaning systems only help if balls circulate and are recovered.
Looking at the whole cycle avoids fixing the condenser when the real problem is a tower cell or a pump. The same data supports cooling water optimization, covered in our cooling guide.
Condenser Vacuum Monitoring Checklist
Use this checklist to set up continuous condenser performance monitoring.
Most plants already have the instruments. The missing pieces are usually the expected backpressure model and the cost view. Ask our support team for a sample report.
What Condenser Improvements Are Worth
The value of vacuum recovery comes from fuel, and sometimes from capacity.
Sargent & Lundy’s estimates cited by EIA put condenser cleaning at around 70 Btu/kWh of heat rate improvement for a typical coal unit, and POWER describes an average 0.35 inHg vacuum gain from cleaning worth 30–70 Btu/kWh. Your own number comes from your deviation and correction curve.
Most plants find the largest gain in the first cleaning or leak campaign guided by data. We help size it in a performance review.
How iFactory Delivers Condenser Vacuum Improvement
Calibrated for each unit, load and cooling water condition.
Deviation divided between fouling, air, flow and temperature.
Heat rate and fuel penalty per day, per unit.
Air flow, subcooling and oxygen trends watched continuously.
On-load and off-load cleaning triggered by recoverable value.
Condenser, pumps and tower seen as one system.
It works with your DCS, historian and performance calculation tools. Share a month of data and we will show your vacuum losses in a session.
See What Your Vacuum Deviation Really Costs
Share a month of condenser and cooling water data. We build expected backpressure for your unit, split the deviation by cause and show the daily heat rate penalty.
Backpressure is 11 mbar above expected for today’s load and cooling water temperature. TTD rising, dissolved oxygen normal: pattern points to tube fouling, not air ingress.
A Vacuum Loss Diagnosed in Minutes
This exchange shows how a performance engineer might use iFactory at the morning meeting.
iFactory ships as a pre-configured NVIDIA AI server, racked and ready with the condenser performance and heat rate analytics models loaded. Rack it, plug in power and Ethernet, and the AI is live on your network. Our scope covers sensors and data connections across condensers, cooling water and air removal systems, DCS, PLC/SCADA, historian and ERP integration, cabling and network setup, operator and quality team training, and 24×7 remote monitoring.
Server installed, DCS and historian links live, historical operating, performance and maintenance data loaded.
Models calibrated on your own unit data, then run in advisory mode on one unit with your operations and performance engineers reviewing every output.
Rollout to the agreed units under your change management, operator and engineer training, and 24×7 remote monitoring in place.
Software, server and integration come as one package. For pricing on your units, contact our sales team.
Frequently Asked Questions
Higher condenser pressure means the turbine exhausts against more back pressure and produces less work per unit of steam, so more fuel is needed per MWh. The size of the effect depends on the unit and must come from its correction curves.
The main causes are tube fouling or scaling, air in-leakage, low cooling water flow, warm cooling water from the tower or source, and weak air removal equipment.
Fouling raises terminal temperature difference slowly while dissolved oxygen stays normal. Air in-leakage raises subcooling, dissolved oxygen and air removal flow.
The condenser pressure the unit should achieve at current steam flow, cooling water temperature and flow. Comparing actual with expected shows the real deviation.
Ideally when the cost of fouling exceeds the cost of cleaning, based on trended cleanliness and deviation, rather than on a fixed calendar.
A typical rollout takes 6–12 weeks, including data links, expected backpressure models and advisory use on one unit. Plan it with our engineers.
Recover the Heat Rate Hiding in Your Condenser
iFactory compares vacuum with what it should be, finds the cause and prices every fix, so cleaning, leak repairs and tower work happen when they pay back most.
Deviation from expected backpressure split by cause, so each fix has a number attached.