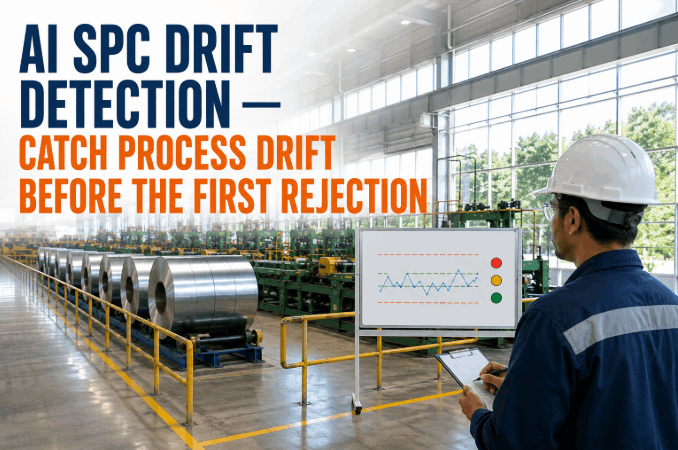
On a 500 MW coal-fired unit, a heat rate that drifts just 11 Btu/kWh above target costs about $93,540 a year in extra fuel. Push that deviation to 100 Btu/kWh — still under 1.5% of a typical heat rate — and the cost passes $850,000. And the number that actually shows up in the monthly performance report is almost always well past 100. That is the uncomfortable arithmetic of heat rate: the drift is small enough that nobody sees it, and expensive enough that everybody pays for it. The monthly report is a bill, not a warning. What plants need is a way to catch the deviation while it is still developing — while a condenser back-pressure trend, a feedwater heater TTD creep, or a slow excess-air drift is still worth 5 Btu/kWh instead of 50. That is exactly the problem statistical process control solves. iFactory SPC on net heat rate puts control limits and pattern rules on the same data your DCS already collects, so drift shows up as a signal weeks before it shows up in the fuel bill.
iFactory SPC for Heat Rate
Catch Heat Rate Drift Weeks Before It Shows in the Fuel Bill
Trend net heat rate against the machine's own baseline, decompose the deviation loss-by-loss, and flag the drift while it's still 5 Btu/kWh instead of 50.
$8,504
per 1 Btu/kWh, 500 MW/yr
$93K
from just 11 Btu/kWh drift
2%
typical annual degradation
Monthly
is too late to react
The Cost of a Deviation Nobody Notices
Heat rate is measured in Btu/kWh, and the numbers look small — a few units of drift feels like nothing next to a 10,000 Btu/kWh baseline. But every Btu/kWh multiplies against fuel cost, capacity factor, and 8,760 hours a year. This is what the arithmetic actually looks like on a typical 500 MW coal unit.
1 Btu/kWh drift
$8,504 / year
11 Btu/kWh drift
$93,540 / year
50 Btu/kWh drift
$425,200 / year
100 Btu/kWh drift
$850,400 / year
200 Btu/kWh drift
$1.7M / year
Basis: 500 MW coal unit, 85% capacity factor, ~$2.00/MMBtu fuel, 88% boiler efficiency, 8,760 hr/yr. Every drift is a bill — the only question is how soon it gets caught.
Why the Monthly Report Is Too Late
Almost every plant tracks heat rate. Very few catch drift early. The problem is timing — the numbers exist, but by the time they are aggregated, reviewed, and explained, the deviation has already been paying itself into the fuel bill for weeks. SPC changes what happens between the reading and the response.
Monthly performance report
Reading About It After the Fact
Aggregated once a month, reviewed once more
Drift buried under load and ambient noise
Deviation known after weeks of extra fuel
Root cause guessed from lagging data
Corrective action decided next quarter
iFactory SPC on Net Heat Rate
Catching the Drift as It Happens
Live UCL / LCL from the unit's own baseline
Normalized for load, ambient, and coal quality
Drift flagged inside the warning band
Loss-by-loss decomposition points to the cause
Work order fires this shift, not next quarter
Decomposing the Deviation — Where the Btu/kWh Goes
A total heat rate deviation is not a diagnosis — it is a symptom. The real value of running SPC on heat rate is the ability to decompose the drift into the individual controllable losses that make it up, so the chart doesn't just say "efficiency is dropping," it says "condenser back-pressure is drifting up and accounting for 18 of your 32 Btu/kWh gap."
32%
Condenser back-pressure
Fouled tubes, air ingress, or CW temperature rise. One of the biggest single levers on a typical steam unit — and one of the fastest to trend.
22%
Feedwater heater TTD/DCA
Rising terminal temperature difference means fouling or a level control issue. Small drifts here add real Btu/kWh quickly.
18%
Excess air / O₂ drift
O₂ creeping outside the band pushes flue gas losses up. Small numbers, steady bleed on the fuel bill.
14%
Turbine cylinder efficiency
HP and IP cylinder efficiency dropping shows up as pressure and temperature deviations vs. the expansion line.
14%
Boiler outlet temperature
Superheater / reheater outlet drifting off design, or attemperator use rising — both signal boiler-side issues that hit heat rate directly.
Want to see this decomposition on your own unit? Book a demo — bring 90 days of PI or DCS history and we'll show which losses are eating your Btu/kWh.
The SPC Signals That Fire First
Heat rate is a slow-drift signal by nature. That's exactly the shape SPC is best at catching — long before a threshold alarm would even consider firing.
1
Sustained trend
Seven or more points drifting in one direction — the classic degradation signature. Fouling, wear, and thermal cycling all show up this way first.
2
Shift in mean
Nine or more points on one side of the mean after a startup, load change, or maintenance event. A new baseline that shouldn't be there.
3
Widening range
The R-chart opens up before the mean moves. Controllers hunting, valve wear, or load-following instability — early instability warnings.
4
Points near warning band
Two of three inside the warning zone. Not yet an issue, but the machine is quietly asking for attention before the next drift starts.
Making the Baseline Actually Fair
SPC on heat rate only works if the baseline is honest — otherwise the chart lights up every time load changes or the seasons shift. The whole game is normalizing out the things you can't control before you draw the control limits.
Load correction
Heat rate rises at part load — that's physics, not degradation. Baseline is built per load band, not as one number.
Ambient correction
Cooling water temperature and ambient air conditions move condenser vacuum. The chart adjusts for it before flagging drift.
Fuel quality correction
GCV, moisture, and ash tied in from coal analysis — so a fuel change doesn't get read as an efficiency loss.
Steady-state gating
Load ramps, startups, and shutdowns are excluded from the SPC calculation, so transients don't muddy the signal.
How iFactory Runs the Loop
SPC only pays back if the signal converts into an action. iFactory takes the fired rule, points it at the loss driving the drift, and routes a work order to the right team with a deadline.
01
Ingest & Normalize
DCS/PI tags for MW, fuel, steam, feedwater, ambient — pulled live and corrected for load, ambient, and fuel quality.
02
Compute Live Heat Rate
Net heat rate calculated every interval, alongside a decomposition of controllable losses.
03
Apply Control Rules
Western Electric and Nelson rules fire on drifts, shifts, and warning-band clusters against the baseline.
04
Attribute the Loss
The decomposition points to the specific loss driving the drift — condenser, FWH, excess air, cylinder efficiency.
05
Verify Return to Baseline
Post-action chart confirms the loss dropped and the mean returned to baseline — CAPA closes with statistical proof.
What Catching Drift Early Delivers
Heat rate is one of the few metrics where every unit of improvement translates directly to fuel dollars. These are the outcomes plants typically see after moving from monthly reports to live SPC on net heat rate.
Weeks
Earlier detection
of degradation vs. monthly reporting
$M+
Fuel protected
per unit, per year on typical drifts
Loss-level
Root cause
from decomposition, not guesswork
Lower
CO₂ per MWh
as recovered heat rate reduces fuel burn
Curious what a 50 Btu/kWh recovery is worth on your specific unit? Talk to our performance team — we'll size it against your coal cost and PLF.
Frequently Asked Questions
How is SPC on heat rate different from what we already do in the monthly report?
The monthly report tells you what happened. SPC tells you it's happening. The report aggregates across weeks of load, ambient, and fuel variation and gives you a single number to explain after the fact. SPC computes heat rate live against a normalized baseline and fires the moment a real drift starts — usually weeks earlier, with the specific loss identified.
Won't the chart fire every time load or ambient changes?
Only if the baseline is naive. iFactory normalizes for load, ambient conditions, and fuel quality before drawing control limits, and gates the calculation to steady-state operation. That means a load ramp, a hot day, or a shift to poorer coal doesn't get read as degradation — but a real drift under those same conditions still does.
How much heat rate improvement is realistic?
Catching a 50 Btu/kWh drift on a 500 MW coal unit is worth roughly $425,000 a year in fuel; catching 100 Btu/kWh is worth more than $850,000. Most units carry drifts in that range for months without noticing. The savings come from acting on the drift when it's still worth 20 Btu/kWh instead of 100 — which is exactly what SPC gives you.
Does this integrate with our DCS or historian?
Yes. iFactory reads the tags you already have — MW, fuel flow, steam conditions, feedwater flow, ambient, condenser vacuum — from the DCS or historian (PI, GE Historian, AVEVA), runs the normalization and SPC engine on top, and returns loss decomposition and rule-fire events into a single view. The instrumentation stays as it is.
Can we see it running on our own data before committing?
Yes. Bring one unit and 60–90 days of DCS or historian data. We'll build the normalized baseline, run the SPC engine against your actual history, and show every drift that would have been flagged and how many weeks ahead of the monthly report it would have caught. Book a demo and we'll walk it live.
Stop finding out in the monthly report.
See SPC on Net Heat Rate — On Your Own Unit
Bring one unit and one 90-day trend. We'll normalize for load, ambient, and fuel, compute your real baseline, run the pattern rules against actual history, and show exactly how many Btu/kWh — and how many fuel dollars — SPC would have saved you.