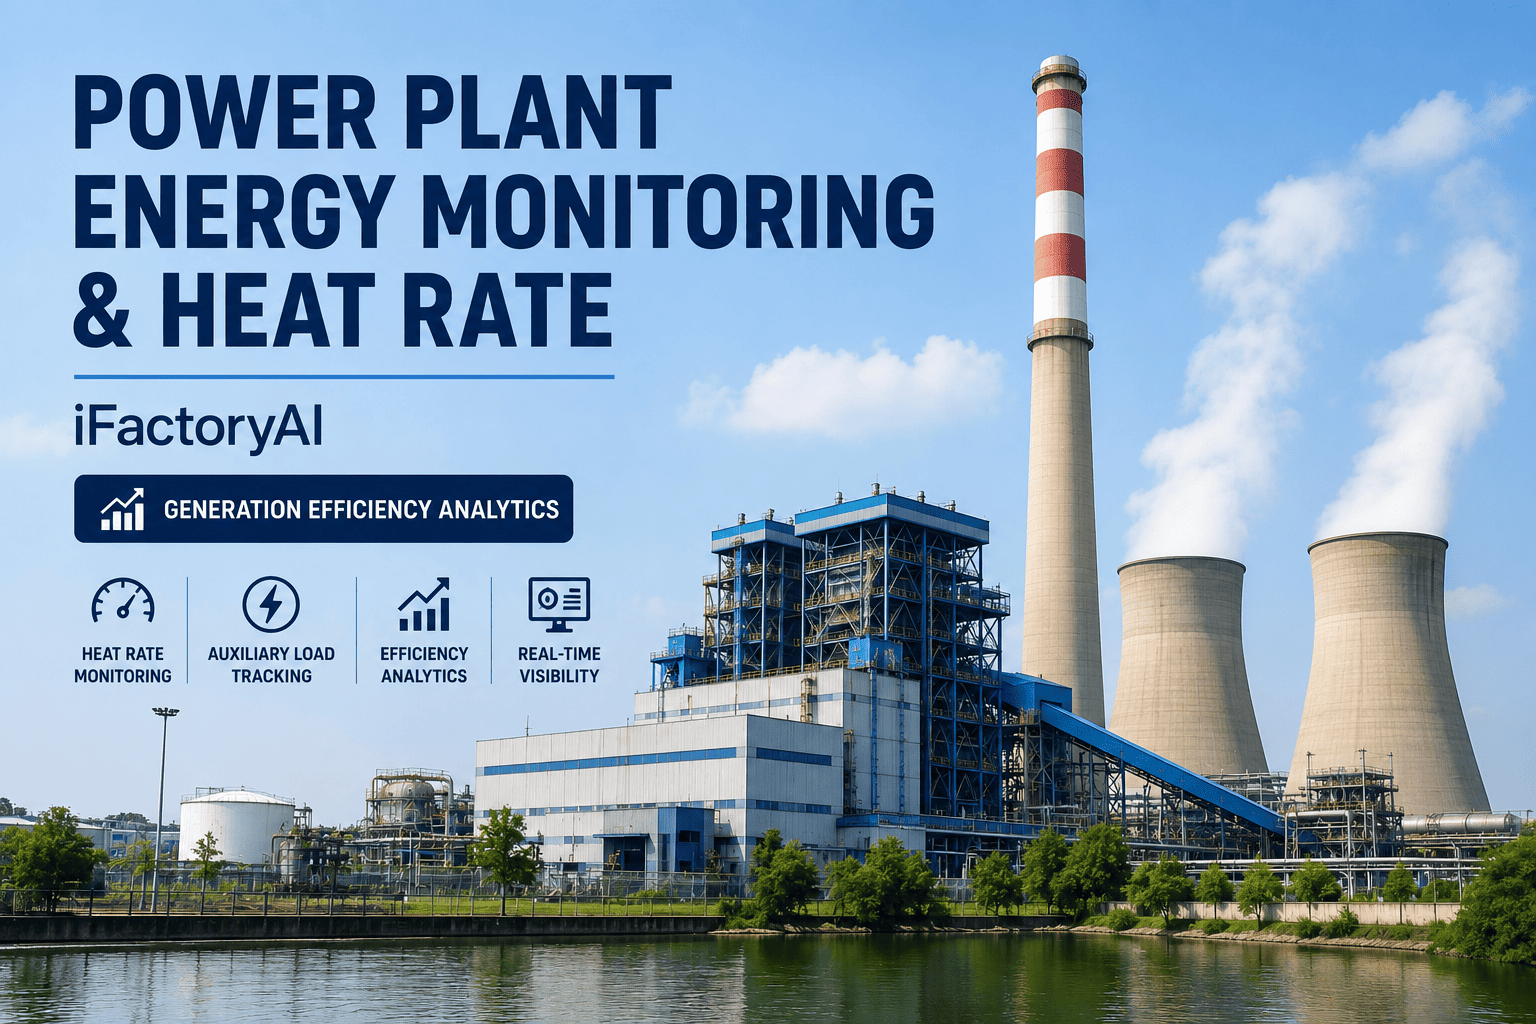
Condenser back-pressure and cooling tower approach are two of the quietest ways a power plant leaks efficiency. A cleanliness factor drifting from 90% to 82% doesn't trigger any alarm — it just adds 30-70 Btu/kWh to your heat rate every hour of every day. A cooling tower approach creeping from 5°F to 8°F doesn't warn anybody — it just raises circulating water temperature and pushes condenser back-pressure up. In one documented case at a coal-fired plant, restoring 1.5°F of TTD alone recovered about 50 Btu/kWh of heat rate. The numbers are real, and the losses are recoverable — but only if somebody catches the drift while it's still small. Threshold alarms won't. The values live inside the normal operating band, and the trend hides under daily load and ambient noise. That's exactly the shape statistical process control was invented to catch. iFactory SPC on the cold end puts control limits, warning bands, and pattern rules on top of the same TTD, back-pressure, and approach data you already collect — so a fouling condenser or a degrading tower gets flagged in the first week of drift, not the third month.
iFactory SPC for Cold-End Performance
Catch Condenser Fouling and Cooling Tower Drift Before Heat Rate Slips
Trend TTD, back-pressure, cleanliness factor, and cooling tower approach together — with control limits and pattern rules that fire while the loss is still 5 Btu/kWh instead of 50.
50
Btu/kWh from 1.5°F TTD
1.0"
Hg BP penalty from fill fouling
10×
lower k in scale vs. metal
85%
CF threshold for cleaning
The Cold-End Loop and Where SPC Watches It
Every cold-end problem shows up at one of four measurement points — and each one has a KPI SPC can track against its own baseline. When they all move together in a coordinated pattern, the diagnosis is usually obvious; when only one drifts, SPC tells you exactly which system to look at.
1
Turbine Exhaust
Back-pressure (inHg)
Rising BP hits heat rate first. SPC sees drift before it crosses the alarm line.
2
Condenser Tubes
TTD °F, Cleanliness Factor
Fouling raises TTD and drops CF. Both drift slowly and steadily — perfect SPC signal.
3
Cooling Tower
Approach °F, Range °F
Fill degradation and drift raise approach. SPC on daily readings catches it early.
4
CW Return
CW inlet temp, ΔT
If CW inlet is drifting up, the tower is the culprit — not the condenser. SPC separates them.
The value of watching all four is being able to attribute the loss — condenser back-pressure rise from a condenser problem gets a different work order than back-pressure rise from a tower problem.
Anatomy of a Back-Pressure Penalty
A rising condenser back-pressure isn't one problem — it's the sum of two. Total BP Penalty splits cleanly into TR (temperature rise) contribution and TTD contribution. In a well-documented case at an Arkansas plant, cooling tower fill that fouled the condenser caused a 1.0 inHg BP Penalty made up of 0.4 inHg from higher TR and 0.6 inHg from higher TTD. SPC lets you see the split live.
Elevated cooling water temperature rise across the condenser — usually points at the cooling tower or the CW system: fouled fill, plugged screens, reduced CW flow, or ambient conditions the tower can't shed.
Terminal temperature difference climbing — points at the condenser itself: tube fouling, air ingress, or SJAE performance degradation. Rising TTD with steady TR is a condenser signal, not a tower signal.
Total BP Penalty (documented case)
1.0 inHg
The Four Cold-End KPIs SPC Trends
Each of these is measured continuously. Each moves slowly enough that a threshold alarm catches nothing. Each is exactly the kind of signal SPC turns into an actionable warning.
TTD
Terminal Temperature Difference
Difference between condenser saturation temperature and CW outlet. The most direct condenser fouling signal — a 1.5°F rise is worth about 50 Btu/kWh.
SPC catches: slow upward trend, step change after outage, seasonal creep
CF
Cleanliness Factor
Ratio of actual to design heat transfer coefficient. Dropping below 85% typically triggers a tube-cleaning work order; SPC sees the drift long before the 85% line.
SPC catches: sustained downward trend, widening range vs. baseline
BP
Condenser Back-Pressure
Vacuum in the condenser. The bottom line of cold-end performance — every inHg of penalty translates directly to heat rate and MW output loss.
SPC catches: drift beyond normal ambient response, load-normalized creep
APP
Cooling Tower Approach
CW outlet temperature minus wet-bulb. Rising approach means the tower is losing capability — fill fouling, blowdown chemistry, or fan performance drifting.
SPC catches: humidity-corrected trend, load-band shift, seasonal outlier
Want to see these four KPIs running on your own CW loop? Book a demo and bring 90 days of DCS or PI history.
Attributing the Loss — Which System Is Actually Drifting
Rising back-pressure alone doesn't tell you what to fix. The pattern of movement across all four KPIs does. This is the diagnostic table SPC essentially builds for you in real time.
| Pattern seen |
Condenser |
Cooling tower |
Ambient |
Likely cause |
| BP up, TTD up, CF down, CW inlet flat |
Drifting |
Steady |
Steady |
Tube fouling / air ingress |
| BP up, TTD steady, CW inlet up, approach up |
Steady |
Drifting |
Steady |
Tower fill or CW flow issue |
| BP up, CW inlet up, approach steady |
Steady |
Steady |
Hot / humid |
Ambient limitation — not a fault |
| BP step change, all others step |
Post-outage |
Post-outage |
Steady |
New baseline after maintenance |
| BP up, TTD widening (R-chart) |
Unstable |
Steady |
Steady |
Partial tube plugging / debris |
How iFactory Runs the Loop
SPC on the cold end pays back only if the fired rule reaches the right work order. iFactory ties every pattern to a specific inspection playbook with owner and deadline — and closes the loop on statistical proof that the loss was recovered.
01
Ingest & Correct
CW, TTD, BP, tower, and ambient tags read from DCS/PI. Values corrected for load and wet-bulb before the SPC engine runs.
02
Baseline & Bands
UCL, LCL, and warning bands built from the unit's own steady-state history — per KPI, per load band.
03
Run Rule Engine
Nelson and Western Electric rules fire on trends, shifts, and warning-band clusters across all four KPIs at once.
04
Attribute & Route
The pattern across KPIs maps to a specific system — condenser cleaning, tower inspection, air-ingress hunt, SJAE test.
05
Verify Return
Post-action chart confirms KPIs returned to baseline — CAPA closes with statistical proof and quantified Btu/kWh recovered.
What Catching Cold-End Drift Delivers
Cold-end losses are almost pure margin — every point of heat rate recovered translates directly to fuel dollars. These are the outcomes plants typically see after moving from monthly performance meetings to live SPC on TTD, CF, BP, and approach.
50+
Btu/kWh recovered
from a single 1.5°F TTD restoration
Weeks
Earlier warning
on fouling and tower degradation
Cleaning
On condition
instead of on the calendar or on failure
Loss
Attributed
to the right system — no more finger-pointing
Curious what a 1 inHg BP Penalty recovery is worth on your unit? Talk to our performance team — we'll size it against your coal and PLF.
Frequently Asked Questions
Isn't monthly CF trending enough to catch condenser fouling?
Only if you're willing to accept a month's worth of fuel cost per catch. Cleanliness factor drops slowly and steadily — the classic SPC signal. By the time monthly review flags CF under 85%, the drift has been running for weeks. Live SPC on TTD and CF catches the same trend in the first week, when it's still worth 5-10 Btu/kWh instead of 50 or more.
How does SPC separate a condenser problem from a cooling tower problem?
By watching all four cold-end KPIs together and looking at the pattern. Rising BP with rising TTD but steady CW inlet points at the condenser. Rising BP with steady TTD but rising CW inlet and rising approach points at the tower. Rising BP with rising CW inlet but steady approach is usually just ambient. The attribution comes from the shape, not from any single reading.
Won't a hot day or high humidity trigger constant false signals?
Only with a naive baseline. iFactory corrects for wet-bulb, load, and CW flow before drawing the control limits, so a 40°C ambient day doesn't get read as a tower fault — but a real drift under those same conditions still does. Cooling tower approach is calculated against wet-bulb; condenser TTD is calculated against saturation temperature at actual load. Both stay meaningful across the seasons.
How much heat rate is realistically at stake?
One published case study restored 1.5°F of TTD by clearing tower fill debris from the condenser inlet and recovered ~50 Btu/kWh of heat rate. A 1.0 inHg BP Penalty split between TR and TTD is even more common on aging units. On a 500 MW coal unit, that adds up to hundreds of thousands of dollars a year in fuel — recoverable margin sitting on the cold end.
Can we see this on our own data before committing?
Yes. Bring one unit and 60–90 days of TTD, BP, CW temperature, and tower approach history from your DCS or historian. We'll build the normalized baseline, run the SPC engine against actual conditions, and show which drifts would have been flagged and how many Btu/kWh they were worth. Book a demo and we'll walk it live.
Stop losing heat rate at the cold end.
See SPC Running on Your Own Condenser and Tower Data
Bring one unit and 90 days of TTD, CF, BP, and approach history. We'll normalize for load and wet-bulb, run the pattern rules on your actual readings, and show exactly which drifts SPC would have caught weeks before your monthly performance meeting did.
TTD BP CF APP
tracked together
Load
& wet-bulb corrected