The cooling water system decides how well a thermal plant can reject heat, and it spends a lot of energy doing it. Cooling water pumps and tower fans are among the largest auxiliary loads, and the temperature they deliver to the condenser drives vacuum and heat rate. Water is a third pressure: in water-stressed regions, consumption limits are tight and rising. Optimizing the cooling water cycle means balancing all three: auxiliary power, heat rate and water use. This guide explains the system, the KPIs that matter, the levers operators can pull, the water balance and how to find the best combination as weather and load change. To see a cooling water optimization study, book a short walkthrough.
Cooling Water System Optimization in Power Plants: Heat Rate, Water Use and Auxiliary Power Together
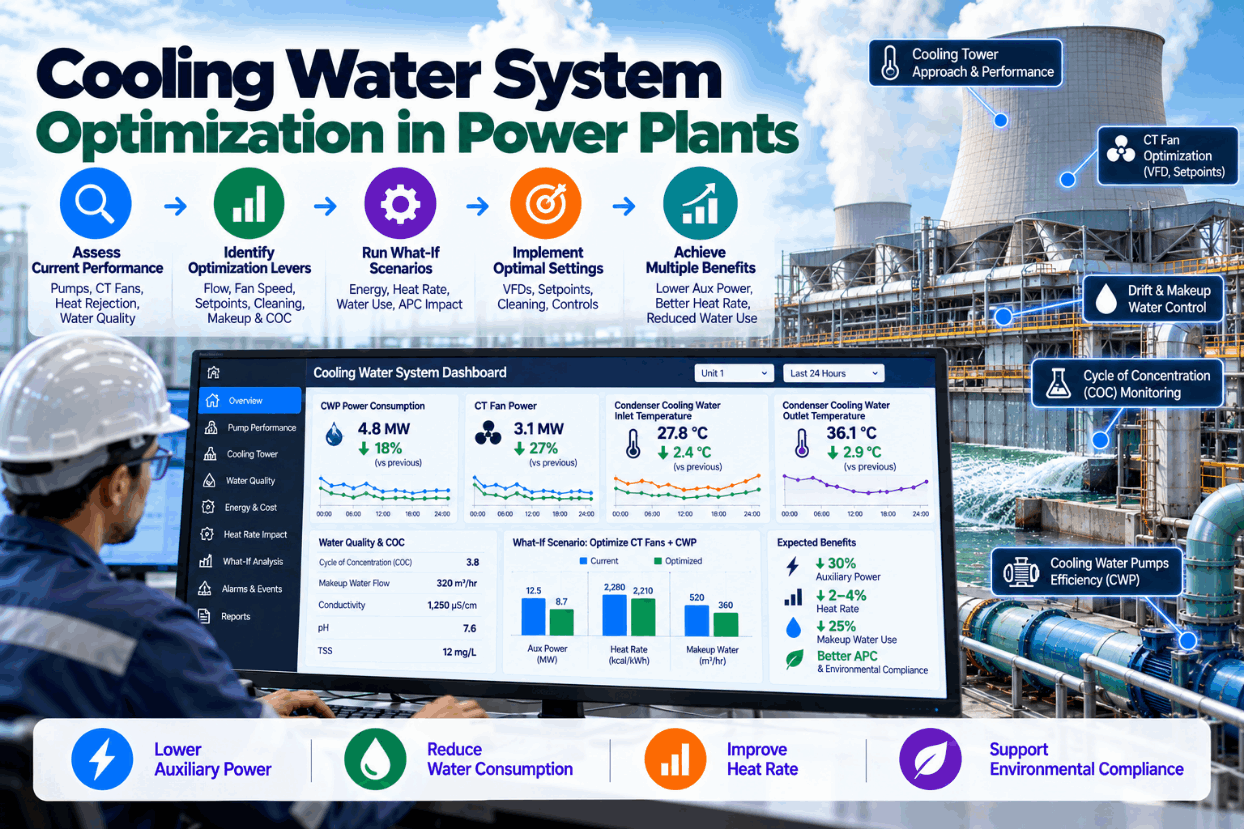
Pumps, fans, tower cells and water chemistry run as one system, so every change is judged on its combined effect on vacuum, auxiliary power and consumption.
Why the Cooling Water Cycle Is Often Run by Habit
Cooling water systems are often operated on fixed rules: a set number of pumps per unit, fans switched on by season, tower cells cleaned on a calendar. Those rules are simple and safe but ignore the trade-offs. Running an extra pump or fan improves vacuum, but only sometimes by enough to pay for its power. On a cool night, the extra flow may buy almost nothing. On a hot afternoon, it may be worth several megawatts.
The auxiliary load is significant. POWER magazine notes that water pumping systems typically need 8 to 12 horsepower per MW, around 0.5 to 1.0% of unit output. Tower fans add more. Water adds a regulatory layer: India’s December 2015 environment rules capped specific water consumption at 3.5 m3/MWh for existing cooling tower plants and 2.5 m3/MWh for plants installed from January 2017, with zero liquid discharge for the latter.
Optimizing the cycle means deciding pumps, fans and chemistry together, with the net benefit in view. We can review your current operating rules on a call.
How the Cooling Water Cycle Fits Together
Each part of the cycle affects the others. Optimization starts with seeing them as one loop.
Move water from the tower basin to the condensers.
Absorbs exhaust steam heat; outlet water is warmer.
Rejects heat to air by evaporation; fans move the air.
Cold water collects; makeup replaces evaporation, drift and blowdown.
Treatment and blowdown control scaling, corrosion and biofouling.
A change anywhere moves the rest. Fewer pumps raise the condenser outlet temperature and change tower loading. More fans lower cold water temperature but cost power. Higher cycles of concentration save water but raise scaling risk in the condenser. Good decisions weigh all of these at the same time.
Most plants have the data to model this loop already, spread across the DCS and water treatment logs. We bring it together during set-up.
The KPIs That Matter for the Cooling Water Cycle
These KPIs show whether the system is performing, and where it is not.
Cell-level approach is often the most revealing. One bad cell can drag down the whole tower, and it is invisible in the average. We show cells side by side in a demo.
The Levers Operators Can Pull
Each lever has a cost and a benefit, and the best combination changes with weather and load.
Adding a pump raises flow and improves vacuum; the gain shrinks when cooling water is already cold.
Variable speed fans or staged fans match airflow to need, saving power in cool weather.
Balancing water across cells and fixing nozzles restores tower capacity.
Fouled or damaged fill raises approach; restoring it lowers cold water temperature.
Higher cycles save water; good treatment keeps condensers and fill clean.
Well maintained drift eliminators reduce water loss and deposition around the tower.
POWER magazine notes that variable frequency drive retrofits on large plant motors can pay back in under two years in its 500 MW example. Whether they pay on your fans depends on your operating hours and climate, which a study can show.
Deciding When an Extra Pump or Fan Pays
The core decision is simple to state: add the equipment only when the heat rate gain is worth more than its power. Here is an illustrative calculation.
Illustrative numbers. The break-even point moves with cooling water temperature, load and condenser cleanliness.
Maintenance changes the answer as well. A freshly cleaned condenser needs less cooling water flow for the same vacuum, and a tower with a failed cell needs more fan power elsewhere. The recommendation must use today’s equipment condition, not design values.
The same logic applies to fans and tower cells. The value of cooling rises steeply as cooling water gets warmer, so the best configuration changes through the day and across seasons. A model that recalculates the break-even continuously lets operators follow it.
This calculation needs a reliable expected-backpressure model, which is shared with condenser performance monitoring. Our engineers build both together.
Managing Makeup, Blowdown and Cycles of Concentration
Water use in a cooling tower system is mostly evaporation, which is set by heat load. Blowdown and drift are where operators have control.
Raising cycles of concentration is often the largest water saving available. Its limit is chemistry: scaling in condenser tubes and fill, corrosion and biological growth. Continuous monitoring of chemistry alongside thermal performance lets plants push cycles up safely, with early warning if fouling starts.
Linking water chemistry to condenser cleanliness closes the loop between water saving and heat rate. That link is shown in a session.
Cooling Water Optimization Checklist
Use this checklist to move from fixed rules to optimized operation.
Most plants can start with existing instruments plus a wet bulb measurement. We confirm gaps during a short site review.
Where the Value Comes From
Cooling water optimization pays through three separate lines, which is why it is often underestimated.
Each line is modest on its own. Together, across the seasons, they add up. The best starting point is a year of data, which shows how much time the plant spent in each weather band and what the optimal configuration would have been.
That retrospective study is usually the fastest way to size the opportunity. Ask our team to run one on your data.
How iFactory Delivers Cooling Water Optimization
Pumps, condenser, tower and basin linked in one model.
Pump and fan staging recommended by net MW.
Approach and capability tracked per tower cell.
Makeup, blowdown, drift and cycles tracked daily.
Cycles raised safely with fouling watched.
Specific water consumption against limits.
It works with your DCS, historian and water treatment records. Share a year of data and we will show your optimal operating map in a workshop.
Find the Best Pump and Fan Settings for Every Season
Share a year of cooling water, weather and generation data. We model the cycle, show when each pump and fan paid for itself and estimate the power, heat rate and water gains.
Cell 6 approach is 1.8 °C worse than neighbouring cells at the same fan power. Pattern matches fill fouling or poor water distribution.
A Cooling Tower Cell Problem Found
This exchange shows how a performance engineer might use iFactory in summer.
iFactory ships as a pre-configured NVIDIA AI server, racked and ready with the cooling water cycle optimization models loaded. Rack it, plug in power and Ethernet, and the AI is live on your network. Our scope covers sensors and data connections across cooling water pumps, towers and condensers, DCS, PLC/SCADA, historian and ERP integration, cabling and network setup, operator and quality team training, and 24×7 remote monitoring.
Server installed, DCS and historian links live, historical operating, performance and maintenance data loaded.
Models calibrated on your own unit data, then run in advisory mode on one unit with your operations and performance engineers reviewing every output.
Rollout to the agreed units under your change management, operator and engineer training, and 24×7 remote monitoring in place.
Software, server and integration come as one package. For pricing on your station, contact our sales team.
Frequently Asked Questions
Running cooling water pumps, tower fans and cells, and water chemistry as one system, so each change is judged on its combined effect on condenser vacuum, auxiliary power and water use.
Approach, range, tower capability against design, fan and pump power, condenser backpressure deviation, cycles of concentration and specific water consumption per MWh.
When the heat rate or output gain from better vacuum exceeds the pump’s power. The gain is largest in hot weather and can be negative on cool nights.
Mainly by raising cycles of concentration to cut blowdown, keeping drift eliminators effective and controlling leaks, with chemistry managed to avoid scaling and fouling.
The December 2015 rules set a maximum of 3.5 m3/MWh for existing cooling tower plants and 2.5 m3/MWh with zero liquid discharge for plants installed from January 2017.
A retrospective study takes weeks; a typical rollout to advisory use takes 6–12 weeks. Plan it with our engineers.
Run Your Cooling Water Cycle for the Best Net Result
iFactory weighs pumps, fans, towers and chemistry together and tells operators which configuration pays at every hour, cutting auxiliary power, heat rate and water use at once.
Illustrative. Knowing where the auxiliary power goes shows which lever to pull first.