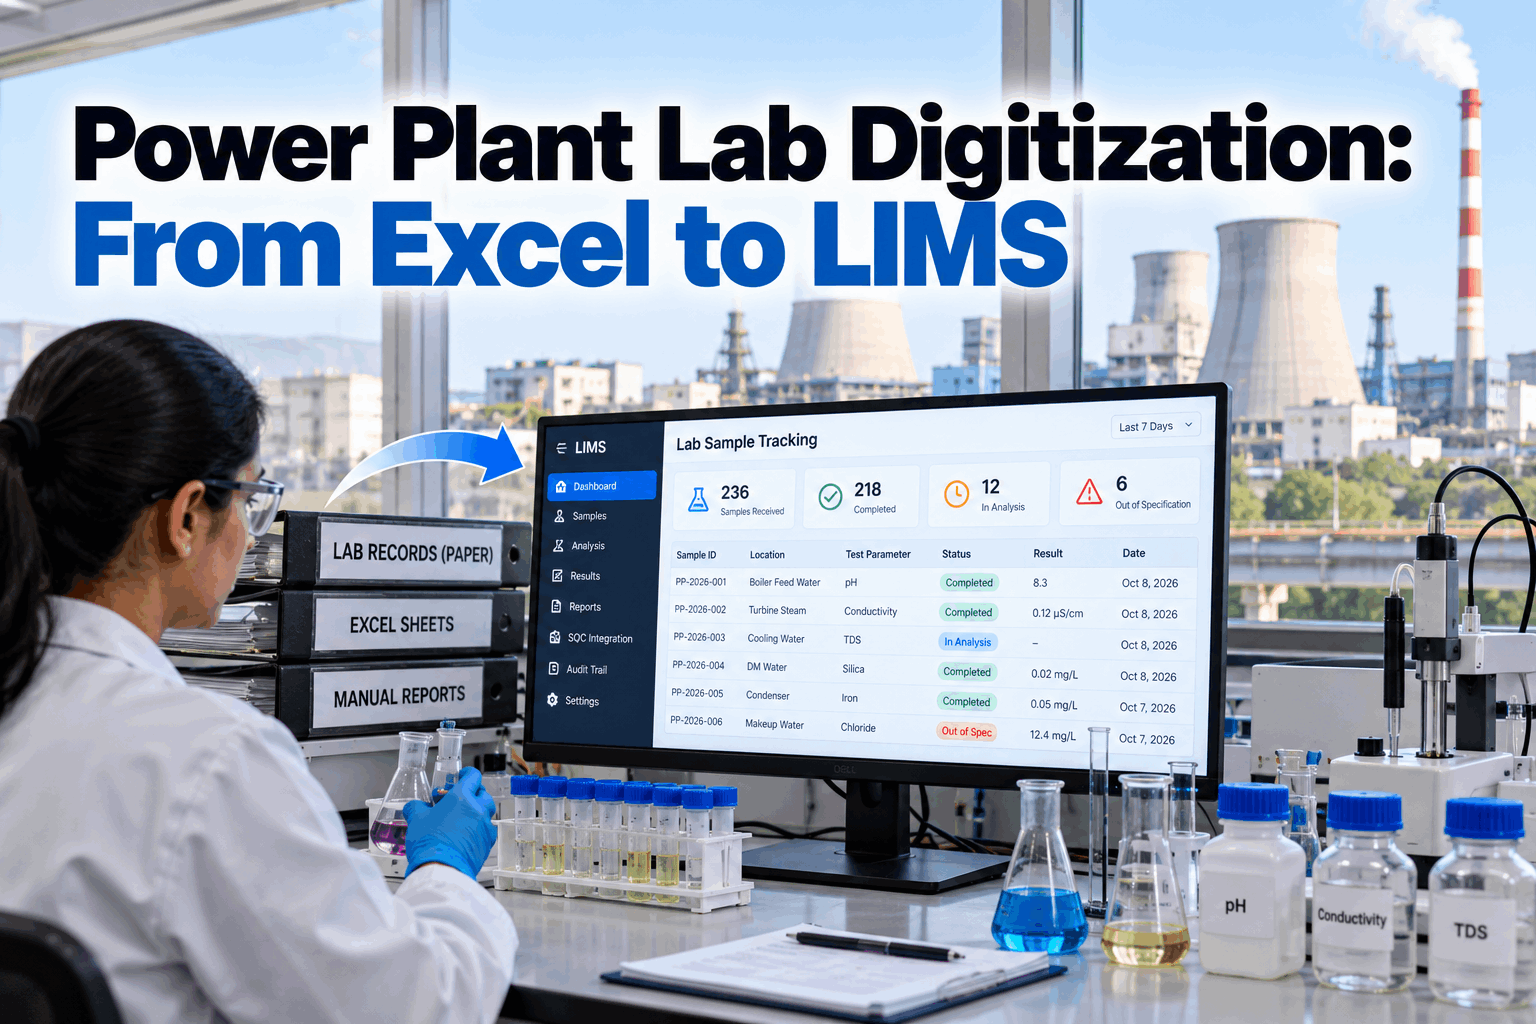
In many power plant labs, the analysis takes minutes and the handling around it takes hours. A coal sample is logged in a register, the result is copied into a spreadsheet, a second person checks the arithmetic, a supervisor signs a paper sheet and someone re-keys the number into a report. By then the boiler water excursion or the coal quality shift has been running for hours. Lab digitization fixes the flow, not just the form. This guide shows how to move a power plant lab from paper and Excel to a LIMS: where the time and data are lost, which workflows to digitize first, how to connect results to SQC dashboards and how to avoid the common mistakes. To see how it looks on your own lab workflows, book a lab digitization walkthrough.
Power Plant Lab Digitization: From Excel to LIMS
A practical guide for quality and chemistry teams: how to replace paper registers and spreadsheets with one sample record, connect lab results to SQC dashboards and put coal, water and ash data in front of operators while it can still change a decision.
- Where paper and Excel slow lab results in a power plant
- Which lab workflows to digitize first and why
- How to feed SQC dashboards and control charts in real time
Four steps hold more than four fifths of the time, and the dashed line marks where the cumulative share passes 80%. Re-keying is copying results from sheets into reports and other systems, and transcription is writing instrument readings by hand. A LIMS removes most of this handling, and what remains is the analysis itself.
What Lab Digitization Really Means
A LIMS turns every sample into one record that follows it from receipt to approved result.
A laboratory information management system registers samples, assigns tests, captures instrument data, runs calculations, checks results against limits, routes them for review and approval and keeps an audit trail of every step. Digitization is not just replacing a spreadsheet with a database. It means connecting instruments, rules and the people downstream who use the result. Our lab analytics team can show how this maps to your own lab.
One sample ID
Each sample logged once, tied to its source, point and time.
Results at source
Instrument and balance data captured directly, not typed later.
Rules at entry
Calculations and limits applied by rule, with out-of-limit flags.
Review and report
Approved results sent to the people and dashboards that need them.
A scanned paper form is still paper. If results are still typed from the form into a screen, you have added a step. Capture at the source, calculate by rule and let the record move without being copied.
Where Power Plant Labs Lose Time and Data
Each lab area loses time in its own way.
A power plant lab covers fuel, water, ash, oil and often environmental samples. Each area has its own sampling points, methods and decisions, and each feeds a different team. Start by finding which area's results are used soonest. To see where yours stand, book a lab workflow review.
A chemistry excursion found hours after it began has already had hours to do harm. The value of a faster result is the decision it still allows, not the minutes saved in the lab.
What to Digitize First
Start with the workflows where a faster result changes a decision.
You do not have to move the whole lab at once. Pick the workflows by how quickly the result is used and how much a delay costs, then connect each one end to end before starting the next.
A lab with one workflow fully digital and trusted learns more than a lab with five half-finished ones. Prove the flow on coal or water chemistry, then copy the pattern.
Feed SQC Dashboards in Real Time
SQC only works when results arrive while they can still change a decision.
Statistical quality control charts show whether a parameter is stable or drifting, and flag it before a limit is crossed. Individuals and range charts on coal calorific value, ash, moisture, water pH and silica do this well, but only if the data arrives promptly and in a clean, structured form. A LIMS gives the dashboard exactly that.
If results reach the chart a day late, it can only explain what went wrong. Real-time release from the LIMS is what turns the same chart into an early warning.
What Faster Lab Results Are Worth
The staff time saved is the easiest part to count and the smallest part of the gain. The larger value is in decisions made hours earlier on coal quality and water chemistry, and in data that stands up to an audit.
From Excel Sheet to Approved Result
Every sample should follow the same path, with no copying along the way.
A good LIMS workflow has the same six stages for every sample type. The stages stay the same while the tests, limits and recipients change, which makes the lab easier to train, audit and extend.
Register
Sample logged once with source and time.
Capture
Instrument results taken directly.
Calculate
Formulas and limits applied by rule.
Review
Checked and approved electronically.
Release
Sent to operators, reports and dashboards.
Trend
Charted and compared over time.
Common Lab Digitization Mistakes
Most failed lab projects digitize the paper instead of the process.
The software is rarely the problem. The trouble starts when the old habits move across unchanged. A few simple rules keep the project on course.
Good practice
- Capture results at the instrument, not at the keyboard
- Keep a full audit trail of every change
- Validate calculations and limits before go-live
Common mistakes
- Scanning paper forms and calling it digital
- Keeping Excel as a hidden second system
- Skipping validation of formulas and limits
Compare the LIMS results with the spreadsheet for an agreed period, fix the differences and then retire the spreadsheet formally. A sheet left running in the background will slowly become the real system again.
How iFactory Connects the Lab to Plant Quality
Lab results in, SQC and operator views out.
iFactory brings lab results and plant data into one view. It collects approved results from your LIMS, or from structured lab files while you migrate, and joins them to DCS and historian data. It builds control charts by parameter and sampling point, raises alerts when results drift or leave limits and tracks lab KPIs such as turnaround time and overdue samples. It runs on an on-prem server inside your network, with one view across all units and plants. It works with your lab's accredited procedures and does not replace them. Questions on fit go to our support desk.
Lab and plant data
Approved results from the LIMS or lab files, plus DCS and historian signals.
SQC control charts
Individuals and range charts by parameter and sampling point.
Drift and limits
Alerts to the chemist and operator before a limit is crossed.
Lab KPIs
Turnaround, backlog and rework tracked against the baseline.
Gains depend on your lab, your instruments and how fully workflows are digitized. We measure turnaround and the effect of each change on your own data during the pilot, rather than promising a general figure.
Turnkey AI: Delivered, Connected and Live in 6–12 Weeks
You do not build this. It arrives ready.
iFactory ships as a pre-configured NVIDIA AI server with the software pre-loaded. Rack it, plug in power and Ethernet, and the AI is live on your network. Our team handles cabling, network setup, PLC and SCADA integration, team training and 24×7 remote monitoring. Data stays on your own network. For a scope matched to your plant, request a turnkey quote.
Ship, network and lab data
Server installed. LIMS or lab file feeds and historian data connected for the pilot workflows.
Limits and control charts
Parameters and limits agreed. Control charts and alert rules checked with your teams.
Go-live and training
Dashboards and alerts live. Teams trained. 24×7 remote monitoring begins.
Frequently Asked Questions
What is a LIMS in a power plant lab?
A laboratory information management system registers samples, captures and calculates results, checks them against limits, routes them for approval and keeps an audit trail. In a power plant it covers coal, water, ash, oil and environmental samples.
Why not stay with Excel?
Spreadsheets are easy to start with but hard to control. They allow silent formula changes, lack an audit trail, depend on re-keying and make trending slow. A LIMS applies the same rules every time and records who did what and when.
Does a LIMS help with ISO/IEC 17025 accreditation?
It supports it by keeping records, calibration data, control samples and an audit trail in one place. Accreditation depends on your methods, competence and management system, not on software alone. Confirm requirements with your accreditation body, such as NABL or an equivalent.
What are SQC charts for lab data?
They plot results over time against control limits, so you can see drift before a specification limit is crossed. Individuals and range charts suit parameters such as coal calorific value, ash, moisture, pH and silica.
How long does lab digitization take?
It depends on scope. A single workflow, such as coal receipt or boiler water chemistry, can go live much sooner than a whole lab. Start with one workflow end to end and widen from there.
How do we start?
With one workflow that feeds a fast decision. A 6-week pilot connects the lab data, agrees limits and charts and shows the first control charts and turnaround view. To plan it, contact our team.
See How Fast Your Lab Results Could Reach the Plant
In thirty minutes we look at your lab workflows, your spreadsheets and how results reach operators today. You keep the notes whether or not you go further with iFactory.
- 1A list of lab tests and sampling points
- 2Current Excel templates and paper registers
- 3The instrument list and output formats
- 4Specifications and control limits
- 5Out-of-spec and turnaround history