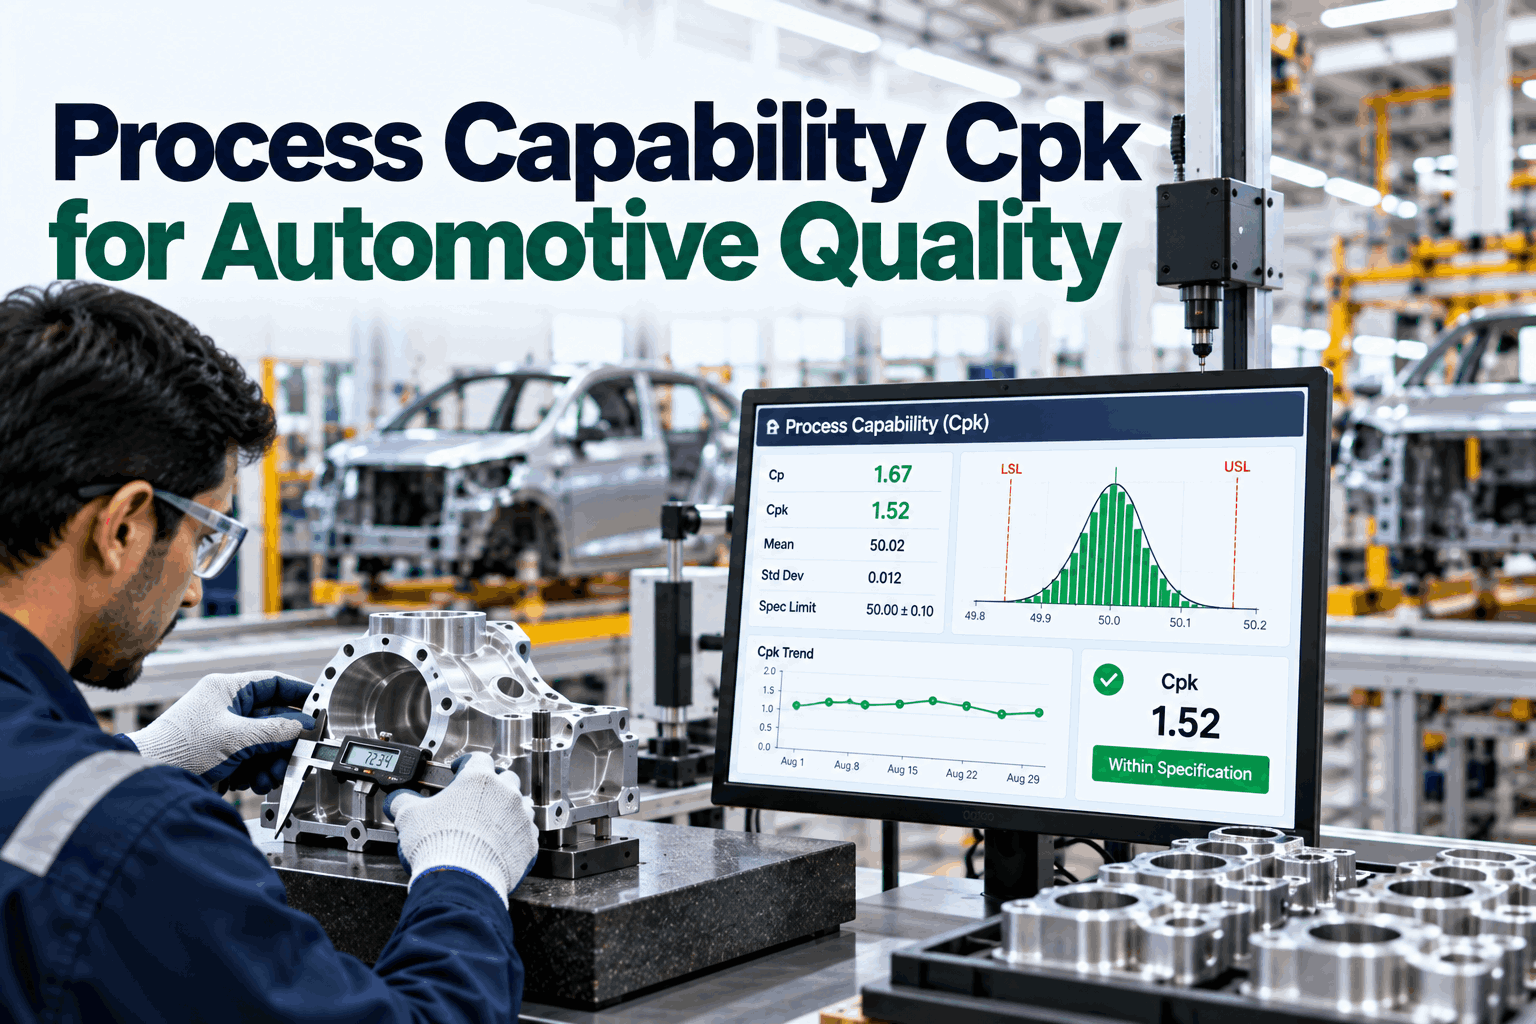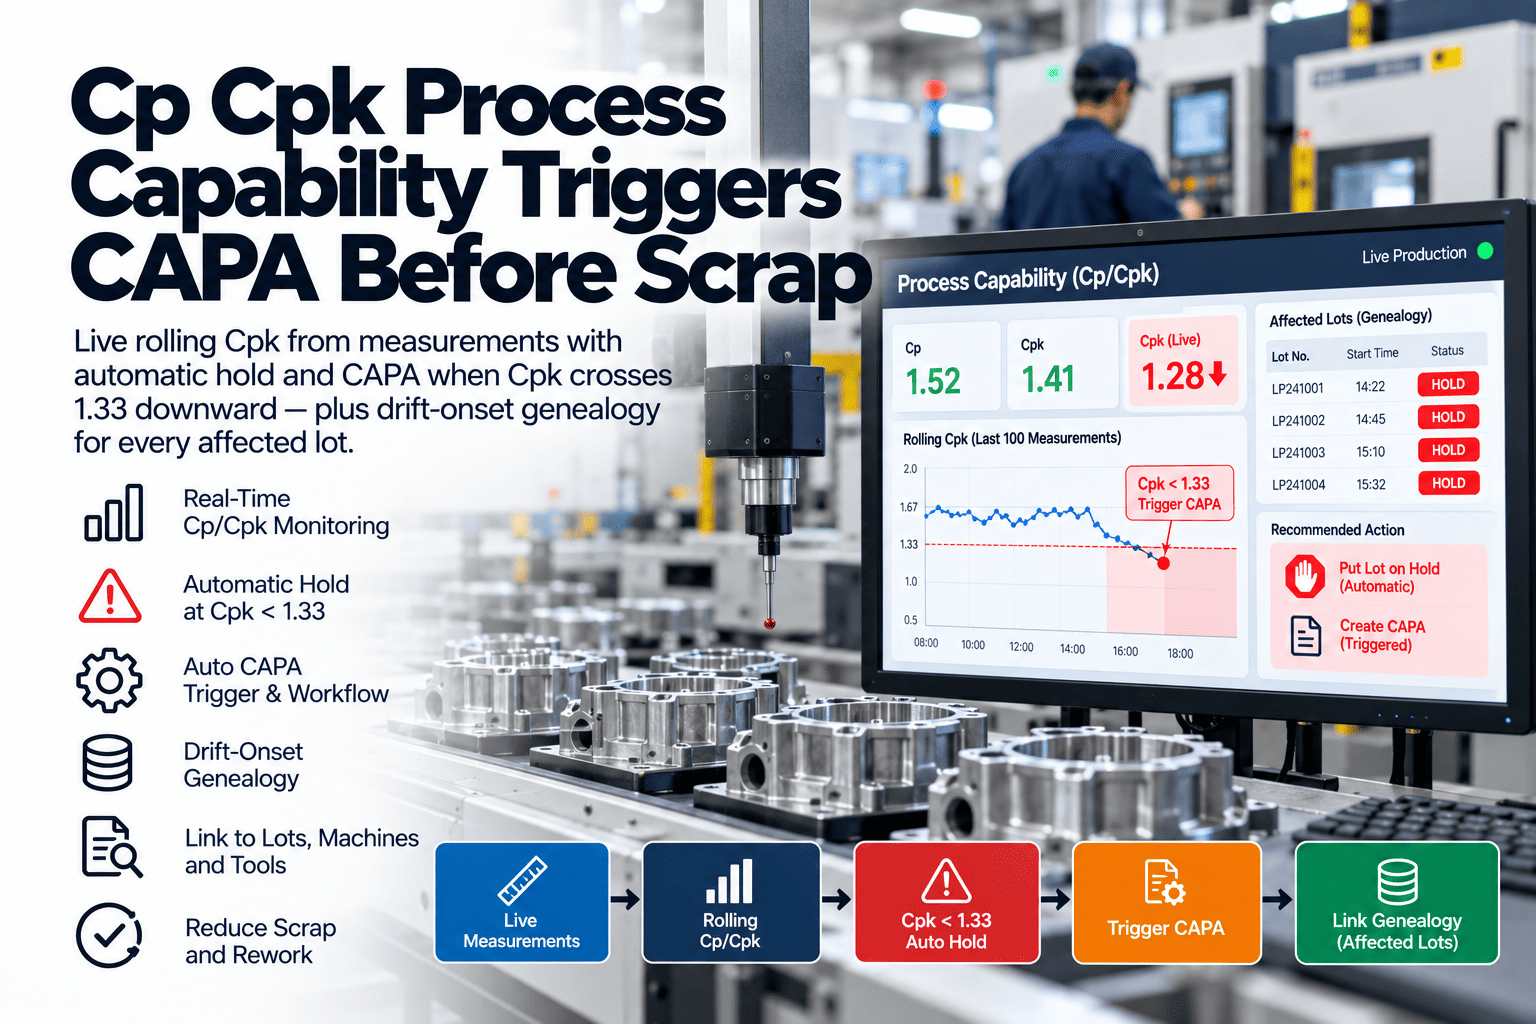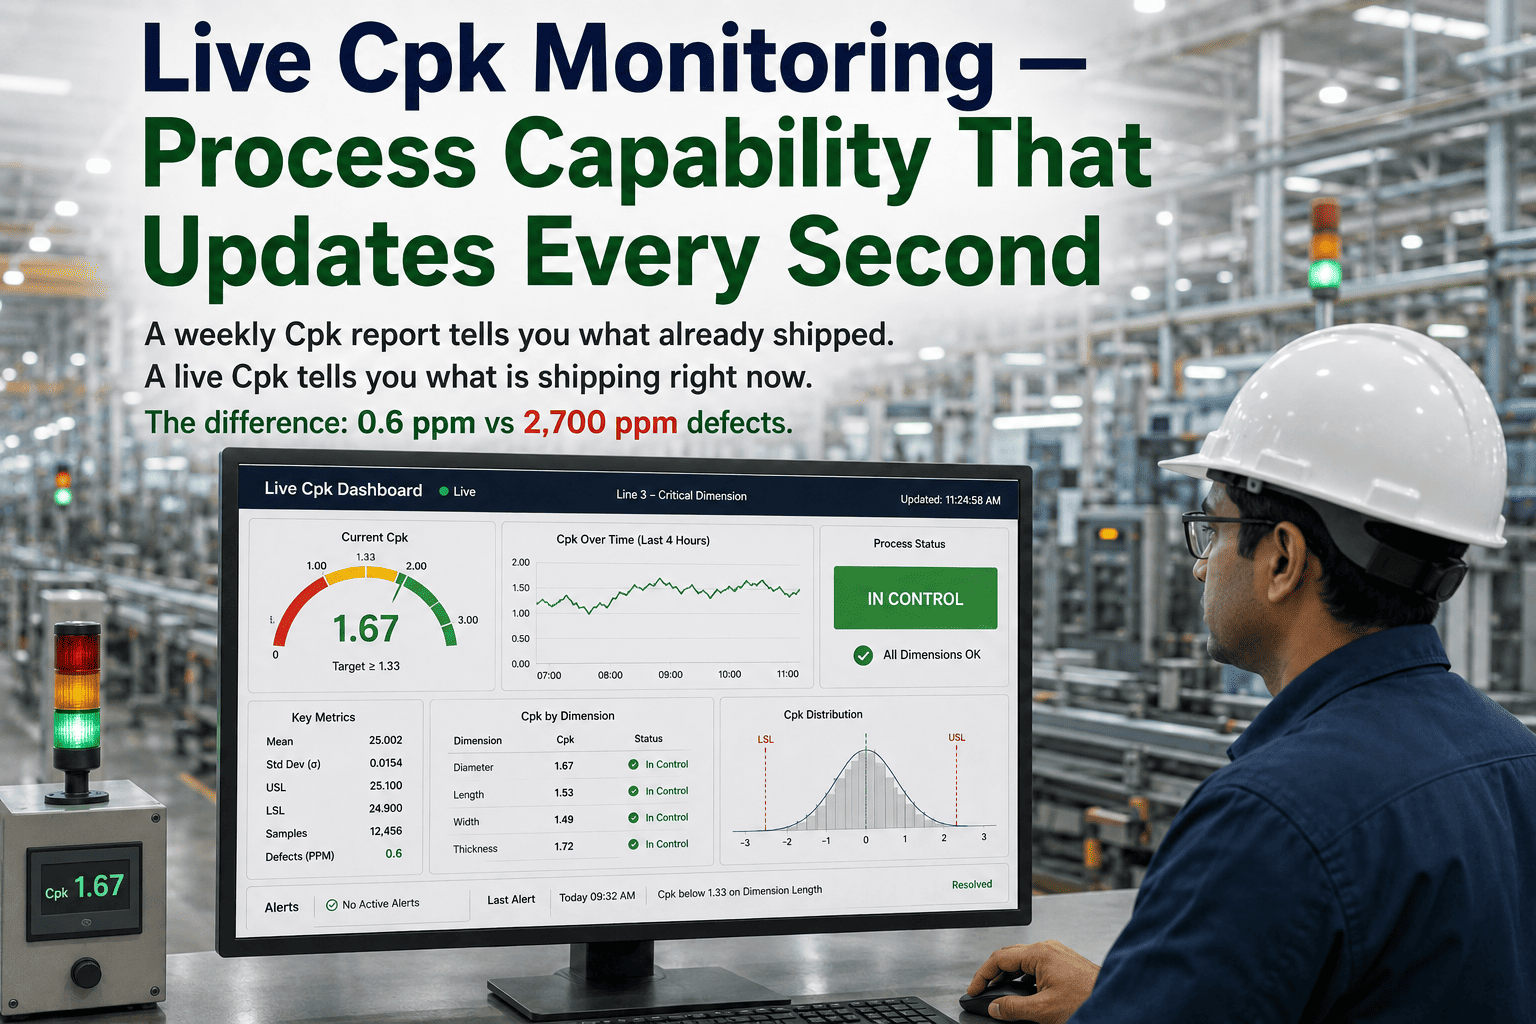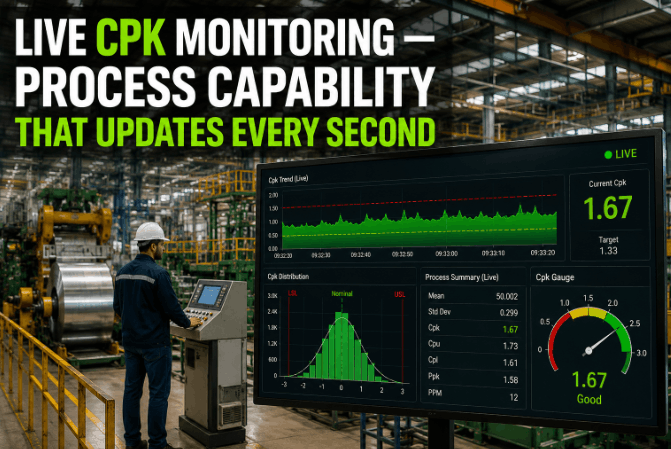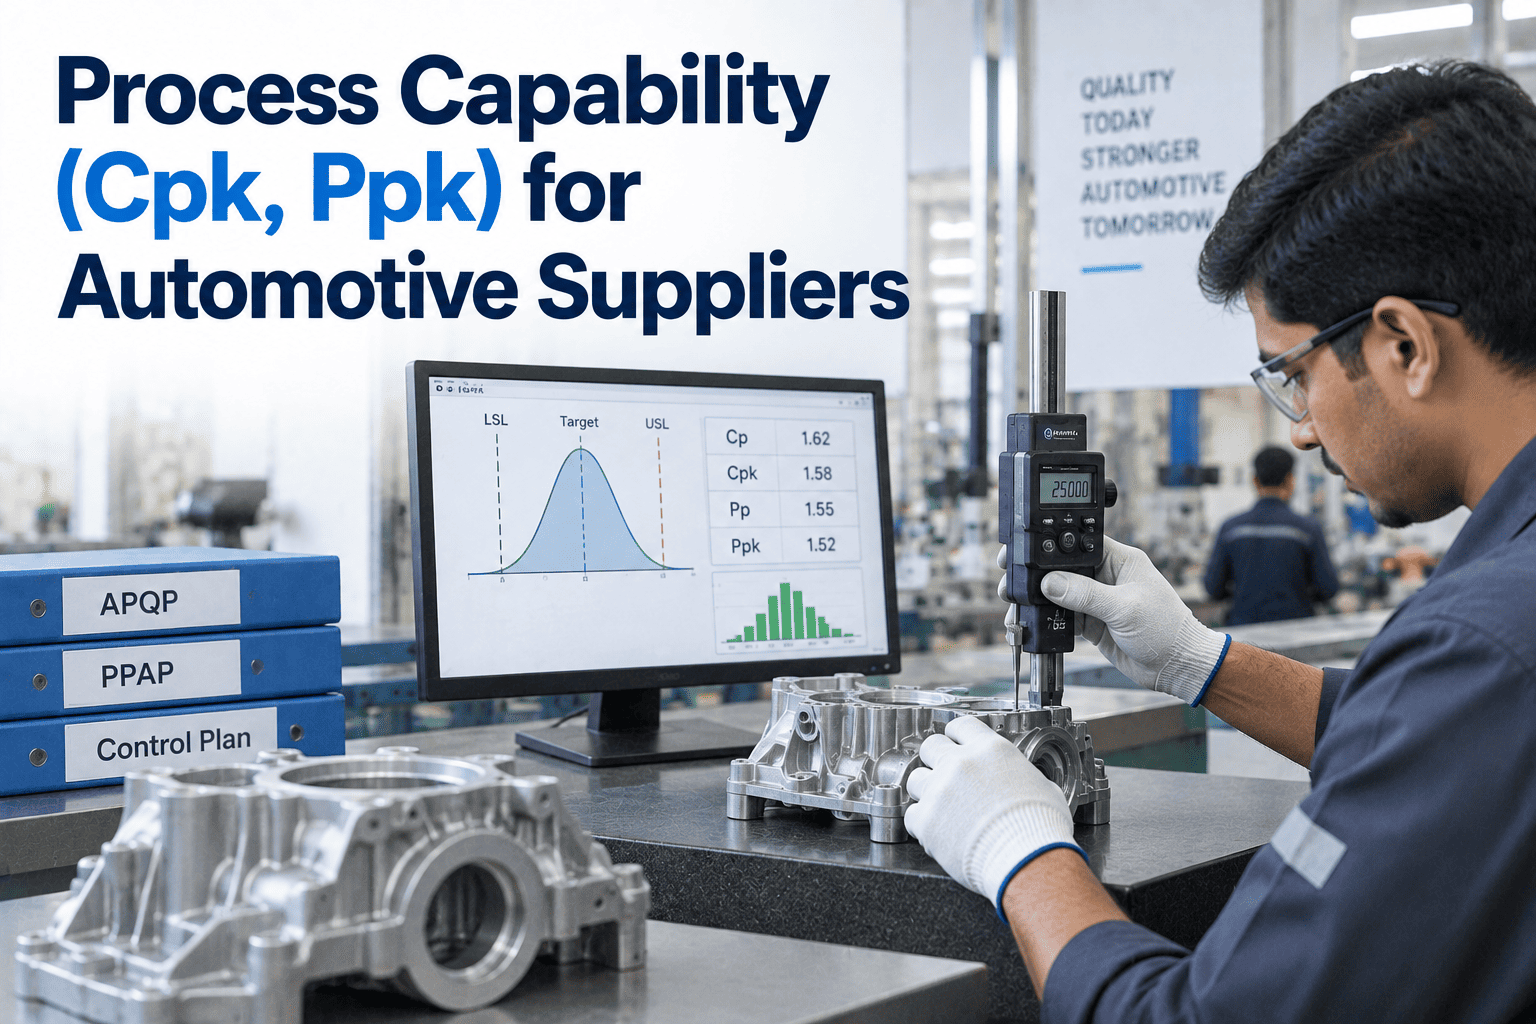
In automotive, a capability index isn't a number you're chasing for its own sake — it's a gate your customer has already set, and your part doesn't launch until you clear it. A Cpk or Ppk target of 1.33 or 1.67 is a contractual condition of PPAP approval, and different OEMs enforce different thresholds on different characteristics. The trap most suppliers fall into isn't failing to hit the number — it's hitting it the wrong way, submitting a beautiful Ppk of 1.68 on a fresh-tooling sample and then watching serial Cpk collapse to 0.89 in week one. This guide covers how to calculate Cpk and Ppk correctly, what the thresholds mean, and how to improve a number that's short. You can book a demo to see capability tracked live against your customer targets.
Your Customer's Cpk Target Is a Launch Gate. Clear It the Right Way.
How to calculate, interpret, and improve Cpk and Ppk for PPAP — so you clear the 1.33 or 1.67 threshold with a number that reflects real capability and holds up in serial production, not just on the submission sample.
The Voice of the Customer Against the Voice of the Process
A capability index isn't a single number to chase — it's a ratio between two things. The voice of the customer is your specification width, the tolerance the print allows. The voice of the process is the spread your process actually delivers, six standard deviations wide. When the process voice is narrower than the customer voice, the process is capable, and the index puts a number on how much margin you have. Cpk adds one more thing the basic Cp ignores: where the process is centered relative to the limits.
Compares tolerance width to process spread, assuming the process is perfectly centered. It tells you whether the process could fit — if it were aimed right — but says nothing about whether it actually is aimed right.
Takes the worse of the two distances — mean to upper limit, mean to lower limit — divided by three sigma. It penalizes an off-center process, which is why Cpk is always less than or equal to Cp, and why it's the number your customer actually asks for.
Cpk is the smaller of two ratios: the distance from the process mean up to the upper spec limit, and the distance down to the lower spec limit, each divided by three sigma. Taking the minimum is the whole point — it measures the nearest edge, the one you're most likely to fall off. A large gap between Cp and Cpk is a centering problem; a low Cp is a spread problem.
Cpk vs. Ppk — Same Formula, Different Sigma, Different Meaning
This is the single most misunderstood point in automotive capability, and the one that gets submissions rejected. Cpk and Ppk use the identical formula. The only difference is how sigma is calculated — and that difference is everything, because it's the difference between what your process can do at its best and what it actually does over time.
Uses the within-subgroup variation, the process at its most consistent, with common-cause noise only. It answers: what is this process capable of when it's behaving? This is the capability of a controlled, stable process.
Uses the overall standard deviation of every individual measurement, capturing shift-to-shift, lot-to-lot, and tool-wear variation. It answers: what does this process actually deliver in the real world, including its drift?
Many OEMs ask for Ppk at PPAP and Cpk in serial, which surprises people who expect the "long-term" index later. The logic: at PPAP you have a limited run, so you report Ppk from the total observed variation of that run as the honest, conservative number. Once serial production is stable and charted, Cpk from within-subgroup variation reports ongoing capability. Always check the exact requirement — some customers require both, and the specific thresholds live in the customer-specific requirements, not a universal default. Calling Cpk what is actually Ppk to inflate the headline number is the fastest way to mislead a reviewer and lose trust.
Report Cpk and Ppk Honestly, Automatically
iFactory computes within-subgroup and overall sigma separately from your live measurement data, so Cpk and Ppk are always labeled correctly and always ready for a PPAP package.
1.33 and 1.67 Aren't Arbitrary — They're Sigma Levels in Disguise
The targets your customer sets map directly to sigma levels and defect rates, through a simple relationship: sigma level equals three times Cpk. That's why the numbers are what they are — each threshold is a specific promise about how many nonconforming parts per million the process will produce. Seeing the defect translation makes it obvious why safety-critical characteristics carry the higher bar.
| Cpk / Ppk | Sigma Level | Where It's Required | Verdict |
|---|---|---|---|
| Below 1.00 | Under 3σ | Nowhere — improve immediately | Defects essentially guaranteed |
| 1.33 | 4σ | Standard automotive production minimum | Capable, roughly 63 ppm |
| 1.67 | 5σ | PPAP initial, significant / critical characteristics | Robust — near 0.6 ppm |
| 2.00 | 6σ | Safety-critical, high-cost-of-failure features | World-class — near zero |
Ppk 1.68 at PPAP, Cpk 0.89 in Week One — and Nobody Planned for It
Here's the failure pattern that catches suppliers who did everything else right. A part is submitted with a Ppk of 1.68 on 300 pieces, gets PSW approval, goes to serial production, and the Cpk on the first week's SPC data comes back at 0.89. That's not usually a process collapse — it's a statistical artifact of the difference between the PPAP sample and reality.
- One material lot, one narrow range of variation
- Fresh tooling at its most precise
- Limited operator and shift variation
- A short, closely watched run
- Material variation across many lots
- Tooling wear accumulating over the run
- Shift-to-shift and operator-to-operator spread
- Thousands of parts under real conditions
The control plan's reaction-plan column is meant to address exactly this drop — and in most plants it's the shortest, thinnest column on the page. The way to avoid the surprise is to expect the gap: treat the PPAP number as a best-case reading, watch capability continuously once serial starts, and have a defined reaction when it slips below target rather than discovering the slip in a customer complaint. A supplier who monitors serial Cpk from day one turns a would-be excursion into a controlled adjustment.
A Capability Study Is a Short Project, and Skipping a Step Voids the Number
A Cpk value is only as trustworthy as the study behind it. Each of these prerequisites exists because skipping it produces a number that looks fine and means nothing — and a PPAP reviewer knows exactly which ones to probe. Do these first, every time.
Capability is meaningless on an out-of-control process. Verify statistical control on the chart across at least 20 subgroups before you calculate a single index — a Cpk on an unstable process is a number describing chaos.
Thirty consecutive measurements is the practical minimum for a preliminary look; a formal PPAP study wants 100 or more spanning multiple shifts, operators, and material lots, so the number reflects the variation serial production will actually see.
The standard Cpk formula assumes a normal distribution. Check it with Anderson-Darling or similar, and if the data isn't normal, apply and document a transformation — an untested distribution can silently invalidate the index.
A Gauge R&R study confirms the variation you're measuring is the process, not the gauge. If measurement error is large, a real capability problem can hide behind an apparently acceptable Cpk — or a good process can look incapable.
A Low Cpk Is Either Off-Center or Too Wide — Diagnose Which First
Improving Cpk isn't one action, it's a choice between two, and picking the wrong one wastes effort. The diagnosis is simple: compare the two halves of the calculation. If the distance to the upper limit and the distance to the lower limit are very different, you have a centering problem. If both are tight, you have a spread problem. Each has its own fix.
When the process mean has drifted toward one spec limit, the two distances are unequal and Cpk is dragged down by the near side. Adjust machine offsets, tooling positions, or setpoints to move the mean back toward the middle of the tolerance. This is often quick and recovers capability without touching variation.
When the process is centered but the spread is still too wide, the fix is reducing the variation itself — identifying and controlling root causes with tools like fishbone analysis, designed experiments, and SPC charts. It's more work than recentering, but it's the only path to a genuinely robust, high-Cpk process.
From Live Measurements to a PPAP-Ready Capability Study
iFactory turns capability from a spreadsheet exercise compiled over days into a live number that's always current and always defensible. It computes the indices correctly, checks the prerequisites, and holds capability against each characteristic's customer-specific target so nothing surprises you at submission or in serial.
What Automotive Quality Teams Ask About Cpk and Ppk
Clear Every Customer Cpk Target With a Number That Holds
iFactory computes Cpk and Ppk correctly from live data, checks the study prerequisites, holds each characteristic to its customer-specific target, and watches serial capability continuously — so your PPAP clears the gate and your process stays capable in production.