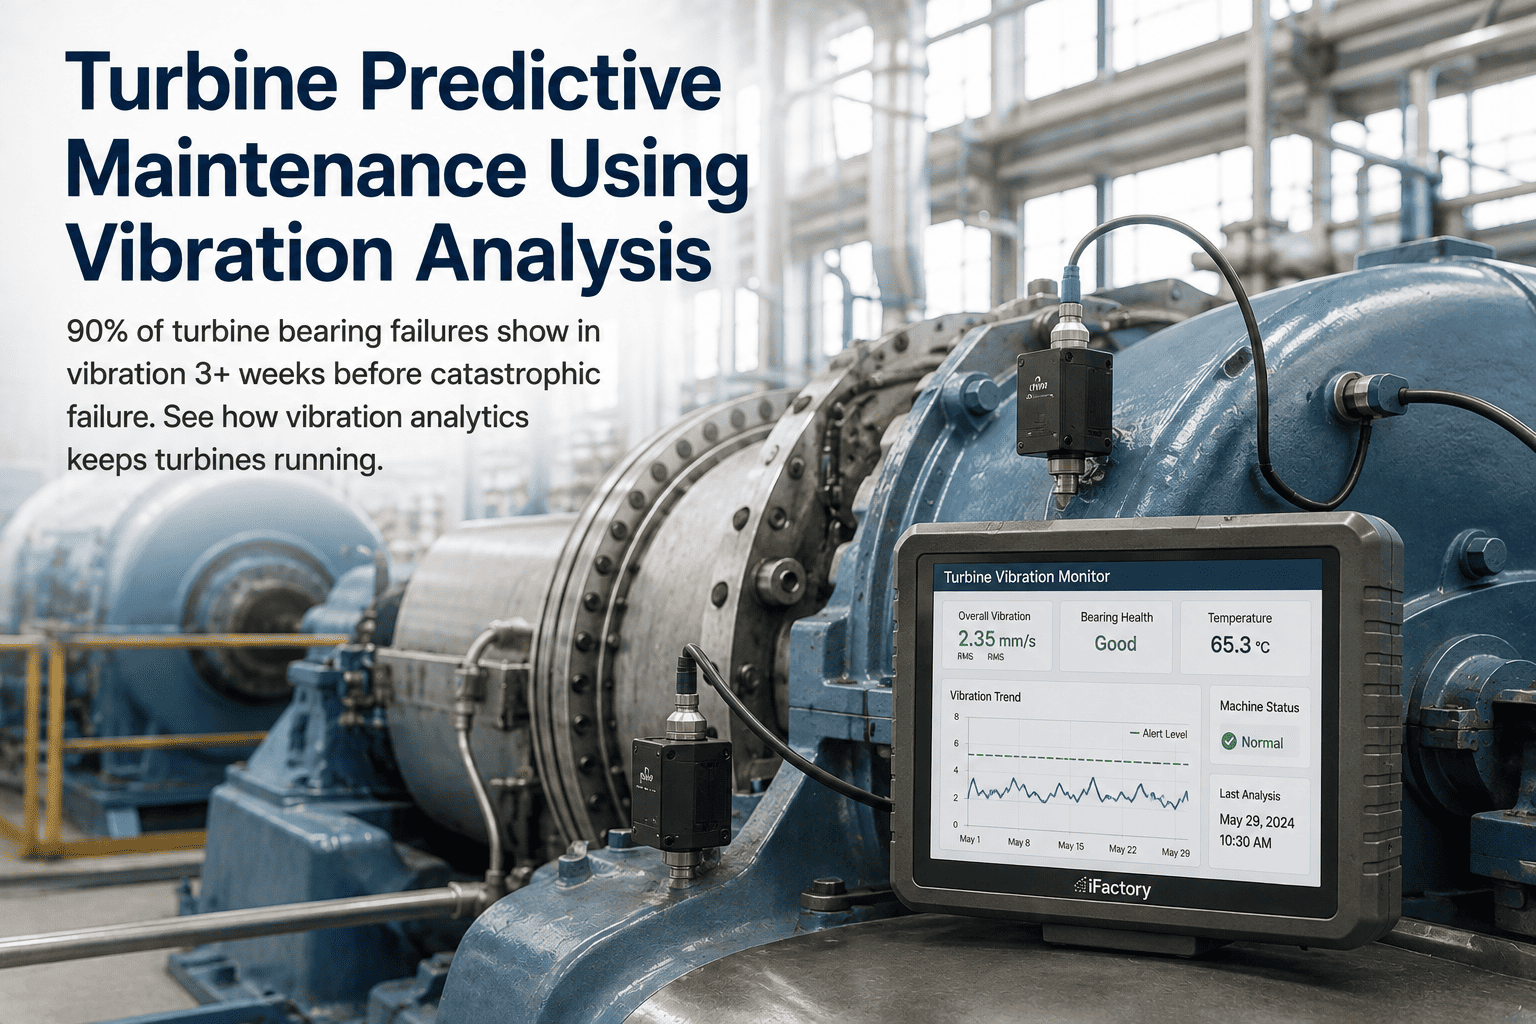
A turbine tells you it's failing weeks before it fails — in the language of vibration. A journal bearing starting to degrade, a rotor drifting out of balance, a coupling pulling into misalignment: each one changes how the machine vibrates long before it changes anything an operator can see or hear. That early warning is enormous, because a turbine is the highest-consequence asset in the plant. A bearing caught degrading is a $4,000 planned swap done in a four-hour window; the same bearing run to failure at full load scores the journal and shaft and becomes a rotor rebuild measured in months and eight figures. The gap between those two outcomes is entirely about how early the vibration signal is caught and acted on — and vibration analysis is the single highest-impact technique for catching it, detecting the majority of mechanical faults two to eight weeks before failure. For a maintenance team, that lead time is the difference between a scheduled repair and a catastrophe. The catch is that the warning lives in the frequency spectrum, where a bearing defect and a rotor imbalance look nothing alike — and reading that spectrum fast is what turns data into a saved turbine. To see vibration analytics on your turbines, book a demo.
POWER & ROTATING EQUIPMENT · TURBINE VIBRATION PdM
Catch a Bearing Weeks Early — Not the Rotor Rebuild That Follows.
Most turbine mechanical faults show in vibration two to eight weeks before catastrophic failure — if the spectrum is read continuously and the signature is diagnosed fast. iFactory trends multi-axis vibration against each turbine's baseline, decomposes the signal by frequency to name the fault, and dispatches the work order automatically, so your team acts inside the P-F window instead of reacting to a trip.
2–8 wks
Vibration warning ahead of mechanical failure
60–70%
Of turbine mechanical faults vibration detects
$4K vs $400K
Planned bearing swap vs a run-to-failure rotor rebuild
>70%
Of unplanned outages traceable to early warning signals
Why Turbine Failures Are Worth Catching Early
A turbine is the highest-consequence rotating asset in a plant, and its failure modes are the kind that make headlines internally for years. A catastrophic turbine failure — low-pressure blade liberation, thrust-bearing collapse, or a rotor rub — results in multi-month outages and repair costs that run into eight figures. What makes these events so painful is that they are almost never sudden in the physical sense: the degradation that ends in catastrophe builds over weeks, emitting a clear vibration signal the whole time. The failure is a surprise only because nobody was reading the signal, or read it too late. For a maintenance team, the entire game is converting that build-up window into planned action.
The Consequence Is Catastrophic
When a turbine fails hard, it doesn't fail small — a liberated blade, a collapsed thrust bearing, or a rotor rub can wreck the journal, the shaft, and the casing at once, turning what started as a single degrading component into a multi-month rebuild. The severity of the endpoint is exactly why early detection carries such enormous value.
The Cost Multiplies With Delay
A bearing caught degrading is a modest planned swap; the same bearing run to failure scores the shaft and becomes a rotor rebuild costing a hundred times more. Every week a fault goes undetected moves it further down the curve where the repair gets larger, so delay doesn't just risk downtime — it inflates the eventual bill exponentially.
Periodic Checks Miss the Window
Manual route-based vibration checks are snapshots, and a fault that develops over two to three weeks can arrive and advance entirely between rounds. Catching a degradation trend requires continuous trending against a baseline, not a reading taken every few weeks that may land before the signal starts or after the damage is done.
Overall Amplitude Hides the Cause
Most control-room alarms trend only overall vibration amplitude, which tells you something is wrong but not what. A rising number could be imbalance, misalignment, a bearing defect, or looseness — each needing a different response — and without decomposing the signal by frequency, the team is left guessing at a diagnosis the spectrum could have named.
Over 70 percent of turbine unplanned outages are traceable to detectable early-warning signals in vibration, temperature, and oil data. The signal was almost always there. The difference between a controlled repair and a catastrophic failure is how fast the team recognizes it and acts — which is a data and diagnosis problem, not a mechanical inevitability.
The P-F Window: A Fault's Timeline in Vibration
Failures don't happen instantly — they progress along a curve from the first detectable sign to functional failure, the interval reliability engineers call the P-F window. Vibration is what makes that window visible on a turbine, and different techniques light up at different stages, giving a team weeks of graduated warning if they're watching. Here's how a typical bearing fault unfolds.
STAGE 1
Sub-Surface Fatigue — Ultrasonic
The earliest detectable sign of bearing fatigue is micro-stress releases in the bearing steel that create high-frequency ultrasonic pulses weeks before any surface damage begins. High-frequency envelope detection catches this sub-surface stage, when a fault is still invisible to conventional low-frequency vibration and to the naked eye — the furthest-out warning the physics allows, and the point at which intervention is cheapest.
STAGE 2
Bearing Defect Frequencies Emerge
As micro-damage becomes surface spalling and pitting, energy appears at the bearing's specific defect frequencies — ball-pass frequency outer and inner race — and high-frequency RMS acceleration rises well before low-frequency readings change. This is the stage where spectral analysis positively identifies a developing bearing defect and distinguishes it from a rotor problem, still comfortably inside the window for planned action.
STAGE 3
Running-Speed Vibration Climbs
As bearing clearance grows, vibration amplitude at running speed increases and the rotor's dynamic behavior degrades — the mid-to-late stage where the fault is now affecting how the whole rotor-bearing system moves. The trend is unmistakable against baseline by this point, and the remaining window is shrinking, so a team that hasn't yet acted is now working against the clock rather than ahead of it.
STAGE 4
Temperature Rises — The Late Indicator
Bearing temperature rise lags the vibration changes by days to weeks, so by the time metal temperature climbs above baseline the fault is already advanced — which is why temperature alone is a late-stage indicator and a poor primary one. A program that waits for a thermal alarm has skipped the entire early window; vibration is what buys the weeks of lead time that temperature can't.
See the P-F Window on Your Own Turbines
Bring a turbine near an overhaul or showing a nagging vibration trend. iFactory engineers will show the multi-axis trending, the spectral decomposition that names the fault, and how the staged escalation from alert to critical gives your team time to plan the repair instead of react to a trip.
Reading the Signature: What the Frequency Tells You
The reason vibration is so diagnostic is that every fault vibrates at its own frequency, tied to the machine's running speed and the physics of how it's failing. Plotting amplitude against frequency — the spectrum — rather than watching a single overall number is what turns raw vibration into a specific diagnosis. These are the signatures a maintenance team reads on a turbine.
Rotor Imbalance — 1× RPM
A single dominant peak at one times running speed in the radial direction, growing sinusoidally in amplitude as the imbalance worsens. It's the most common rotor fault, caused by mass unbalance and centrifugal force, and it accelerates bearing wear if left uncorrected — so catching the rising 1× early prevents the secondary failure it would otherwise cause.
Misalignment — 2× RPM
Elevated 2× and 3× harmonics alongside the 1× peak, often with strong axial vibration, and proximity probes on the two bearings showing a 180-degree phase difference. Coupling misalignment, angular or parallel, produces this signature, and phase measurement is what distinguishes it from imbalance when both raise amplitude similarly.
Bearing Defects — BPFO / BPFI
Impulsive high-frequency energy at the bearing's ball-pass frequencies — outer race and inner race — rising in high-frequency acceleration weeks before low-frequency vibration moves. When energy at a specific defect frequency crosses threshold, that race has a developing spall or pit, pinpointing not just that a bearing is failing but which element.
Oil Whirl & Whip — Sub-Synchronous
Energy below running speed, at a fraction of 1×, signaling oil-film instability in a journal bearing — whirl that can progress to destructive whip. Proximity-probe orbit plots reveal the shaft's whirling motion directly, catching an instability that overall amplitude alone would never characterize as its own distinct fault.
Looseness & Rub
Mechanical looseness raises multiple harmonics of running speed, and a rotor rub against a seal or casing shows as characteristic contact signatures in the orbit and spectrum. Both indicate a machine no longer running clean within its clearances, and both are visible in the pattern well before they escalate into contact damage.
Resonance & Thermal Bow
A dramatic amplitude rise when a rotating speed coincides with a natural frequency reveals resonance, and a slow amplitude and phase shift on start-up from uneven rotor heating signals thermal bow. Recognizing these from the vibration pattern tells the team whether to shift operating speed, balance, or investigate a cooling or rub-induced heating problem.
Matching a frequency peak to its mechanical cause is the core skill of vibration diagnostics — and exactly the pattern-matching that AI accelerates. Automatically decomposing the signal into its component frequencies and matching the pattern to the most likely fault cuts diagnosis from days of manual spectrum review to minutes, so the team spends the P-F window fixing the fault rather than identifying it.
The Sensors and Standards Behind the Data
Trustworthy vibration diagnostics rest on the right sensors measuring the right quantities, evaluated against recognized standards. Turbines use two complementary sensor types, and a mature program reads both against the reliability frameworks that define what "normal" and "act now" actually mean.
SENSORS
Accelerometers and Proximity Probes
Accelerometers mount on the bearing housings — radially, often at 45 degrees on both ends for full coverage — and capture casing vibration rich in the high-frequency content that reveals bearing defect frequencies, imbalance, misalignment, and looseness. Eddy-current proximity probes, installed in orthogonal X-Y pairs at each bearing per API 670, measure the shaft's actual dynamic displacement within its clearance in micrometers — the orbit shape, whirl direction, eccentricity, thrust position, and rub contact that casing sensors can't see. Together they cover both the housing and the shaft, which is why critical turbines run both.
STANDARDS
ISO 20816, API 670, and the Trend Rule
ISO 20816, successor to ISO 10816, sets vibration severity limits by machine class in zones from good to unacceptable, while ISO 13373 defines condition-monitoring procedures, ISO 17359 the overall framework, and API 670 the machinery-protection requirements for critical turbomachinery. The key insight these standards encode is that a significant change in vibration is often more meaningful than the absolute level — a reading still in an acceptable zone but trending steadily upward is an early fault, which is exactly why trend-based monitoring against a baseline beats a fixed alarm threshold.
Vibration Leads — But Doesn't Work Alone
Vibration is the highest-impact single technique for turbines, but no single method covers every failure mode, and the best programs layer complementary data streams. Knowing what vibration sees clearly and what it sees late is how a maintenance team builds coverage that catches nearly everything.
01
Vibration — The Rotor and Bearings
Vibration is the primary early-warning tool for mechanical faults, detecting the majority of bearing wear, imbalance, misalignment, and shaft instability two to eight weeks ahead. It's the backbone of turbine condition monitoring and the technique that catches the rotor-bearing faults that cause most catastrophic failures.
02
Oil Analysis — The Lube System
Oil analysis often detects rising iron and copper wear particles first, even ahead of vibration for some bearing degradation, and reveals lubricant condition and contamination that vibration can't. It's the complementary stream for the bearings and lube system, catching what shows chemically before it shows mechanically.
03
Performance & Thermal — The Blades
Stage-efficiency and exhaust-temperature trending catch blade degradation and hot-gas-path issues six to twelve months out, long before mechanical symptoms — because for blade fatigue and erosion, vibration changes appear late, only after significant material loss. Performance trending is the primary early tool for the blade path.
04
Temperature — The Confirming Signal
Bearing metal temperature trending with rate-of-change alerting confirms a developing bearing or oil-film problem, but lags vibration by days to weeks, so it works best as corroboration rather than primary detection. Rising temperature validating a vibration trend is a far stronger signal than either alone.
The practical rule is that no single technique protects a complex asset: a turbine needs vibration for the rotor, oil analysis for the bearings and lube system, and performance analytics for the hot gas path and blades. Programs that deploy all the complementary streams together identify 85 to 95 percent of incipient faults before secondary damage occurs — far more than vibration alone, though vibration remains the highest-impact place to start.
From Signal to Saved Turbine: The Team's Workflow
All the analytics matter only if they end in the right action at the right time. The value for a maintenance team is a closed loop — continuous trending, automatic diagnosis, staged escalation, and a work order timed to the P-F window — that turns a vibration signal into a planned repair. This is how a real save unfolds.
1
Continuous Trend Against Baseline
The platform trends multi-axis vibration continuously against each turbine's own baseline, so a slow rise at one journal bearing — climbing from a stable baseline over roughly two weeks — is caught the moment it starts deviating, not at the next manual round. Continuous beats periodic precisely because the fault doesn't wait for the schedule.
2
Spectral Analysis Names the Fault
FFT-based analysis decomposes the signal and matches the pattern to the fault — energy concentrating at bearing defect frequencies rather than running speed rules out imbalance and points to early bearing degradation. The team gets a named, located fault in minutes instead of days of manual spectrum review, so no time in the window is lost to diagnosis.
3
Staged Escalation, Alert to Critical
Severity auto-escalates across the fault's milestones — from an early alert as defect frequencies emerge to critical as running-speed vibration climbs — so the team sees not just that a fault exists but how far along it is and how much window remains. The escalation communicates urgency without a specialist reinterpreting the data at each step.
4
Work Order Timed to the Window
The platform dispatches a work order automatically with the diagnosis and evidence attached, so the team schedules a borescope and bearing inspection in a low-demand window and replaces a scored-but-not-failed bearing in a planned four-hour intervention — instead of a failure at full load that turns a minor repair into a months-long rotor rebuild.
That's the whole value in one example: a mobile gas turbine on reserve duty, a two-week vibration rise at a journal bearing, a spectral diagnosis that rules out a rotor problem, and a deliberate four-hour bearing swap in a low-demand window. The bearing was scored but not failed. The alternative — running it to failure at full load — risks the journal and the shaft and turns a four-hour job into a rebuild measured in months.
What Changes for the Maintenance Team
Turbine vibration analytics changes the maintenance team's relationship with its most critical asset — from reacting to trips and dreading the catastrophic failure to managing each turbine on its true condition with weeks of warning.
01
Weeks of Warning, Not a Trip
Continuous vibration trending flags bearing, imbalance, and misalignment faults two to eight weeks ahead, so the team plans the repair in a low-demand window with parts and crew arranged — instead of responding to a vibration trip or, worse, a catastrophic failure at full load.
02
Diagnosis in Minutes, Not Days
Automatic spectral decomposition names the fault and its location from the frequency signature, cutting diagnosis from days of manual spectrum review to minutes — so the P-F window is spent fixing the problem, not arguing over what the rising amplitude means.
03
A $4K Job Instead of a $400K One
Catching a bearing while it's scored but not failed keeps the repair a modest planned swap rather than the rotor rebuild that a run-to-failure creates — turning the single most expensive failure mode the plant faces into routine, scheduled maintenance.
04
Usually No New Sensors Needed
Because the platform integrates with the proximity probes and accelerometers already installed on most turbines, the team gets continuous analytics on existing instrumentation — modern diagnosis layered onto the machine you already run, not a hardware project.
Frequently Asked Questions
The questions maintenance and reliability teams ask most often when evaluating turbine vibration analytics.
How much warning does vibration analysis really give before a turbine fails?
For mechanical faults, typically two to eight weeks, and sometimes more depending on the fault and how early the detection method reaches. Vibration is the highest-impact single technique for turbines, detecting 60 to 70 percent of mechanical faults — bearing wear, imbalance, misalignment, and shaft instability — well before failure. The lead time depends on which stage you catch: high-frequency envelope detection can flag sub-surface bearing fatigue weeks before any surface damage, bearing defect frequencies emerge as spalling begins, and running-speed amplitude climbs later as clearance grows. Bearing temperature, by contrast, only rises days to weeks after vibration has already changed, so a temperature-based program has effectively skipped the early window. The practical point is that the earlier detection method buys more window, and continuous trending against baseline is what captures the fault at its earliest detectable stage rather than after it's advanced. To see the lead time on your turbines,
book a demo.
How does it tell a bearing defect apart from a rotor imbalance?
By the frequency signature, which is the core of vibration diagnostics. Every fault vibrates at a frequency tied to the machine's running speed and its failure physics, so plotting amplitude against frequency — the spectrum — separates causes that a single overall-amplitude number blends together. Rotor imbalance shows as a dominant peak at one times running speed in the radial direction; misalignment shows elevated 2× and 3× harmonics with strong axial vibration and a 180-degree phase difference between bearings; and a bearing defect shows impulsive energy at the specific ball-pass frequencies of the outer or inner race, rising in high-frequency acceleration before low-frequency readings move. So when the energy concentrates at bearing defect frequencies rather than running speed, that rules out imbalance and points to bearing degradation. The platform decomposes the signal automatically and matches the pattern to the most likely fault, cutting what used to be days of manual spectrum review down to minutes — which matters because the P-F window shouldn't be spent identifying the fault.
Do we need to install new sensors on our turbines?
In most cases, no. Production-grade predictive maintenance platforms integrate with the sensor instrumentation already installed on most turbines — the shaft proximity probes and accelerometers that critical turbomachinery typically carries per standards like API 670. Proximity probes in orthogonal X-Y pairs at each bearing measure shaft displacement, orbit, and thrust position, and casing accelerometers capture the high-frequency content that reveals bearing defect frequencies; both are standard on most installed turbines. The platform reads that existing data and applies continuous trending, spectral analysis, and automated diagnosis to it, so the upgrade is analytical rather than a hardware install. Where a specific machine lacks coverage — an older or smaller turbine without permanent instrumentation — wireless vibration sensors can be added and integrated quickly, but the starting assumption is that the vibration data needed for early detection is already being generated and just needs to be analyzed continuously and intelligently rather than reviewed periodically by hand.
Is vibration monitoring enough on its own?
Vibration is the highest-impact place to start and the backbone of turbine condition monitoring, but no single technique covers every failure mode, so the strongest programs layer complementary streams. Vibration excels at the rotor and bearing faults — imbalance, misalignment, bearing defects, shaft instability — that cause most catastrophic turbine failures, detecting them two to eight weeks ahead. But oil analysis often catches rising wear-metal particles first and reveals lubricant condition vibration can't see, and for blade fatigue and erosion, vibration changes appear late, only after significant material loss — there, stage-efficiency and exhaust-temperature trending catch degradation six to twelve months out. Temperature trending confirms bearing and oil-film problems but lags vibration. Programs that combine vibration, oil analysis, and performance trending identify 85 to 95 percent of incipient faults before secondary damage, versus the 60 to 70 percent vibration catches alone. So vibration leads, and it's the right first investment, but pairing it with oil and performance data is what closes the remaining gaps in coverage.
Does this work for both steam and gas turbines?
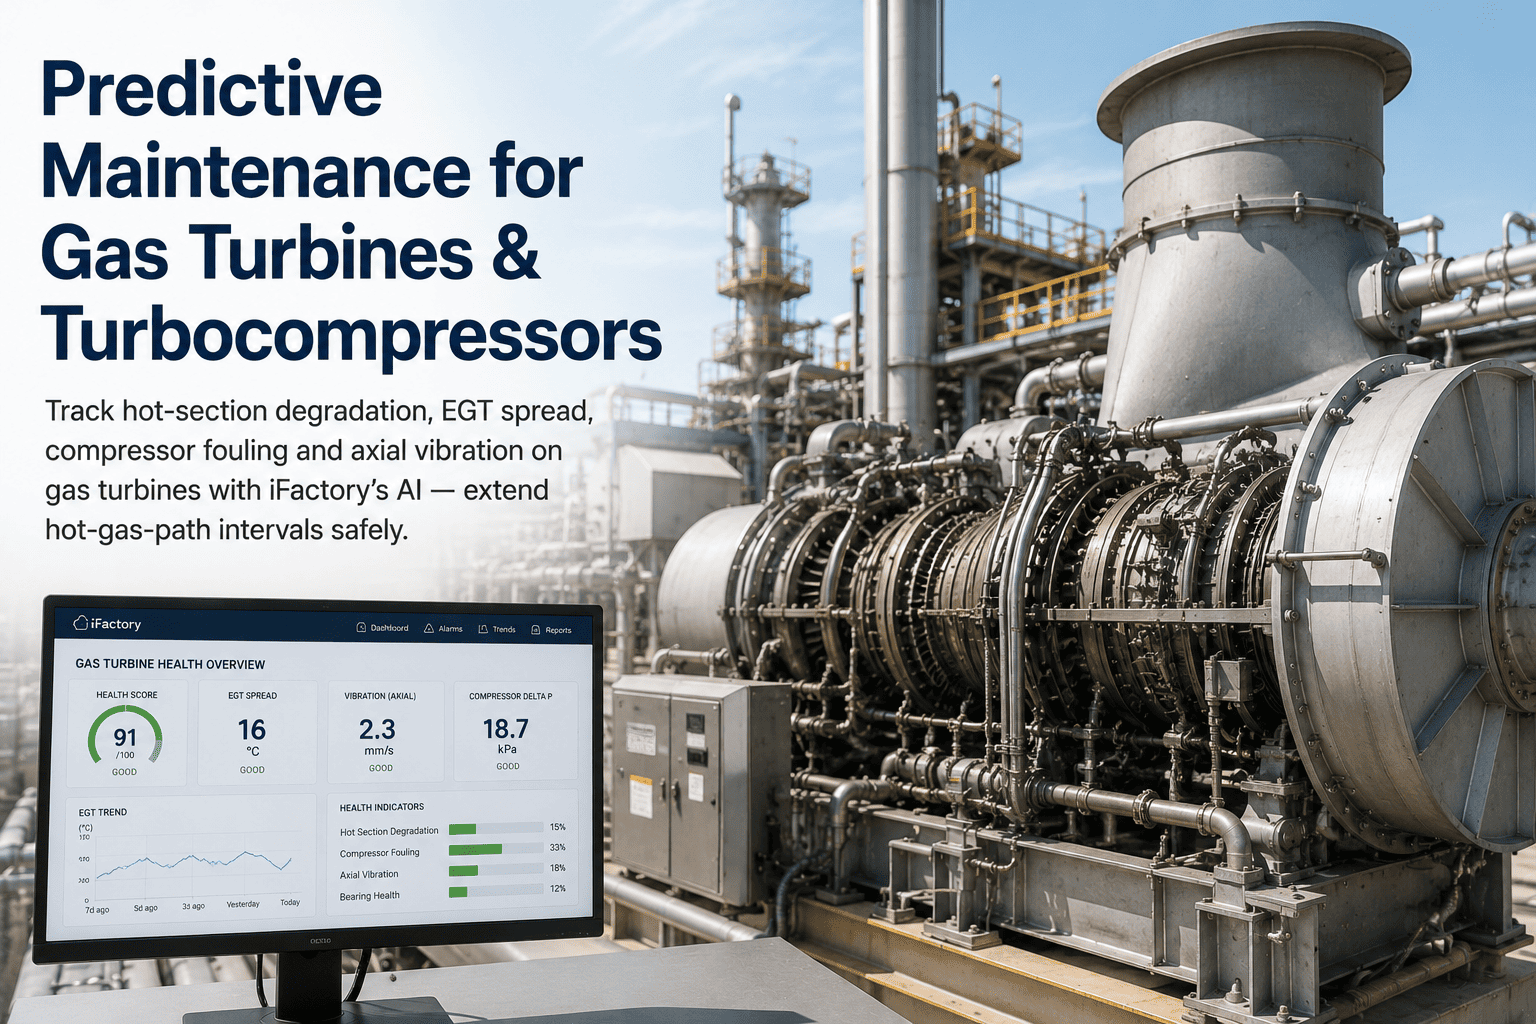
Yes. The core vibration signatures and the sensor approach apply to both, because both are rotor-bearing systems subject to the same fundamental faults — imbalance at 1×, misalignment at 2× with axial content, bearing defects at ball-pass frequencies, oil whirl below running speed, looseness, rub, and resonance. Steam turbines add failure modes like low-pressure blade liberation, thrust-bearing collapse, rotor rub, and differential-expansion issues, monitored across the LP, IP, and HP sections with proximity probes and bearing-temperature trending; gas turbines add hot-section concerns like blade fatigue that pair vibration with performance and exhaust-temperature analytics. The platform is configured to the specific turbine's design, and baselines are learned per unit from its own operating history, so the analytics fit the actual machine rather than a generic template. Whether the asset is a large steam turbine in a thermal plant or an aeroderivative gas turbine on reserve duty, the same trend-based, spectral, multi-technique methodology applies, tuned to that machine class. Contact
iFactory support to discuss your turbine fleet.
READ THE SPECTRUM · NAME THE FAULT · PLAN THE REPAIR
Catch Turbine Faults Weeks Early — and Turn a Rotor Rebuild Into a Four-Hour Bearing Swap.
Continuous multi-axis vibration trending against each turbine's baseline, spectral decomposition that names the fault in minutes, staged escalation from alert to critical, and a work order timed to the P-F window — layered with oil and performance data for 85 to 95 percent fault coverage, on the proximity probes and accelerometers you already have. Across steam and gas turbines, from first signal to saved machine.