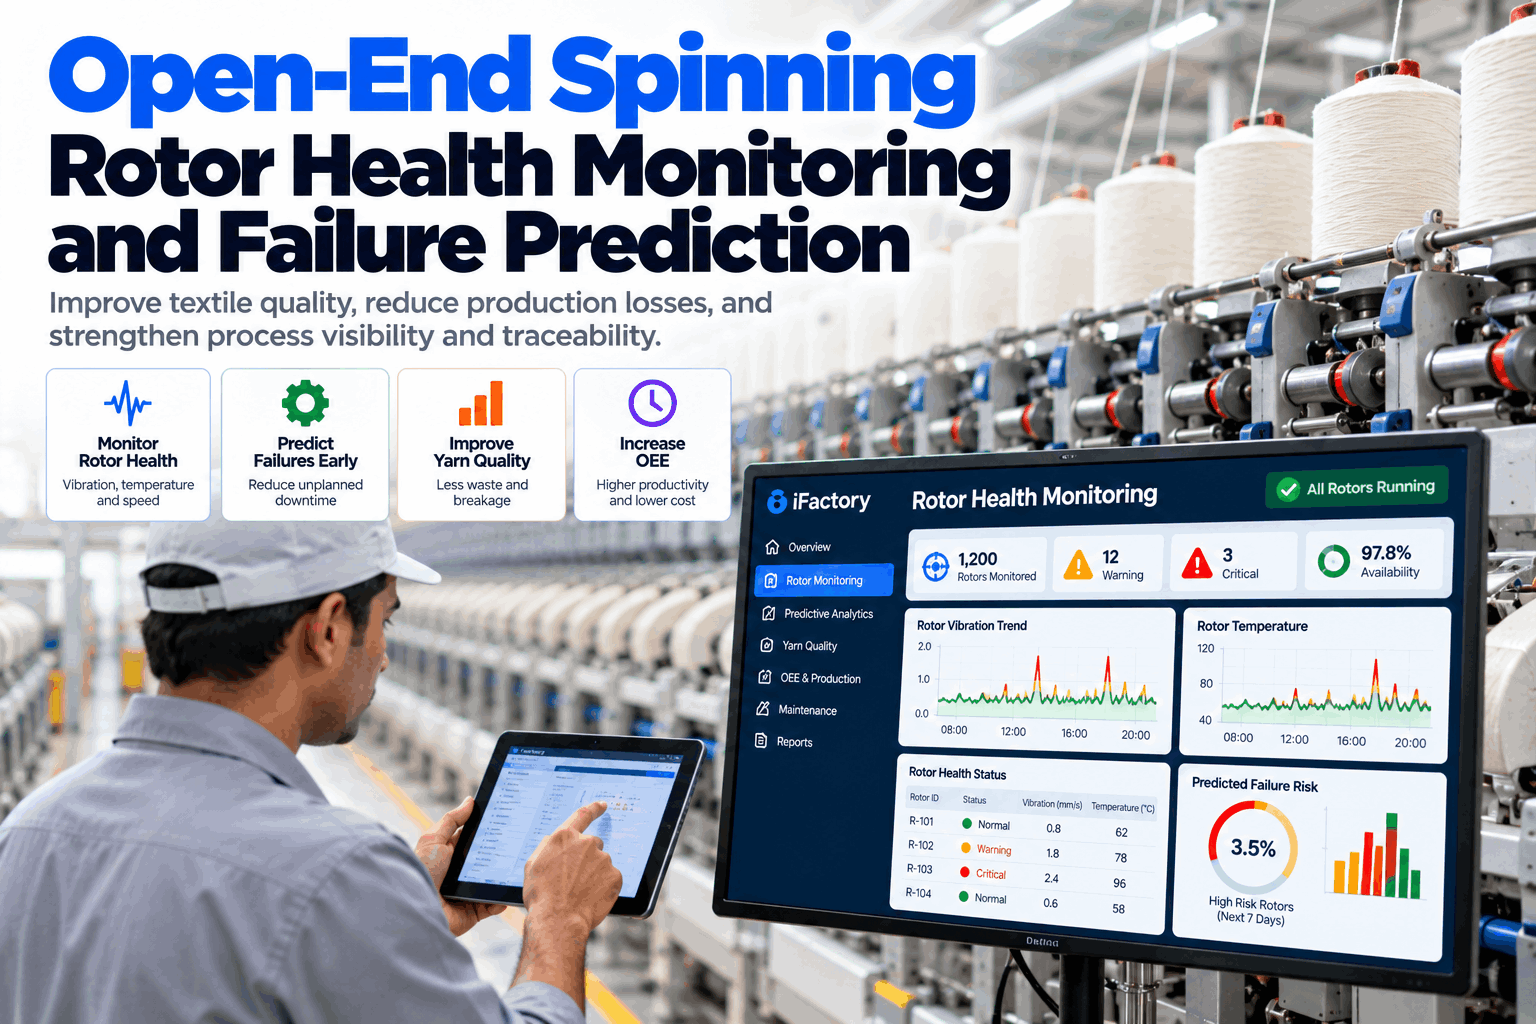
An open-end spinning rotor turns at well over 100,000 rpm, and it rarely fails without warning. Before a rotor bearing seizes or a groove clogs, the position usually shows a slow rise in vibration, a drift in yarn quality or a creeping count of ends down. Most mills see these signs only after yarn is downgraded or a customer complains. Rotor health monitoring watches every position continuously and tells the team which rotors to service before the yarn shows it. To see it on your own frames, book a rotor monitoring walkthrough.
Open-End Spinning Rotor Health Monitoring and Failure Prediction
The AI tracks vibration, temperature, drive load, suction and yarn breaks for every rotor position. It learns what a healthy rotor looks like, flags the ones drifting away and ranks them for the next service window.
- Which signals show a rotor going bad before yarn quality drops
- How yarn breaks and waste link back to rotor condition
- How findings reach maintenance and quality as ranked service lists
Rotor condition sits behind the top cause and the fifth. The dashed line marks where the cumulative share passes 80%. Bearing and drive problems cause few breaks, but they cause the longest stops.
Why Rotor Health Decides Yarn Quality
In open-end spinning, the rotor is where the yarn is made.
Fibres are collected in the rotor groove and twisted into yarn at very high speed. A small deposit in the groove, a worn bearing or a weak suction level changes the yarn in ways that are easy to miss until the lab tests show it. A single poor rotor can also raise breaks, waste and piecing load across its neighbours. Our spinning analytics team can show how this looks on your own frames.
Rotor groove
Deposits and wear change twist, strength and evenness.
Bearing and drive
Wear shows first as vibration and heat at high speed.
Opening roller
Wear and lapping send uneven fibre to the rotor.
Suction and spin box
Blocked ducts and leaks starve whole groups of rotors.
When several neighbouring positions drift together, the cause is often shared, such as a duct, a belt or a suction leak. Comparing positions with their neighbours separates a single bad rotor from a frame-level problem.
The Signals That Show a Rotor Going Bad
Each signal points to a different part of the spin box.
No single reading explains a rotor problem. Vibration and temperature point to the bearing and drive. Breaks and yarn data point to the groove and the feed. Suction explains whole groups. Together they separate a worn rotor from a process issue. To plan sensor coverage for your machines, book a sensor planning call.
Compare each rotor with its own past at the same speed and the same yarn count, and with its neighbours on the same frame. A change against its own baseline is a stronger lead than a fixed alarm limit.
What a Slow Rotor Problem Costs
A failing rotor rarely stops production. It quietly raises waste and downgrades yarn for weeks, which is why it is easy to miss and expensive to ignore.
From Signal to Service List
A prediction only helps if it reaches the maintenance team in time.
Rotor changes and cleaning fit best into planned stops. The AI turns drifting positions into a short ranked list, so a service round takes the worst rotors first and stays within the planned window.
Sense
Signals read from every position.
Baseline
Each rotor compared with its own history.
Score
Health score from all signals together.
Rank
Positions ordered by risk and yarn impact.
Plan
Service list sent to the next stop.
Verify
Breaks and yarn data checked after service.
Process Visibility and Traceability
Know which rotor made which yarn.
When a customer questions a lot, mills need to know where it was spun and in what condition the machine was. Linking each yarn lot to the frame, the positions and their health history turns a vague complaint into a short, evidence-based answer, and shows which positions need attention first.
Process visibility
- Frame and position heat maps of breaks
- Waste and ends down by shift and lot
- Rotor health shown next to yarn quality
Traceability
- Yarn lot linked to frame and position
- Service history for every rotor
- Evidence ready for quality reviews
Each flagged rotor should end with a recorded outcome: changed, cleaned, no fault found or still open. That record shows which patterns really lead to failures on your frames, and sharpens the next prediction.
How iFactory Rotor Monitoring Works
Raw signals in, a ranked service list out.
iFactory collects signals from machine controls and added sensors where needed, together with ends-down counts and yarn quality data. It sets a baseline for each rotor, scores health, ranks positions by risk and yarn impact, and sends the service list to your maintenance and quality teams. It runs on an on-prem server inside your mill network. Questions on fit go to our support desk.
Every position
Machine signals, breaks and yarn quality data.
Health scores
Baselines per rotor, compared with neighbours.
Clear leads
Each lead shown with the evidence behind it.
Service lists
Ranked rotors sent to the next planned stop.
Results depend on your machines, yarn counts, raw material and how quickly leads are acted on. We measure waste, breaks and quality on your own frames during the pilot, rather than promising a general figure.
Turnkey AI: Delivered, Connected and Live in 6–12 Weeks
You do not build this. It arrives ready.
iFactory ships as a pre-configured NVIDIA AI server with the software pre-loaded. Rack it, plug in power and Ethernet, and the AI is live on your network. Our team handles cabling, network setup, machine and PLC integration, team training and 24×7 remote monitoring. Data stays on your own network. For a scope matched to your mill, request a turnkey quote.
Ship, network and data
Server installed. Machine signals, break counts and yarn data connected for the pilot frame.
Baseline and pilot
Rotor baselines built. Leads checked with your maintenance and quality teams.
Go-live and training
Service lists and alerts live. Teams trained. 24×7 remote monitoring begins.
Frequently Asked Questions
What is spinning rotor health monitoring?
It is the continuous tracking of signals from each open-end rotor position, so wear and fouling can be found and fixed before they cause breaks, waste or off-quality yarn.
Which signals matter most?
Bearing vibration and temperature give the earliest mechanical warning. Ends down, piecing results and yarn quality data show effects on the yarn, and suction explains problems that affect many positions at once.
Can it work with our existing machines?
Usually, yes, if the machine controls can share data or sensors can be added. We confirm what is available on your frames during the first call.
How does it reduce yarn waste and breaks?
By finding rotors that drift early, so they are cleaned or changed in a planned stop. Fewer degraded positions mean fewer breaks and less downgraded yarn.
Does it cover ring spinning spindles too?
The same method of baselines, health scores and ranked service lists can be extended to ring frames and spindles. We usually start with one machine type and widen the scope after the pilot.
How do we start?
With one frame that has a recurring break or quality problem. A 6-week pilot connects the signals, builds baselines and checks the leads with your team. To plan it, contact our team.
Fix the Rotor Before the Yarn Shows It
In thirty minutes we look at the signals you already collect, the breaks and waste that cost you most and how leads could reach your maintenance team. You keep the notes whether or not you go further with iFactory.
- 1Machine make, model and rotor count
- 2A few weeks of ends-down and waste data
- 3Yarn quality reports by lot
- 4Rotor and bearing change records
- 5The positions or frames you worry about most