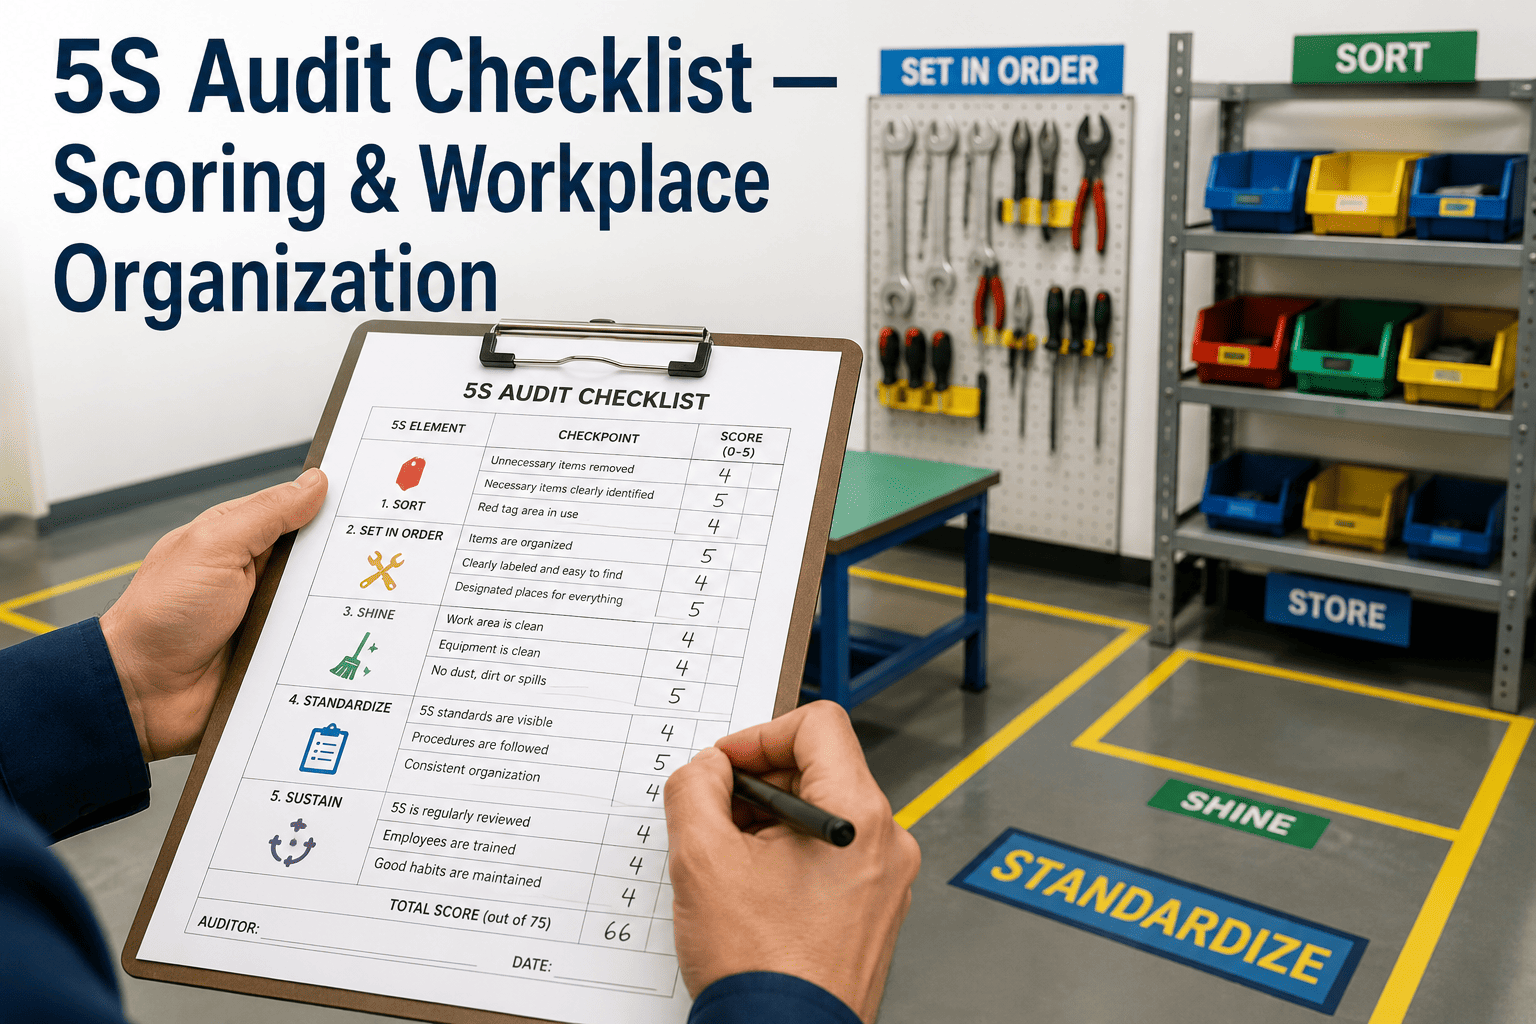
Walk into two factories and you can usually tell within thirty seconds which one runs a real 5S program and which one just laminated a poster in 2019. Tools have a home, aisles are clear, labels are legible, and nobody is hunting for a wrench between shifts. The gap between those two factories rarely comes down to effort, it comes down to whether Sort, Set in Order, Shine, Standardize, and Sustain are actually measured with a repeatable digital scoring checklist instead of a memory-based walkthrough. Plants that want that same consistency can book a demo and see how scoring works in practice.
5S AUDIT PROGRAM · WORKPLACE ORGANIZATION · 2026
Score Every 5S Pillar the Same Way, Every Time
A digital 5S audit checklist that scores Sort, Set in Order, Shine, Standardize, and Sustain consistently across every line, shift, and auditor, with photos attached to every finding.
Why Most 5S Programs Quietly Die
5S almost always starts strong. There is a launch event, a training session, and a burst of red-tag activity that clears years of clutter in a single weekend. The trouble shows up three or four months later, when the initial energy fades and audits become inconsistent, subjective, or simply skipped when the plant gets busy. One auditor scores a cluttered tool cabinet a 3 out of 5 because they know the team is trying, while another auditor on a different day scores the same cabinet a 1 because they are stricter by nature. Without a standardized, digital scoring structure, 5S drifts from a discipline into a once-a-year event that nobody quite trusts.
A properly built 5S audit checklist removes that subjectivity by giving every pillar clear, weighted scoring criteria that any auditor can apply the same way, on a tablet, on the floor, in the moment the observation happens rather than reconstructed later from memory.
There is also a second, quieter failure mode worth naming. Even plants that do audit consistently often stop looking at the resulting data. Scores get recorded, filed, and never compared week over week, which means a slow decline in Sustain can go unnoticed for months even though every individual audit was technically accurate. The value of a 5S program compounds only when someone is actually watching the trend line, not just collecting the raw score.
Manufacturing teams that treat 5S as a genuine operational discipline, rather than a compliance exercise tied to a certification audit, consistently report fewer near-miss incidents, faster changeovers, and less time spent searching for tools or materials. None of those outcomes come from the initial cleanup weekend, they come from the accumulated effect of hundreds of small corrections that only happen when scoring is consistent enough to be trusted.
The Real Cost of Inconsistent Scoring
It is worth being specific about what inconsistent 5S scoring actually costs a plant beyond the obvious frustration it causes among team leaders. When scores cannot be trusted, leadership loses the ability to make resourcing decisions based on the data. An area that genuinely needs additional labor or a redesigned storage layout might be scoring well simply because its auditor is lenient, while a well-run area with a strict auditor looks like it needs intervention it does not actually require. Capital and attention end up misallocated, and the teams who are actually struggling do not get the support they need.
There is also a trust cost that is harder to quantify but just as real. Team leaders who feel their area was scored unfairly, even if the difference is small, tend to disengage from the program faster than leaders who receive a consistent, well-documented score they can act on. Once disengagement sets in among a handful of influential team leaders, it spreads, and the program that started with genuine enthusiasm becomes something people go through the motions of rather than something they believe in.
A digital scoring system addresses both problems at once. Consistent criteria mean leadership can trust the data enough to act on it, and team leaders receive scores backed by photographic evidence rather than a number that feels arbitrary, which preserves the credibility the program needs to survive past its first year.
S1
Sort
Only what is needed for current work stays at the station, everything else is red-tagged and relocated or removed entirely.
S2
Set in Order
Every remaining item has a labeled, marked, and visually obvious home so anyone can find or return it in seconds.
S3
Shine
Cleaning becomes inspection, surfacing leaks, wear, and early failure signs before they turn into downtime.
S4
Standardize
The first three S's are written down as a repeatable standard that survives shift changes and staff turnover.
S5
Sustain
Regular scored audits, visible trend lines, and accountability keep the standard alive long after the launch event ends.
DIGITAL 5S SCORING
Turn Subjective Walkthroughs Into Consistent Scores
See how a weighted 5S checklist keeps every auditor, every line, and every shift scoring on the same scale.
What a Weighted Scoring Checklist Actually Covers
Generic 5S templates tend to treat every question as equally important, which flattens the score and hides the pillars that matter most for a given area. A weighted checklist assigns more points to items with real operational or safety consequence, such as blocked emergency exits or unlabeled chemical containers, and fewer points to cosmetic issues, so the final score actually reflects risk rather than just tidiness.
Weighting also has a secondary benefit that plants often discover only after using the system for a few months: it changes what teams choose to fix first. When every deficiency scores the same, teams naturally gravitate toward whatever is quickest to fix rather than whatever matters most, and a cracked floor marking gets repainted before a genuinely hazardous storage practice gets corrected. Once weighting makes clear which findings carry the most risk, corrective effort follows the score, and the pillars that matter most for safety and operational continuity get addressed first.
| Pillar | Sample Audit Criteria | Typical Weight |
|---|---|---|
| Sort | No unnecessary items, obsolete tooling, or personal items at the station | High |
| Set in Order | Shadow boards, floor markings, and labels match what is actually stored | High |
| Shine | Machines, floors, and surfaces free of leaks, spills, and buildup | Medium |
| Standardize | Written standard is posted, current, and matches observed practice | Medium |
| Sustain | Previous audit findings closed out with evidence, not just marked done | High |
Running an Audit in Four Steps
1
Walk the Area
Auditors move through a defined zone with a tablet checklist scoped to that specific area's known risks.
2
Score and Photograph
Each finding is scored against the standard and backed by a timestamped photo, removing any ambiguity later.
3
Assign Corrective Actions
Low-scoring items automatically generate an action with an owner and due date instead of sitting in a report.
4
Track the Trend
Scores roll up by area and by pillar over time, showing exactly where discipline is holding or slipping.
Getting Buy-In Across Shifts and Teams
Even the best-designed scoring system will struggle if it is introduced as something being done to teams rather than something built with them. Plants that see the strongest long-term adoption typically involve team leaders in defining the specific criteria for their own areas before the checklist goes live, which gives those leaders a sense of ownership over the standard rather than a feeling that an arbitrary rule was imposed from above. It also surfaces practical details that someone outside the area might miss, such as a storage constraint that makes a generic criterion unrealistic for that specific space.
Transparency around scoring matters just as much once the program is running. Teams that can see their own historical scores, understand exactly why points were deducted through the attached photos, and know what a passing score requires tend to engage with corrective actions far more readily than teams who only receive a number without context. Publicly displayed trend charts, whether on a shop floor screen or in a shared dashboard, also introduce a healthy element of friendly comparison between shifts and areas that many plants find accelerates improvement faster than top-down mandates ever could.
It is worth planning for a short adjustment period after rollout, since teams accustomed to lenient paper scoring sometimes see their digital scores drop initially even though nothing about the area has actually gotten worse. Framing this clearly as a reset to an accurate baseline, rather than a sudden decline in performance, helps prevent discouragement in those first few weeks while the new standard settles in.
What Plant Teams Say After Switching
We used to argue about whether a station deserved a 3 or a 4. Now the checklist scores it the same way every time, and the trend chart makes it obvious within a week which team leader is actually following through and which one needs a nudge.
Continuous Improvement Lead, Component Assembly Plant
Frequently Asked Questions
How is a digital 5S score different from a paper checklist total?
A paper checklist usually adds up simple yes or no answers into a single number, which treats a missing fire extinguisher tag the same as a slightly crooked label. A digital scoring checklist applies weights to each criterion based on real operational risk, attaches a photo to every finding for verification, and automatically calculates pillar-level and area-level scores so leadership can see exactly where the gap sits rather than a single flattened total that hides the detail. It also removes the delay between an observation and a corrective action, since findings route directly into a tracked task rather than sitting in a paper report until someone transcribes it later.
Can the checklist be customized for different areas of the plant?
Yes, most plants run several checklist variants since a warehouse aisle, a machine shop bay, and an office area each have different Sort and Shine expectations. Criteria, photo requirements, and scoring weights can all be adjusted per area type, while the underlying five pillar structure and reporting format stay consistent so scores can still be compared fairly across the whole facility.
What happens to a finding after it gets a low score?
A low score on any item automatically opens a corrective action with a suggested owner based on the area, a due date, and a reference back to the original photo and criteria. The item stays open and visible on the team's dashboard until someone closes it with evidence such as a follow-up photo, and it is checked again automatically on the next scheduled audit to confirm it has actually stuck rather than just being marked complete.
How often should 5S audits run to keep scores meaningful?
Weekly audits on a rotating schedule across areas tend to produce the most useful trend data without overloading the audit team, though some high-risk zones such as chemical storage or electrical panels are often audited more frequently. What matters more than exact frequency is consistency, since a program that audits reliably every week will surface drift far faster than one that runs a thorough audit only once a quarter. Larger facilities sometimes stagger audits so that every area is covered exactly once within a defined cycle, which keeps the audit workload predictable for the team responsible while still ensuring no area goes unchecked for an extended stretch. Teams can review a suggested cadence through support.
Can we see historical scores before committing to a rollout?
Plant leaders can book a demo to walk through sample scoring dashboards built from real audit patterns, including how trend lines look for an area that is improving versus one that is quietly sliding back toward its pre-5S state, before deciding how a rollout would fit their own facility.
Common Mistakes Plants Make When Digitizing 5S
Moving from paper to digital scoring solves the consistency problem, but it can introduce new mistakes if the transition is rushed. The most common one is simply digitizing an existing paper checklist without revisiting whether its criteria are actually well-defined. If a paper checklist item reads "area is tidy" with no further detail, converting it into a digital checkbox does not fix the underlying ambiguity, it just moves the same subjective judgment onto a different device. The criteria themselves need to be rewritten with specific, observable language before digitizing adds any real value.
A second common mistake is treating the rollout as purely a technology project handled by IT or continuous improvement staff without operations leadership involvement from the start. Programs that succeed long-term tend to have a visible executive sponsor who reviews trend data regularly and asks questions about declining scores in the same meetings where production numbers get discussed, which signals to the whole organization that the program is a genuine operational priority rather than a side initiative.
Finally, plants sometimes over-correct by making the checklist so exhaustive that audits take far longer than necessary, which discourages the frequent, lightweight auditing that actually drives improvement. A focused checklist that captures the criteria that matter most, completed quickly and often, consistently outperforms an exhaustive one that gets completed rarely because it is too burdensome to run on a regular schedule.
5S AUDIT PROGRAM · WORKPLACE ORGANIZATION
Make Every 5S Score Consistent and Trusted
Replace subjective walkthroughs with a weighted digital checklist your whole plant can rely on.