An aluminium smelter is, at its core, the largest electricity bill in heavy industry wearing the disguise of a metals plant. The world's smelters together draw roughly three and a half percent of all the electricity generated on the planet, and inside any single plant, electricity is the dominant cost of every kilogram produced. The whole drama plays out in the pot line — hundreds of electrolysis cells wired in series, each pulling hundreds of thousands of amperes, each quietly running a little more or less efficiently than its neighbours. The plants that win the energy game are the ones that can see down to the individual cell, because that is where the kilowatt-hours leak. An iFactory energy layer is what makes that cell-level visibility real.
iFactory · Primary Aluminium Energy Monitoring
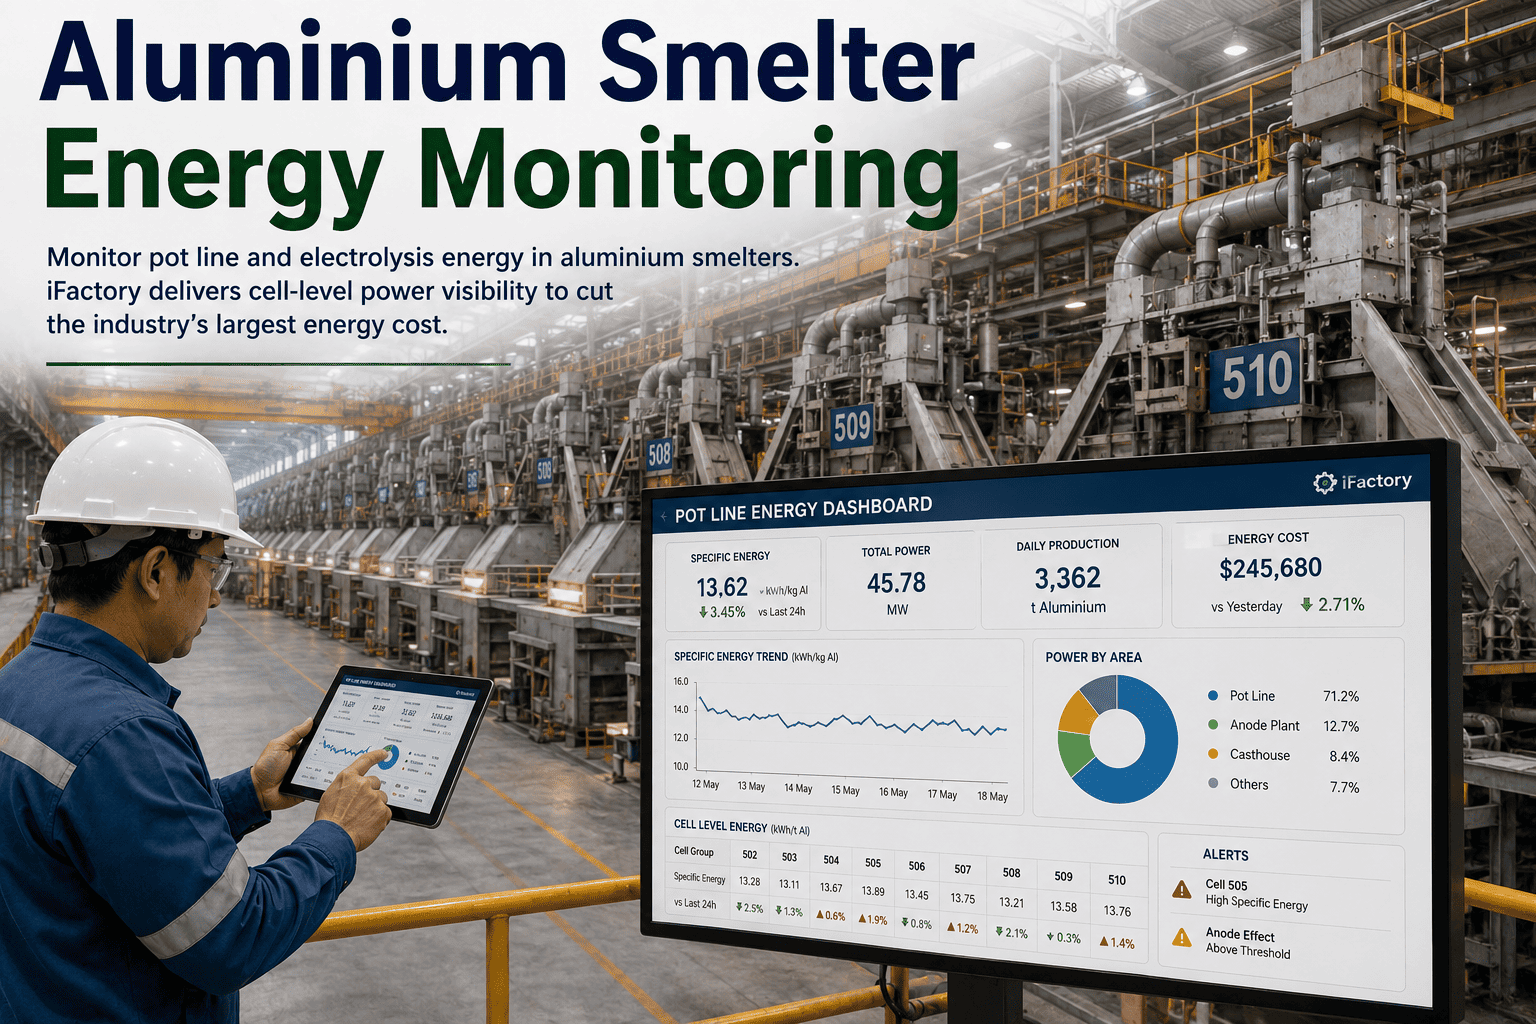
Pot Line Energy Monitoring, Down to the Individual Cell
Electrolysis is the single largest energy cost in primary aluminium. Cell-level power visibility turns a plant-wide kWh number into a map of exactly where the energy goes — and where it is being wasted, pot by pot.
~13
kWh/kg in the best smelters today
~6.2
kWh/kg theoretical minimum
3.5%
of all global electricity used by smelters
100s
of cells in series on one pot line
The Gap That Defines the Opportunity
Here is the number that frames everything. The theoretical minimum energy to produce a kilogram of aluminium is around 6.2 kWh. The best smelters in the world run near 13 kWh/kg, and the global average is closer to 15. That gap — roughly double the theoretical floor — is not waste you can eliminate entirely; much of it is unavoidable heat that keeps the bath molten. But a meaningful slice of it is recoverable inefficiency, and you cannot recover what you cannot see. The first job of energy monitoring is simply to show where your real number sits against the benchmark, and which cells are dragging the average.
Theoretical minimum (kWh/kg)
Best smelters today
Global average
Where the Energy Goes Inside One Cell
To know what to monitor, you have to know where the volts go. A Hall-Héroult cell runs at roughly 4.2 volts, but the chemistry of splitting alumina only requires about 1.2 volts. Everything above that decomposition voltage is, in energy terms, overhead — overpotential, ohmic resistance in the bath, and losses in the anodes, cathodes, and busbars. Some of it is irreducible. Some of it is exactly what creeps when a cell drifts out of its sweet spot. Monitoring cell voltage and its components is how you tell the two apart.
Decomposition voltage
~1.2 V
Overpotential, ohmic & busbar losses
~3.0 V
Total cell voltage
~4.2 V
The Series Trap: One Bad Pot Drags the Whole Line
This is the dynamic that makes cell-level monitoring non-negotiable. The cells on a pot line are wired in series, so the same current flows through every one of them. When a single cell misbehaves — an anode effect, low alumina, an unstable bath — it does not just waste its own energy. An anode effect can spike a cell's voltage to many times normal and force the whole line's amperage down, so every other cell produces less metal for the same power. A plant-level meter averages all of this away. Only cell-level visibility shows you the one pot that is quietly taxing the other three hundred.
Same current through all. One cell's anode effect surges its voltage and pulls the entire line's amperage down — lost metal across every pot.
What Cell-Level Monitoring Actually Catches
Once you can see each pot, the problems that used to hide in the plant average become visible, individual, and fixable. These are the events and drifts that quietly inflate kWh per kilogram.
Anode effects
Voltage surges from low alumina that waste energy and emit potent greenhouse gases. Catch them early and feed before they fire.
Cell voltage drift
A pot slowly running hotter and higher-voltage than its neighbours — recoverable energy bleeding away one millivolt at a time.
Current efficiency loss
When less of the current turns into metal, energy per kilogram climbs. Each percentage point of efficiency is worth real money at scale.
Anode irregularities
Uneven anode current is behind a large share of pot problems. Spotting an outlier anode early keeps the cell stable and efficient.
Want to see which of your pots are dragging your line's kWh/kg right now? Talk to a smelting energy specialist and we will baseline your pot line cell by cell.
From Plant Meter to Cell Map
The shift that monitoring delivers is from a single bill you cannot act on to a live map you can. Same process, same cells — radically different visibility.
One plant-level kWh number on the bill
becomes
kWh/kg tracked per cell, live
Anode effects found after the fact
becomes
Voltage surges flagged as they build
A drifting pot hidden in the average
becomes
The outlier cell named and ranked
Current efficiency known monthly
becomes
Efficiency trended cell by cell
A line trip discovered too late
becomes
Power-network faults caught in seconds
Want your whole pot line on one live energy map, with the worst cells ranked first? Book a demo and we will scope it to your cell count.
Frequently Asked Questions
How much energy does aluminium smelting really use?
The best smelters run near 13 kWh per kilogram of aluminium, with the global average closer to 15, against a theoretical minimum of about 6.2 kWh/kg. Electrolysis is the dominant energy cost in primary aluminium, and the world's smelters together consume roughly 3.5% of all global electricity. That scale is why even small per-cell improvements add up fast.
Why monitor at the cell level instead of the plant?
Because the cells run in series, a single misbehaving pot affects the entire line — but a plant-level meter averages that away. Cell-level monitoring shows you the specific pot that is drifting high-voltage, having anode effects, or losing current efficiency, so you can act on the actual source instead of guessing from a blended number.
What is an anode effect and why does it matter for energy?
An anode effect happens when alumina in the bath runs too low, causing a sudden surge in cell voltage to many times normal. It wastes energy directly, emits potent perfluorocarbon greenhouse gases, and because of the series wiring can pull the whole line's amperage down — reducing metal output across every cell. Early detection lets you feed alumina before it fires.
How does current efficiency tie into energy per kilogram?
Current efficiency is the share of the current that actually becomes aluminium rather than being lost to re-oxidation and shorting. When it falls, you spend the same power but get less metal, so energy per kilogram rises. Modern cells run around 90–95%, and at industry scale a single percentage point is worth a great deal — which is why trending it per cell matters.
Do we need to replace our pot control system?
No. An energy monitoring layer is designed to sit on top of your existing cell control and power infrastructure, ingesting the voltage, current, and process signals you already generate and turning them into cell-level KPIs, trends, and alerts. It complements the pot controllers rather than replacing them, so the visibility comes without a rip-and-replace project.
The biggest energy cost in the plant deserves the sharpest visibility.
See Your Pot Line's Energy — Cell by Cell
Bring one pot line. We will turn your cell voltage, line current, and process data into live kWh/kg per cell, rank the pots dragging your average, flag anode effects and voltage drift as they build, and catch power-network faults in seconds instead of hours. Turnkey: an energy layer over your existing pot control, no rip-and-replace, live in weeks not quarters.
Per-cell
kWh/kg, not a plant average
~13
kWh/kg benchmark to beat
Live
anode-effect and drift alerts
Weeks
to live on your pot line