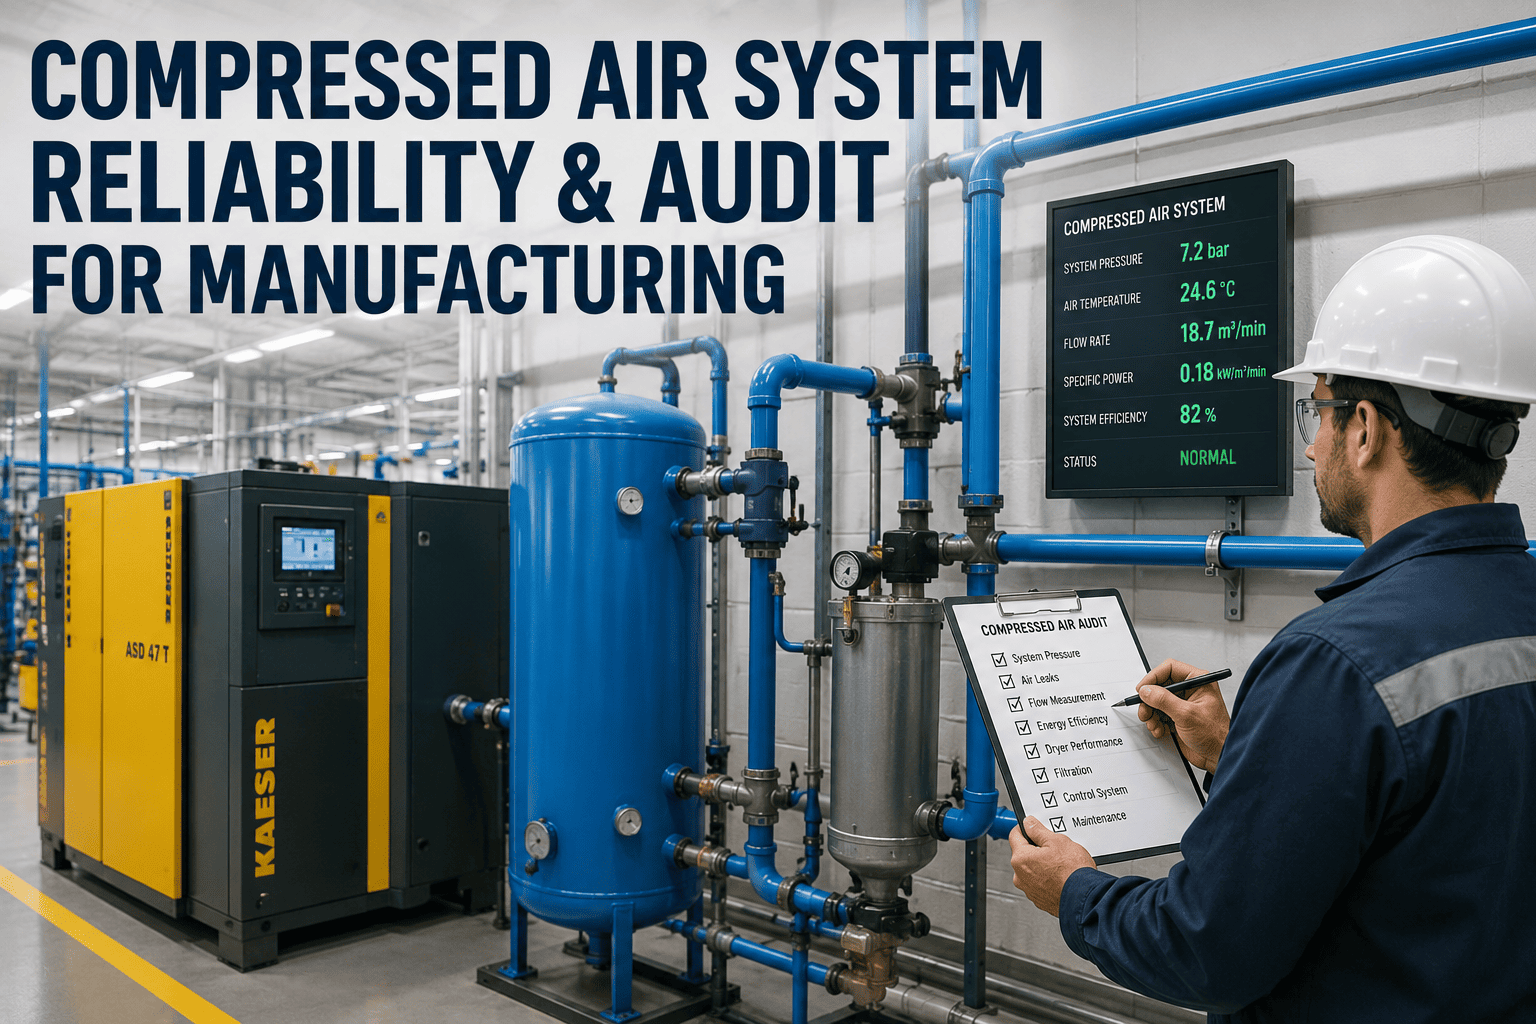
Compressed air is one of the most expensive utilities in an automotive plant, and much of it never does useful work. It powers tools, robots, clamps, paint equipment and blow-off, but leaks, open blowing and oversupplied pressure waste a large share of what the compressors make. Because air is clean, invisible and always there, the waste rarely shows up on anyone’s daily measures. This guide explains where compressed air goes, how to measure leakage, how to run a leak program that stays fixed, which uses to replace and how to manage the supply side. To see compressed air tracked per vehicle, book a short walkthrough.
Compressed Air System Efficiency in Automotive Plants: Find, Fix and Prevent Air Loss
Leaks measured and fixed, poor uses replaced, pressure set to real need and compressors run to demand, with air energy tracked per vehicle like any production cost.
Why Compressed Air Waste Stays Hidden
Compressed air feels free at the point of use. An operator opening a blowgun or a fitting hissing behind a conveyor has no visible cost. Yet producing compressed air takes a lot of electricity, and most of the energy put into a compressor leaves as heat rather than useful work at the tool. That makes every wasted cubic metre expensive.
The Compressed Air Challenge, a collaboration backed by the US Department of Energy, reports that leaks can waste 20–30% of a compressor’s output in a typical plant that has not been maintained, while a proactive program can hold leakage under 10%. Automotive plants, with thousands of fittings, quick couplings and hoses on robots and tools, are exactly the kind of site where leaks multiply.
Leaks also cause pressure loss at the point of use. Plants often respond by raising system pressure, which makes every leak worse and adds energy to every productive use as well. The waste compounds.
The first step is to measure what the system really delivers and where it goes. We can review your air system data on a call.
Mapping Compressed Air Use
A useful map splits air into productive use, necessary process use and waste.
Many actuators and fittings on fixtures and robots, with frequent hose wear.
Quality-critical air, often with strict dryness and cleanliness needs.
Pneumatic nutrunners, balancers and assists across long lines.
Part ejection and cleaning, often using open blowing.
Blowguns and portable tools, frequently left connected.
Fittings, couplings, drains and equipment pressurized off shift.
Sub-metering by shop turns this map into numbers. Flow meters at the main headers show which areas consume most, and comparing flow with production shows which areas waste most when nothing is being built.
Most plants find a few areas carry most of the waste. We help locate them in a site review.
How to Measure Leakage
The simplest leak measurement uses the compressors themselves during a non-production period, such as a Sunday morning, when productive demand is close to zero.
Illustrative. With production stopped, compressor loading is almost entirely leaks and equipment left pressurized.
Plants with flow meters can measure more directly: the flow delivered on a Sunday with no production is the leak and idle-demand baseline. Tracking it every weekend shows whether a leak program is working or whether leaks are returning.
Some care is needed with interpretation. Equipment that stays pressurized over the weekend by design is not a leak, but it is still idle demand that may be avoidable. Isolating zones that do not need air off shift separates the two and often yields savings of its own.
The weekend baseline is one of the most useful single numbers in an air system. We set it up during every rollout.
Running a Leak Program That Stays Fixed
Many plants run a leak survey, fix the leaks and see them return within months. A program that lasts has a clear cycle.
Record the weekend baseline flow or leak percentage.
Survey with ultrasonic detectors, zone by zone.
Tag each leak with location, size estimate and priority.
Repair, prioritizing the largest leaks and easy fixes.
Re-measure the baseline to confirm the saving.
Survey on a regular cycle and track the trend.
The Compressed Air Challenge notes that leaks commonly appear at couplings, hoses, tubes, fittings, pipe joints, quick disconnects, filters, regulators, lubricators, condensate traps and valves. In automotive plants, robot dress packs and tool hoses deserve special attention because they flex constantly.
The program must have an owner and a measure. Assigning leak repair to maintenance without a baseline to track usually fails; tracking the weekend baseline weekly gives the team a visible result for their work.
Linking leak tags to the CMMS keeps repairs from being forgotten. Ask our team how the two connect.
Replacing Poor Uses of Compressed Air
Some uses of compressed air could be done more cheaply another way. The Compressed Air Challenge lists common examples.
| Use | Common in auto plants | Cheaper option |
|---|---|---|
| Open blowing and drying | Press shop part cleaning, body wipe | Low-pressure blowers, air knives or engineered nozzles |
| Personnel cooling | Hot areas in body and paint shops | Fans |
| Cabinet cooling | Electrical panels near hot processes | Panel air conditioners or fans |
| Vacuum generation | Grippers and part handling | Dedicated vacuum pumps where use is large |
| Aspirating and atomizing | Some cleaning processes | Low-pressure blowers where quality allows |
| Idle equipment | Tools and fixtures pressurized off shift | Zone isolation valves on a schedule |
Not every use can change. Paint atomizing and some precision processes need compressed air at a specific quality. The point is to question each use rather than assume it is necessary.
Open blowing with hand blowguns is often the easiest win. Engineered nozzles use less air for the same effect and reduce noise, while shutoff valves on unused lines stop air flowing to equipment that is not in use.
Most plants find open blowing and idle equipment are the largest avoidable uses. Our specialists help rank them.
Managing Compressors, Pressure and Air Quality
Once demand is under control, the supply side can be matched to it.
Pressure is the lever that links supply and demand. Many plants run a higher header pressure than any user needs because a few distant or undersized points complain. Fixing those points, or boosting locally, often allows the whole system to run lower.
Supply-side changes are most effective after leaks and poor uses are addressed. See the full picture in a demo.
Compressed Air Efficiency Checklist
Use this checklist to organize compressed air work across the plant.
Plants that track the weekend baseline weekly rarely let leaks drift back. We help set up the tracking in an air review.
What Compressed Air Efficiency Is Worth
Compressed air savings are usually among the fastest paybacks in a plant.
The Compressed Air Challenge example of $8,382 a year for a single 1/4 inch leak shows why numbers add up quickly in a plant with many leaks. The exact value depends on your electricity price, pressure and running hours, so the business case should be built from your own baseline.
A weekend baseline test is the fastest way to size the opportunity. Book one with our advisors.
How iFactory Delivers Compressed Air Efficiency
Air use mapped to body, paint, assembly and press.
Leak and idle demand measured every weekend.
Tags linked to CMMS work orders and verified.
Pressure loss and setpoints monitored.
Specific power and sequencing watched.
Compressed air energy reported as a production cost.
It works with your compressor controllers, flow meters and CMMS. Share a month of compressor data and we will show your weekend baseline in a session.
See How Much Air Your Plant Uses on a Sunday
Share compressor and flow data for a month. We measure your weekend baseline, estimate leakage and show where the first savings are.
With production stopped, compressors still supply 31% of weekday average flow. That is the leak and idle-demand baseline.
A Weekend Baseline That Rose
This exchange shows how a utilities engineer might use iFactory.
iFactory ships as a pre-configured NVIDIA AI server, racked and ready with the compressed air and utility analytics models loaded. Rack it, plug in power and Ethernet, and the AI is live on your network. Our scope covers sensors and data connections across compressors, dryers, headers and shop distribution, PLC/SCADA, MES, CMMS and ERP integration, cabling and network setup, operator and quality team training, and 24×7 remote monitoring.
Server installed, PLC, MES and ERP links live, historical production, quality and maintenance data loaded.
Models calibrated on your own lines, then run in advisory mode on one line or area with your planners and engineers reviewing every output.
Rollout to the agreed lines under your change management, planner, supervisor and engineer training, and 24×7 remote monitoring in place.
Software, server and integration come as one package. For pricing on your plant, contact our sales team.
Frequently Asked Questions
The Compressed Air Challenge reports that leaks typically waste 20–30% of compressor output in plants without a maintenance program, while well-maintained systems stay under 10%.
During a non-production period, time how long compressors spend loaded (T) and unloaded (t). Leakage as a share of capacity is T × 100 ÷ (T + t). Flow meters give a direct weekend baseline.
Couplings, hoses, tubes, fittings, pipe joints, quick disconnects, filters, regulators, lubricators, condensate traps and valves, plus robot dress packs and tool hoses in auto plants.
Open blowing, personnel cooling, cabinet cooling, some vacuum generation and idle equipment are common candidates for cheaper alternatives.
Yes. A widely used rule of thumb from US DOE guidance is that each 2 psi of extra pressure adds about 1% to compressor energy, so pressure should be set to real point-of-use need.
A plant air system can typically be metered and tracked within a 6–12 week rollout. Plan it with our engineers.
Stop Paying to Compress Air That Leaks Away
iFactory measures your weekend baseline, links leak repairs to maintenance and tracks compressed air energy per vehicle, so savings are found, fixed and kept.
Illustrative. Leaks of 20–30% are typical in unmaintained plants; well-run systems stay under 10%.