Walk onto two identical production lines and ask what caused yesterday's downtime, and you will often get two different answers for the exact same ten-minute stoppage. One operator logs a mechanical fault, another calls it a minor stop, and a third leaves it as miscellaneous. Multiply that inconsistency across shifts, lines and plants, and the OEE number reaching leadership stops reflecting what actually happened on the floor. Teams that want OEE numbers they can act on can see how iFactory AI standardizes downtime codes across every line.
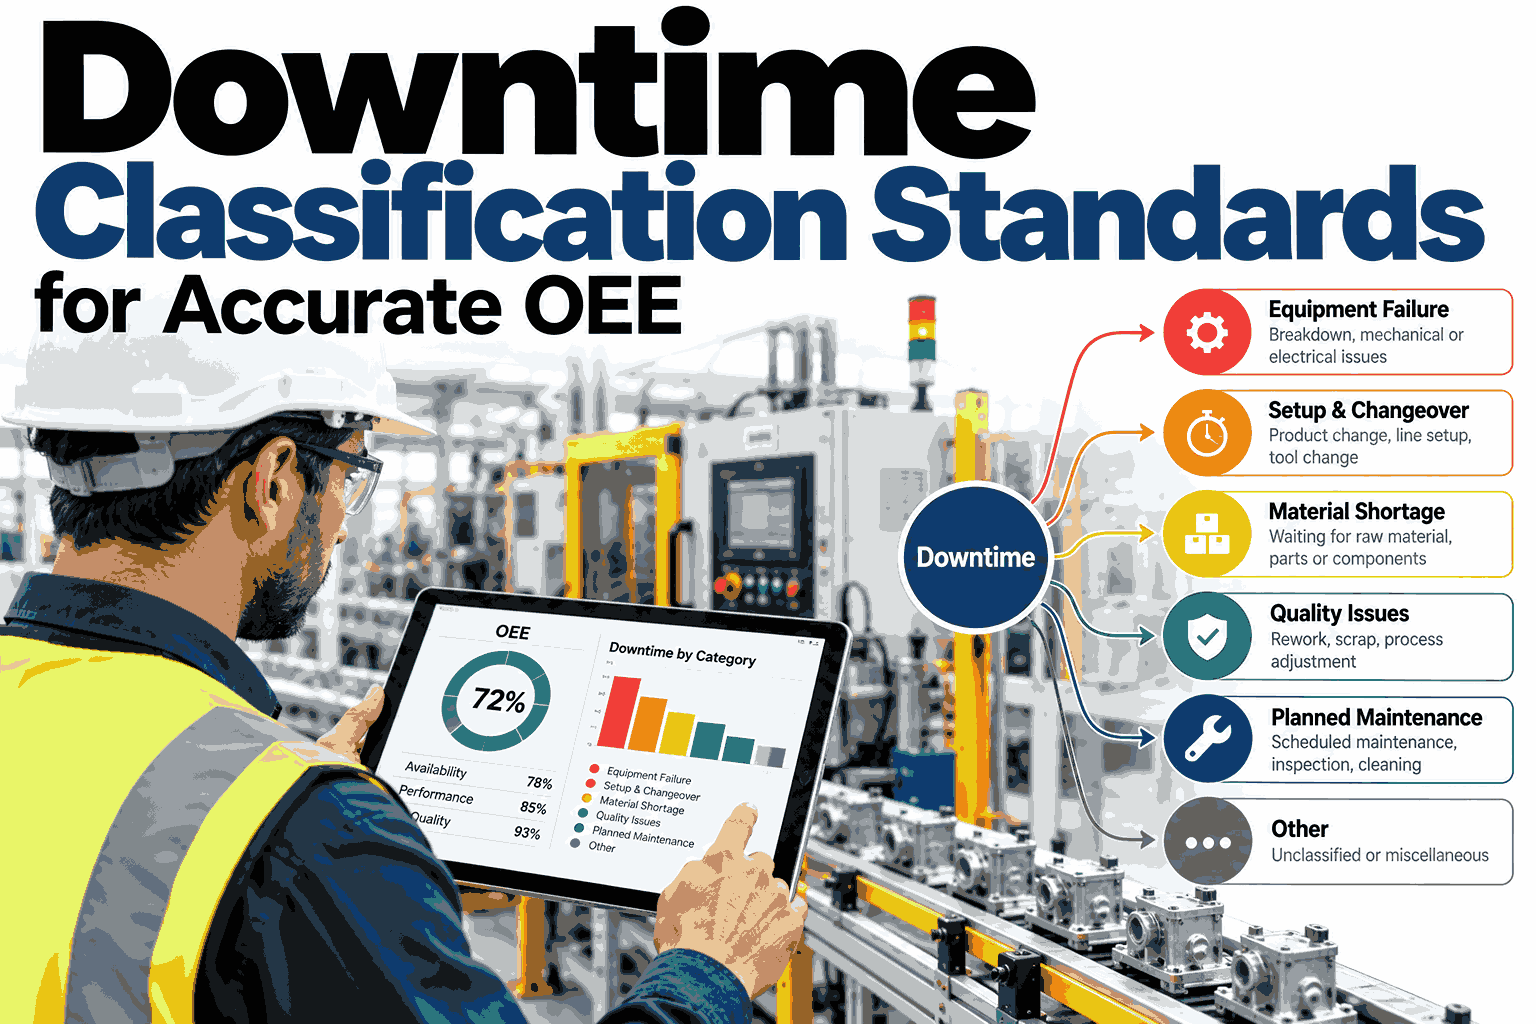
Downtime Classification Standards for Accurate OEE
A practical framework for standardizing reason codes so every stoppage rolls up into a number operations, engineering and finance can all trust.
Typical downtime split across the three loss categories, before any standardization work begins
Why Misclassified Downtime Breaks the OEE Formula
OEE multiplies availability, performance and quality into a single score. Each factor draws its inputs from logged downtime, so a classification error never stays contained in one place. It quietly shifts the whole result.
Inconsistent naming lets the same event get logged under different labels depending on who is on shift that day.
A catch-all "other" bucket absorbs every stoppage with an unclear cause until it becomes the largest code on the report.
With no duration standard, a two-minute hiccup and a twenty-minute breakdown can share the exact same reason code.
Standardization does not add more reporting work. It fixes the model underneath so every stoppage lands in one place, the same way, every single time.
The Three-Tier Loss Taxonomy
A workable hierarchy starts wide and narrows to specific causes, so every reason code rolls up cleanly into availability, performance or quality without overlap.
Each branch should also carry its own duration thresholds and a named owner, which the code library section below walks through in detail.
See Your Downtime Map in a Live Session
Book a 30-minute walkthrough and iFactory AI will show how your current reason codes map onto a clean three-tier taxonomy, using your own plant data.
Mapping the Six Big Losses to Reason Codes
The classic six big losses framework gives every reason code a home. Use the table below as a starting map, then narrow it to the causes that actually occur on your lines.
| Big Loss | OEE Factor Affected | Typical Reason Codes |
|---|---|---|
| Breakdown | Availability | Mechanical fault, electrical fault, sensor fault |
| Changeover / Setup | Availability | Product changeover, tooling change, material changeover |
| Minor Stops | Performance | Jam, blockage, misfeed |
| Reduced Speed | Performance | Under-rated run, operator-adjusted speed |
| Startup / Yield | Quality | Warm-up scrap, startup calibration |
| Defects / Rework | Quality | Out-of-spec output, rework loop |
Classification Mistakes That Quietly Inflate OEE
Most OEE numbers are not wrong because of bad math. They are wrong because of small, repeated classification habits that compound over months.
Letting operators type free-text reasons instead of choosing from a fixed, pre-approved code list.
Mixing scheduled maintenance time into unplanned downtime totals, which drags availability down for the wrong reason.
Never reviewing which codes actually get used, so stale or duplicate codes linger in the system for years.
Changing the code list without retraining every shift, so the same stoppage gets split across old and new names.
Building a Reason Code Library That Holds Up
A code library is never really finished. These four steps keep it accurate as lines, products and shifts change.
Map every candidate code to one of the three loss categories before a single name gets written down.
Decide the exact cutoff between a micro-stop and a logged stoppage, then apply it the same way on every line.
Walk every shift through the full code list, then review actual usage each month to catch overused catch-alls.
Connect PLC, sensor and vision triggers so a code gets assigned the moment a stoppage starts, not from memory at shift end.
Where iFactory AI Fits
iFactory AI turns the taxonomy above from a wall chart into something that runs automatically against live production data.
Auto-classification engine
Each stoppage signature is matched against the trained taxonomy, so the correct code is suggested before a supervisor even looks at the line.
Micro-stop threshold detection
Sub-threshold stops are flagged and grouped separately, so they never get folded silently into a single generic code.
Code audit dashboard
A running view shows which codes are overused, underused, or applied inconsistently across shifts and lines.
Real-time OEE recompute
Availability, performance and quality scores update the moment a code is applied, instead of waiting for an end-of-shift report.
iFactory AI arrives pre-configured on an NVIDIA server that ships racked and ready, with the classification engine pre-loaded. Scope covers cabling, network, ERP and MES integration, shift-level training and 24x7 remote monitoring.
Ship, network and connect existing downtime logging sources
Build the taxonomy, set thresholds and validate against history
Go live, train every shift and hand over the audit dashboard
Frequently Asked Questions
What does downtime classification actually mean for OEE?
It means every logged stoppage is assigned to a single, consistent reason code that maps cleanly to availability, performance or quality. Without that consistency, the same type of stop can be counted differently depending on who logs it, which makes trends across shifts and lines unreliable. You can see this mapping applied to your own downtime history in a short session.
What is the difference between big losses and detailed reason codes?
The six big losses are the high-level categories, such as breakdown or minor stops, while reason codes are the specific causes underneath each one, like a particular sensor fault or a jam at a feeder. Big losses are useful for trend reporting, while reason codes are what maintenance and engineering teams actually act on.
How many downtime categories should a plant actually have?
Most plants do better with fewer, well-defined codes than with hundreds of overlapping ones. A hierarchy that is two to three levels deep, with twenty to forty specific codes underneath, is usually enough to capture real causes without overwhelming operators during a shift. A live review of your current code list can show where it is too thin or too cluttered.
How do we stop operators from overusing the "other" code?
Usually by shortening the active list to codes that genuinely occur on that line, then auditing "other" usage monthly to see which real causes are hiding inside it. Once a pattern shows up often enough, it earns its own code and the catch-all bucket shrinks on its own over time.
Can classification be automated instead of relying on manual logging?
Yes, and it removes most of the inconsistency that manual logging introduces. PLC signals, sensor data and vision triggers can assign a code automatically the moment a stoppage begins, leaving operators to confirm or refine it rather than recall it from memory at the end of a shift. Ask support about connecting your existing PLC and sensor data to get started.
Turn Downtime Logs Into a Number You Can Trust
iFactory AI standardizes your reason codes, automates classification and recomputes OEE in real time. Book a walkthrough to see it running on your own plant data.