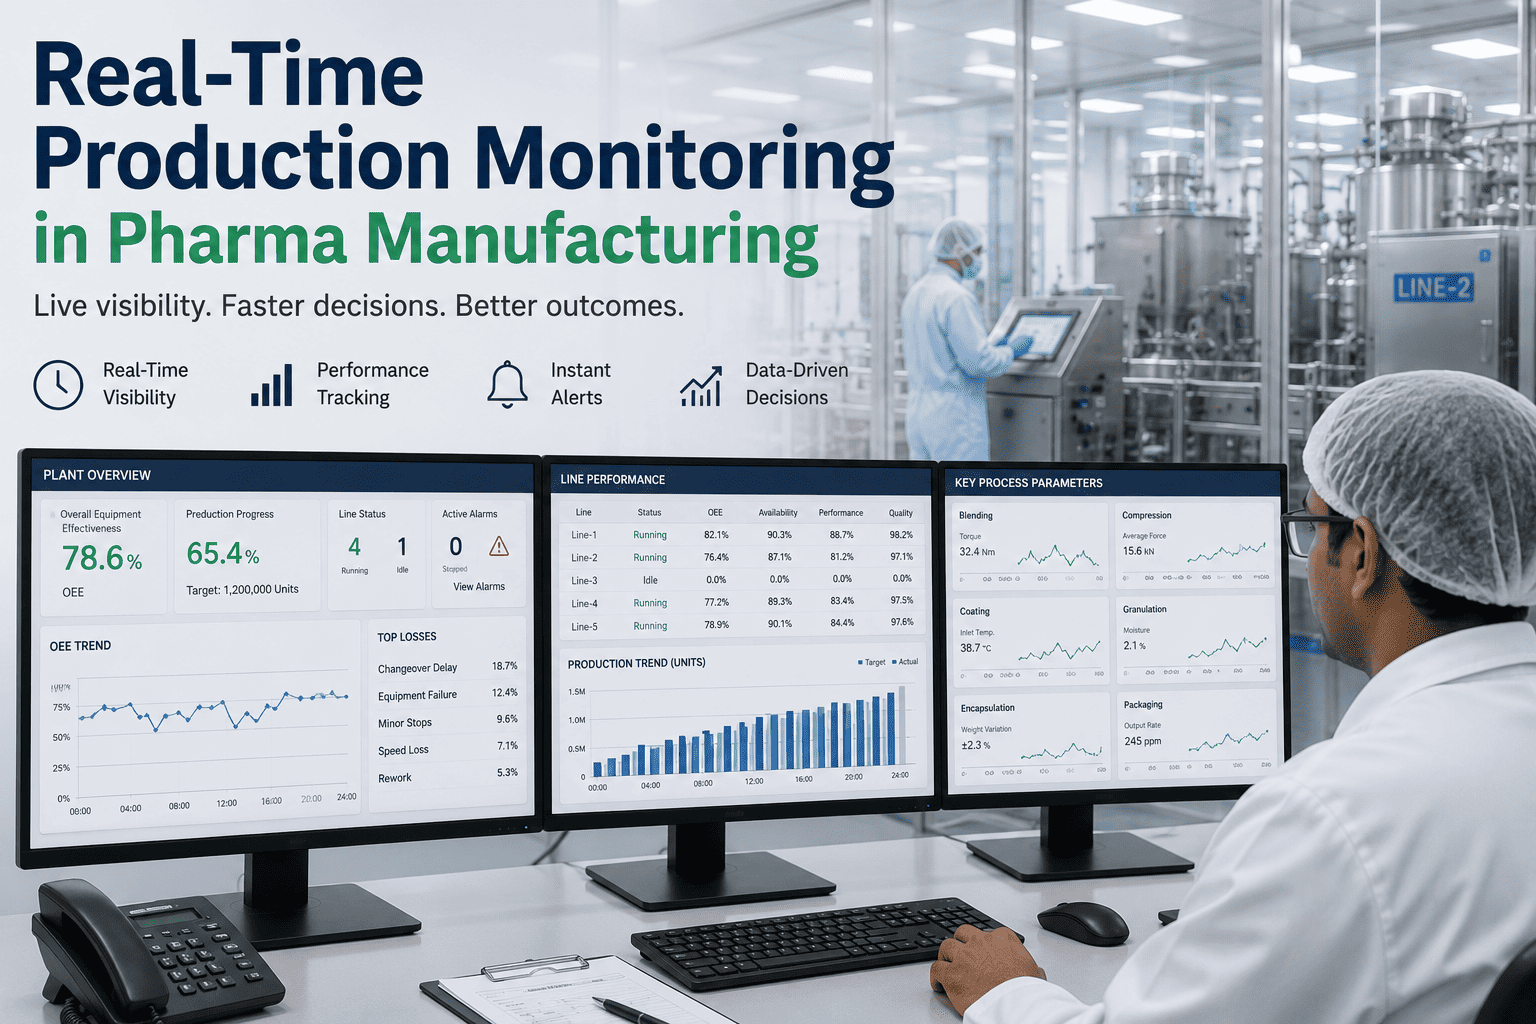
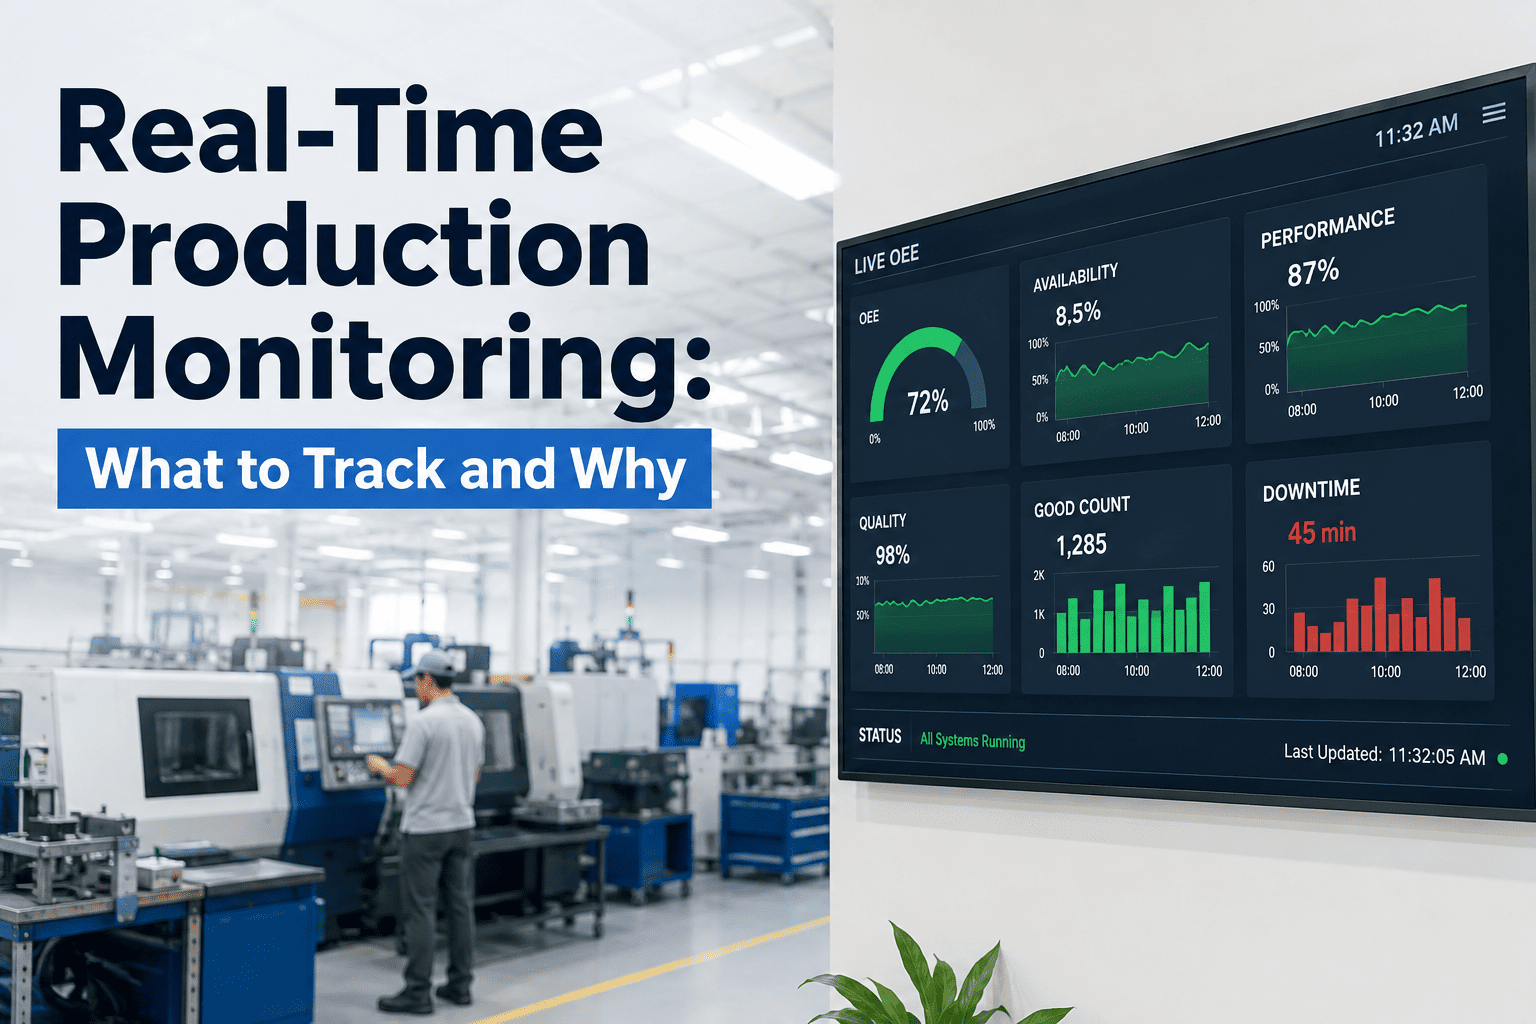
Ask three different plants how they calculate OEE and there is a real chance you get three different formulas, three different definitions of what counts as a stop, and three sets of numbers that cannot be compared against each other even though everyone is using the same three letters. ISO 22400 exists precisely to end that ambiguity, defining a standardized set of manufacturing KPIs with precise formulas so that a number calculated on one line means the same thing as the same number calculated on another line, another shift, or another plant entirely. iFactory implements the ISO 22400 KPI framework directly against live PLC and vision signals from the factory floor, so availability, performance, quality, and OEE are calculated the same way every time, automatically, without a spreadsheet reconciliation step at the end of every shift. For a manufacturing analytics program to actually drive comparable improvement across lines and plants, the underlying KPI math has to be standardized first, and iFactory support can walk a team through exactly how each KPI is calculated for their specific lines.
ISO 22400 Standardized KPIs · Manufacturing Analytics
Stop Reconciling Three Different OEE Formulas Across Three Different Lines — Standardize on ISO 22400
iFactory calculates ISO 22400 manufacturing KPIs directly from live PLC and vision signals, giving every line, shift, and plant a number that means exactly the same thing, calculated exactly the same way.
Standard KPI Categories
The ISO 22400 KPI Families iFactory Calculates Automatically
ISO 22400 organizes manufacturing KPIs into defined categories rather than a single blended metric, which is what makes cross-line and cross-plant comparison possible in the first place. Each category has a precise formula tied to a specific data source on the factory floor.
Effectiveness KPIs
OEE and its three components — availability, performance, and quality — calculated per the standard's exact definitions rather than a plant-specific variant.
Time-Based KPIs
Planned busy time, actual production time, and setup time tracked against the standard's precise time-state definitions.
Quality-Related KPIs
First pass yield, scrap ratio, and rework ratio calculated consistently across every line producing comparable output.
Inventory and Cost KPIs
Work-in-process and cost-related indicators tied back to the same standardized time and quality definitions.
From Signal to Standardized KPI
How Raw Floor Data Becomes an ISO 22400 Compliant Number
1
Capture Raw Signals
PLC tags, vision counts, and stop/start events are captured continuously from each line without manual shift-end entry.
2
Classify Time States
Every minute of line time is classified into the standard's defined states, such as planned production time or unplanned downtime.
3
Apply Standard Formulas
Availability, performance, and quality are calculated using the exact ISO 22400 formulas, not a locally modified version.
4
Publish Comparable KPIs
Resulting KPIs are directly comparable across lines, shifts, and plants because every one was calculated the same standardized way.
You Can't Improve What You Can't Compare, and You Can't Compare Numbers Calculated Three Different Ways.
iFactory standardizes every KPI on the ISO 22400 formula set, so a comparison between two lines is finally a fair one.
Spreadsheet KPIs vs. Standardized Live KPIs
Manual Spreadsheet Calculation vs. iFactory ISO 22400 Automation
Function
Manual Spreadsheet Calculation
iFactory ISO 22400 Automation
Formula Consistency
Each plant or line may define stops and losses slightly differently
Every KPI calculated using the exact ISO 22400 formula definitions
Data Freshness
Compiled at shift end or later from manual logs and machine printouts
Calculated continuously from live PLC and vision signals
Cross-Line Comparison
Difficult to compare fairly when underlying formulas differ line to line
Directly comparable since every line uses the identical standard
Audit Readiness
Formula logic often undocumented or known only to one analyst
Calculation logic tied to a published international standard
Time to Report
Hours spent reconciling spreadsheets before a KPI report is ready
KPI dashboard available continuously with no manual reconciliation
Measured Outcomes
What Manufacturing Analytics Teams Report After Standardizing on ISO 22400
100%
Formula Consistency Across Lines
Every line calculates KPIs using the same ISO 22400 definitions, removing formula disputes entirely.
50-70%
Less Time Spent Reconciling Reports
Analysts report significant time savings once KPIs calculate automatically instead of through manual spreadsheet work.
Live
Continuous KPI Availability
Dashboards update through the shift instead of only being finalized after it ends.
4
Standardized KPI Categories
Effectiveness, time-based, quality-related, and inventory and cost KPIs all calculated per the standard.
10-14 Days
Typical Deployment Timeline
Time to go live with standardized KPI dashboards for a line with existing PLC data access.
1
Common Standard Across Plants
Multi-plant organizations get one shared KPI language instead of plant-specific variants.
Field Case
Resolving a Cross-Plant OEE Dispute That Had Gone Unsettled for Two Years
A multi-plant steel producer had two facilities reporting noticeably different OEE figures for what corporate leadership believed were comparably equipped rolling lines, with each plant's team convinced the other was calculating the number incorrectly. Neither side could definitively prove their formula was right because the underlying stop and loss definitions had diverged gradually over several years of independent spreadsheet maintenance at each site. After both plants moved to iFactory's ISO 22400 implementation, the standardized calculation revealed that one plant had been excluding a category of minor stoppages that the standard requires counting, while the other had been over-counting planned maintenance as unplanned downtime. Once both plants ran the same standardized formula, the true performance gap between them turned out to be roughly half of what either side had originally believed.
2 YearsDispute unresolved before standardization
2Formula discrepancies identified
~50%Reduction in apparent performance gap
Frequently Asked Questions
Manufacturing Analytics Leaders Ask These Questions First
What exactly does ISO 22400 standardize, and why does it matter?
ISO 22400 defines precise formulas and time-state classifications for manufacturing KPIs like OEE, availability, performance, and quality, so that a number calculated in one plant means exactly the same thing as the same number calculated in another. Without this standard, plants commonly develop their own local variations over time, which makes cross-line or cross-plant comparison unreliable even when everyone believes they are measuring the same thing.
Book a Demo to see how your current KPI definitions compare to the standard.
Will our historical KPI numbers change once we switch to ISO 22400 calculations?
In most cases, yes, historical figures recalculated under the standard will differ somewhat from previously reported numbers, since the standard's precise definitions of downtime, planned time, and quality losses rarely match a plant's existing informal conventions exactly. This is generally treated as a one-time reset rather than an ongoing issue, and going forward every number is calculated consistently under the same standard.
Do we need to change our PLC programming or line hardware to implement this?
No, ISO 22400 implementation happens at the analytics layer, interpreting existing PLC tags, stop and start events, and production counts according to the standard's definitions rather than requiring changes to line hardware or control logic. The classification and calculation work happens in iFactory after data is captured from equipment that is already in place.
Can we still see our old, plant-specific KPI variants alongside the standardized ones?
Yes, many plants run both views during a transition period, keeping their legacy KPI definitions visible for continuity while the standardized ISO 22400 numbers become the primary reference for cross-line and cross-plant comparison. This side-by-side period helps teams understand exactly where and why the two calculations diverge.
Contact support to plan a transition approach for your organization.
How long does it take to get standardized KPI dashboards live across multiple lines?
For lines with existing PLC data access, standardized ISO 22400 dashboards typically go live within 10 to 14 days per line, with additional lines added incrementally after the first is validated. Multi-plant rollouts generally follow a phased schedule, starting with one facility before extending the same standard to others.
Book a Demo to get a rollout timeline for your plant network.
Give Every Line and Plant a KPI Number That Actually Means the Same Thing.
ISO 22400 standardized manufacturing KPIs, calculated live from your existing floor data, in as little as 10 days.