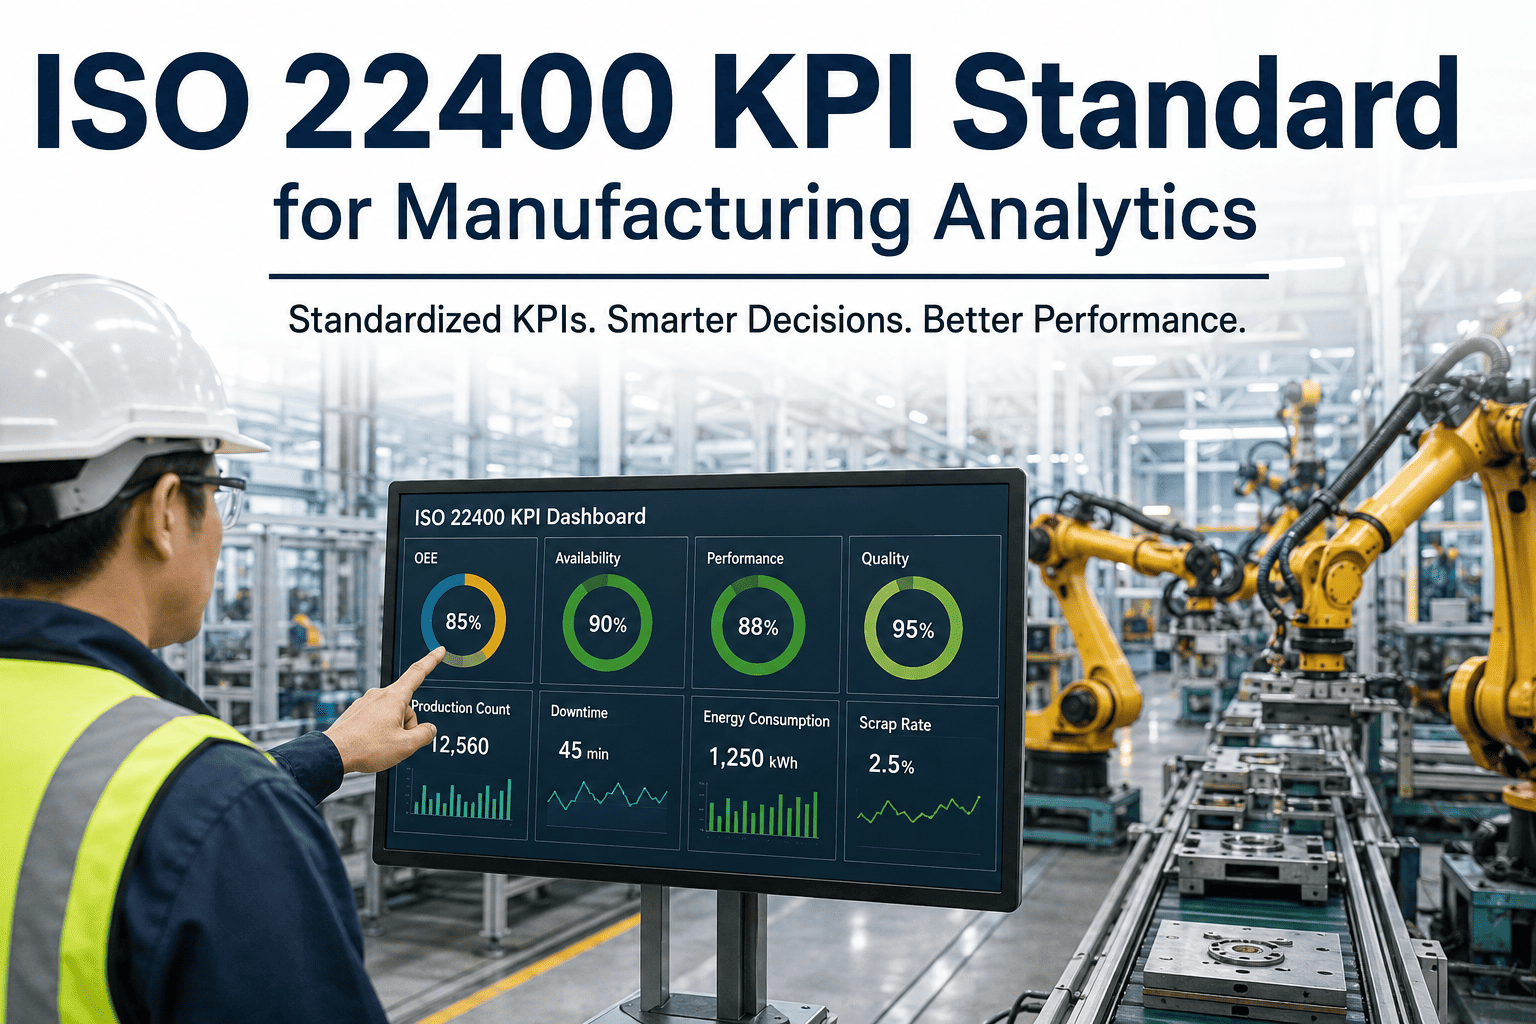
Two plants can both report 80 percent OEE and mean completely different things. One counts planned breaks as lost time, the other does not. One measures speed against nameplate, the other against a tuned target. ISO 22400 exists to end that confusion by giving manufacturing KPIs a shared definition, formula and time model. Adopting it is less about a certificate and more about making numbers comparable from line to line and site to site. Teams planning a rollout can watch iFactory AI apply standard KPI definitions to live line data before writing their own specification.
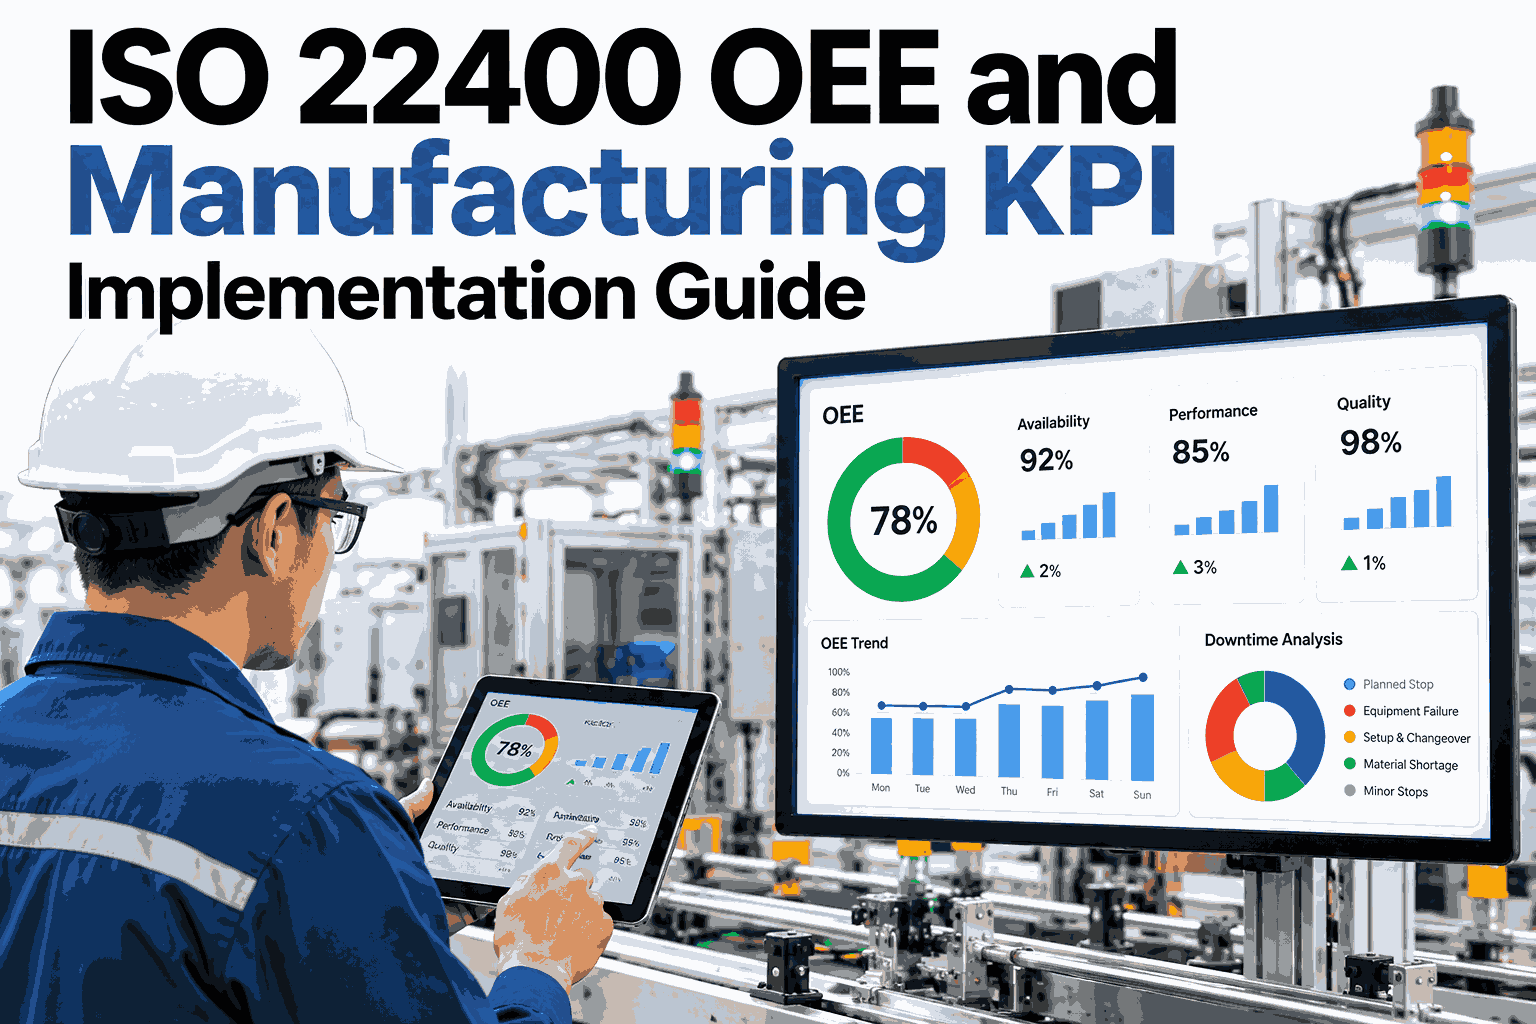
ISO 22400 OEE and Manufacturing KPI Implementation Guide
How to turn a KPI standard into one consistent set of numbers across every line.
Why a Shared KPI Standard Matters
Without common definitions, every comparison starts with an argument about the number instead of the problem.
Two sites call a metric OEE but include different stops in the calculation.
Planned maintenance counts as loss in one report and is excluded in another.
Targets are set without agreeing what the baseline actually measures.
A standard does not make a plant better by itself. It makes improvement measurable and honest.
The Standard at a Glance
ISO 22400 is a series for manufacturing operations management. Two parts matter most for KPI work.
Overview and concepts
Sets the framework, terms and the way KPIs are described and used.
Definitions and descriptions
Defines a catalogue of 34 KPIs with formulas, units and scope.
The Time Model Behind OEE
Everything starts with planned busy time. The ribbon below shows one illustrative 480-minute shift.
Put One Time Model Under Every Line
Book a 30-minute session and iFactory AI will show how planned time, delays and output are calculated the same way on each line.
OEE as Three Ratios
Following the standard, OEE is availability times effectiveness times quality ratio. The columns use the same example shift.
Three respectable ratios still multiply to 59 percent. That is why improvement work starts with the lowest factor.
Anatomy of a Well-Defined KPI
The standard describes each KPI with the same set of elements. Copy this card as your internal template.
Six Steps to Implement
Work down the path in order. Skipping the definitions step is the most common reason rollouts stall.
Pick the KPIs
Choose a short list tied to real decisions, not the full catalogue.
Write the definitions
Fill one definition card per KPI and get engineering and finance to sign off.
Map the data sources
List which machine, MES or ERP field feeds each term in the formula.
Set the time model
Agree what counts as planned busy time and which stops are delays.
Pilot on one line
Run the numbers for four weeks and test them against floor reality.
Roll out and review
Copy to other lines and review definitions each quarter.
Core KPIs to Start With
Most plants begin with a small family of related KPIs and grow from there.
| KPI | Question It Answers | Typical Owner |
|---|---|---|
| Availability | How much planned time did we actually run? | Maintenance and production |
| Effectiveness | How fast did we run compared with plan? | Production engineering |
| Quality ratio | How much of the output was good? | Quality |
| OEE | How well did we use the planned time overall? | Plant manager |
| Utilization efficiency | How well was the equipment used against its available time? | Operations |
| Worker efficiency | How did labor time compare with plan? | Production supervisor |
Pitfalls That Break Comparability
Check this list before publishing the first dashboard.
Moving targets
Changing the ideal cycle time without recording the date makes trends meaningless.
Hidden exclusions
Dropping short stops or trials from the data lifts OEE without any real gain.
Manual re-keying
Typed stop reasons differ by shift, so automatic capture should be the default.
One number for all lines
A batch line and a continuous line need the same definitions but different targets.
Where iFactory AI Fits
iFactory AI holds the KPI definitions once and applies them to every line, so reports always match.
One definition library
Formulas, units and time rules are stored centrally and applied the same way everywhere.
Automatic data capture
Run state, counts and rejects flow from machines, not from end-of-shift notes.
Line and site comparison
Compare units on the same basis, then drill from site to line to shift.
Ask in plain language
Managers can ask why availability fell on Line 4 and see the ranked causes.
Frequently Asked Questions
Do we need certification to use ISO 22400 KPIs?
No. The standard is a reference for defining and describing KPIs, not a certification scheme. Most plants use it to align formulas and terms across sites. Check the published text for exact wording. You can see how standard-style definitions are set up in a live session.
How is ISO-style OEE different from the usual formula?
The structure is familiar, but the standard is precise about the time model, what counts as planned time and how effectiveness is measured. That precision is what makes results comparable. To compare the two on your data, request an OEE definition walkthrough with the iFactory AI team, or ask support about KPI setup.
How many KPIs should we implement first?
Start with five to eight that connect to real decisions, such as availability, effectiveness, quality ratio and OEE. Adding too many early dilutes attention and slows data checks. Grow the list once the first set is trusted. A short product tour of a starter KPI set shows a practical scope.
Can we apply it to both batch and continuous lines?
Yes. The definitions apply to both, though the data sources and targets differ. Batch lines lean on changeover and cycle data, while continuous lines focus on throughput and stability. See how one KPI model covers mixed line types in a guided session.
Where does the data come from?
Mostly from machine signals, MES records and quality systems, with ERP supplying plans and standards. Mapping each formula term to a source is the key step before any dashboard. Schedule a walkthrough of data source mapping to see a typical layout.
One Set of KPI Definitions, Every Line
iFactory AI applies consistent KPI definitions to live plant data so every number can be trusted and compared. Book a walkthrough to see it on your lines.