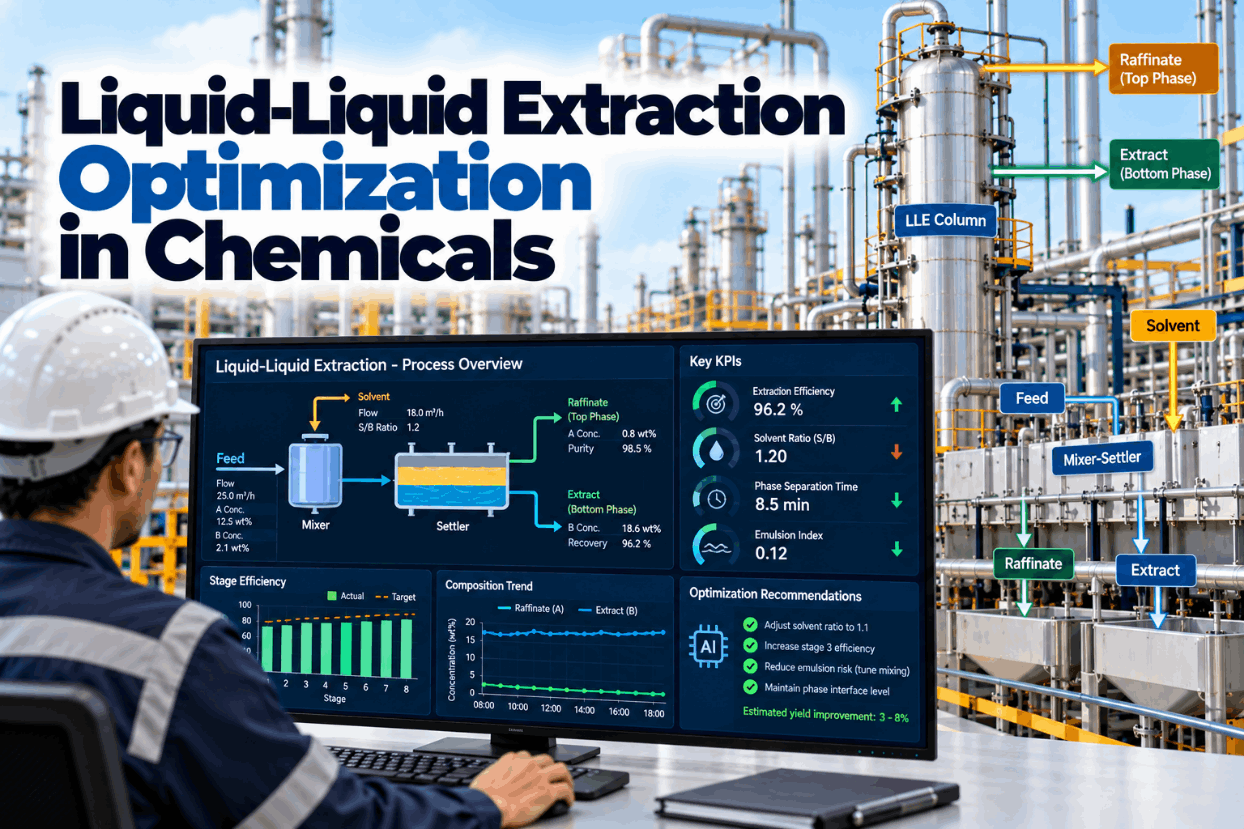
Liquid-liquid extraction separates components that distillation handles badly: heat-sensitive products, close-boiling mixtures, azeotropes and dilute solutes in water. A solvent picks up the target component from the feed, and the two liquid phases are separated again. Getting it right means balancing solvent-to-feed ratio, agitation and throughput so that every stage does real work without flooding the column or forming an emulsion that will not settle. Most extraction units run with fixed settings chosen at commissioning, while feed composition, temperature and interfacial behavior keep changing. This guide covers the key variables, column and mixer-settler types, flooding and emulsion problems, stage efficiency and how continuous optimization keeps recovery high and solvent use low. To see your extraction unit modeled from plant data, book a short walkthrough.
Liquid-Liquid Extraction Optimization in Chemicals: Higher Recovery, Less Solvent, No Flooding
Solvent ratio, agitation and throughput tuned to today’s feed, with flooding, emulsion and crud risks watched continuously in columns and mixer-settlers.
Why Extraction Units Drift From Their Best Operating Point
Extraction is chosen when distillation is unsuitable: when products are heat-sensitive or non-volatile, when components boil close together, when they form azeotropes or when the solute is dilute in water. Thermopedia’s summary of the method lists exactly these cases. The result is that extraction units often handle difficult, variable streams.
Most units are set up at commissioning with a solvent-to-feed ratio, an agitation or pulse setting and a throughput, and then left there. When feed composition changes, the fixed ratio is either too low, cutting recovery, or too high, wasting solvent and the energy needed to recover it. When throughput rises, the column moves toward flooding. When interfacial tension falls because of a new impurity, the phases settle more slowly and an emulsion band grows.
These changes are gradual and interact with each other. An operator sees raffinate concentration rising and adds solvent. The extra solvent flow pushes the column closer to flooding, and efficiency falls further. Without a model of the unit, it is hard to know which lever to pull.
Continuous optimization gives operators that model. We can review your extraction unit on a call.
The Variables That Decide Extraction Performance
A handful of variables explain most of what happens in an extraction unit.
Temperature affects several of these at once. It changes the distribution coefficient, the mutual solubility of the phases and viscosity, which in turn changes settling. A unit that runs well in winter may behave differently in summer for this reason alone.
A calibrated model links these variables to recovery and solvent use in real time. See it in a demo.
Columns and Mixer-Settlers Compared
Each type of contactor has strengths and limits. Capacity figures below are typical values published by Koch Modular for combined phase throughput.
| Contactor | Typical capacity, m³/m²·h | Strengths | Watch for |
|---|---|---|---|
| Reciprocating plate (Karr) | 30–60 | Handles emulsifying systems, wide turndown | Flooding at high stroke speed |
| Rotating disc contactor | 20–30 | Simple, used in large refinery and chemical services | Axial back-mixing limits efficiency |
| Agitated column (Scheibel type) | 15–25 | High efficiency per height | Emulsions with low interfacial tension |
| Sieve tray column | 20–30 | No moving parts | Limited turndown |
| Mixer-settlers | Stage-wise | Practically no inter-stage back-mixing, high stage efficiency | Large inventory and footprint |
| Centrifugal contactors | Compact | Short residence time, fast settling | Higher equipment cost |
Mixer-settlers are widely used where stage efficiency matters and space is available. Industry descriptions note that settlers can take up at least three quarters of the total volume, which means large solvent inventories. Rotating disc contactors are used in services such as propane deasphalting, aromatics extraction with sulfolane and caprolactam purification.
The contactor type shapes what optimization can do. In agitated and pulsed columns, agitation speed or pulse frequency is a strong lever. In mixer-settlers, mixing intensity and settler residence time matter most.
Our engineers can assess whether your contactor is limiting recovery or capacity.
Flooding and How to See It Coming
Flooding is the point where the dispersed phase can no longer move through the column against the continuous phase. Separation collapses and phases leave through the wrong outlets.
More throughput raises the counter-flow that the dispersed phase must overcome.
Finer dispersion moves more slowly and accumulates, raising holdup.
Impurities or temperature changes give finer dispersion and slower coalescence.
Dispersed-phase holdup climbs before flooding, visible in density or differential pressure across sections.
The main interface shifts or an emulsion band grows at one end of the column.
Koch Modular’s guidance is to cut capacity or agitation when an emulsion band forms at the interface.
Running close to flooding is economically attractive because capacity and efficiency are often highest there, but the margin is narrow. An AIChE troubleshooting paper describes a case where a 50% capacity increase cost 25% of efficiency, and notes that a Karr column held peak efficiency over a broader capacity range than a rotating disc contactor.
A model that estimates approach to flooding from holdup, flows and agitation lets operators run closer to the limit safely, with an early warning when the margin shrinks.
Early warning of flooding is often the first benefit plants notice. We set it up during every rollout.
Emulsions, Crud and Third Phase
Problems at the interface are among the hardest to manage in extraction.
Fine dispersion that settles slowly, growing a band at the interface and carrying one phase into the other.
Defined in solvent extraction literature as a stable mixture formed by agitating organic and aqueous phases with fine solids.
A separate liquid phase that forms when solvated species exceed their solubility in the diluent.
Solvent leaving with raffinate or aqueous with extract, raising losses and downstream load.
Trace compounds that lower interfacial tension and stabilize emulsions.
Colder phases settle more slowly; warmer ones change mutual solubility.
Many interface problems start upstream. Fine solids from a filter failure, a new impurity in feed or a change in pH can all stabilize emulsions. Linking interface behavior to upstream data helps operators find the cause instead of reducing throughput every time.
Solvent losses through entrainment are also a cost and an environmental issue. Tracking solvent makeup against throughput and interface behavior shows when losses rise and why.
Interface problems become easier to manage when causes are visible. Discuss your system with our specialists.
Optimizing Solvent-to-Feed Ratio
Solvent-to-feed ratio is the lever with the largest effect on cost, because every unit of solvent must be recovered, usually by distillation or stripping.
Illustrative. The right ratio depends on equilibrium data, stage efficiency and feed concentration on the day.
Published examples show how ratio and recovery interact. A Koch Modular design presentation for AIChE gives acetic acid recovery of 98% at a solvent-to-feed ratio of 1.0 by mass, and carboxylic acid recovery from fermentation broth of 98.7% at a ratio of 1.5.
Sources do not give a single figure for extraction energy against distillation, because it depends on solvent recovery. The saving from lower solvent flow, however, shows directly in the solvent recovery column’s reboiler duty.
Most units have some room on solvent ratio once feed is measured continuously. Ask our team to estimate yours.
Fixed Settings Versus Adaptive Operation
The difference between commissioning settings and adaptive operation shows in recovery, solvent use and upsets.
- Solvent ratio set for worst-case feed
- Agitation unchanged with throughput
- Flooding found when it happens
- Emulsions treated by cutting rate
- Solvent losses noticed monthly
- Recovery varies with feed
- Solvent ratio matched to current feed
- Agitation tuned to throughput and properties
- Approach to flooding estimated continuously
- Interface problems linked to causes
- Solvent makeup tracked daily
- Recovery held at target
Adaptive operation keeps engineers in control. Recommendations run in advisory mode first, with operators applying them and seeing the effect, before any closed-loop step is considered under management of change.
See how recommendations are presented to operators in a session.
Extraction Unit Checklist
Use this checklist to prepare an extraction unit for continuous optimization.
Many plants already have most of the data. Assembling it is the first step of an extraction review.
What Extraction Optimization Is Worth
Value comes from recovery, solvent and stability.
Because solvent recovery is usually energy-intensive, solvent ratio is where the largest operating savings sit. Recovery gains matter most where the product is valuable, such as specialty chemicals, pharmaceutical intermediates and metals.
A review of a month of unit data shows where your extraction unit sits. Book one with our advisors.
How iFactory Delivers Extraction Optimization
Equilibrium and efficiency calibrated on your data.
Solvent-to-feed ratio for current feed.
Speed or pulse frequency for throughput and properties.
Approach to flooding estimated continuously.
Emulsion and crud signals linked to causes.
Makeup and recovery duty reported daily.
It runs on premises beside your DCS and historian. Share a month of unit data and we will show your solvent ratio window in a working session.
See How Much Solvent Your Unit Really Needs
Share flows, compositions and agitation data for your extraction unit. We calibrate a model, estimate approach to flooding and show the solvent ratio that holds recovery at today’s feed.
Dispersed-phase holdup is rising at the current pulse frequency and throughput. The model puts the column at 88% of flooding, up from 80% yesterday.
A Flooding Warning During a Rate Increase
This exchange shows how a process engineer might use iFactory.
iFactory ships as a pre-configured NVIDIA AI server, racked and ready with the liquid-liquid extraction optimization models loaded. Rack it, plug in power and Ethernet, and the AI is live on your network. Our scope covers data connections across process units, utilities and the control room, DCS, PLC/SCADA, historian, LIMS and CMMS integration, cabling and network setup, operator and engineer training, and 24×7 remote monitoring. Recommendations run in advisory mode first, and nothing writes to your control system without your management of change approval.
Server installed, DCS and historian links live, historical process, lab and maintenance data loaded.
Models calibrated on your own unit data, then run in advisory mode on one unit with your process engineers reviewing every recommendation.
Rollout to the agreed units under your management of change, operator and engineer training, and 24×7 remote monitoring in place.
Software, server and integration come as one package. For pricing on your site, contact our sales team.
Frequently Asked Questions
When products are heat-sensitive or non-volatile, when components boil close together or form azeotropes, or when the solute is dilute in water, making distillation costly or impossible.
The ratio of solute concentration in the extract phase to that in the raffinate phase at equilibrium. Higher values mean less solvent is needed for the same recovery.
Higher continuous-phase flow, higher agitation or pulse intensity and lower interfacial tension, all of which raise dispersed-phase holdup until flow through the column stops.
A stable mixture of organic phase, aqueous phase and fine solids that forms at the interface, disrupting phase separation and interface control.
Mixer-settlers have practically no inter-stage back-mixing and high stage efficiency, but need large volume and solvent inventory. Columns are compact but more sensitive to flooding and back-mixing.
A first extraction unit can typically be optimized within a 6–12 week rollout, starting in advisory mode. Plan it with our engineers.
Recover More With Less Solvent, Without Flooding
iFactory matches solvent ratio and agitation to today’s feed, estimates flooding margin continuously and traces interface problems to their cause.
Illustrative. Recovery rose while solvent per tonne of feed fell, lowering solvent recovery energy.