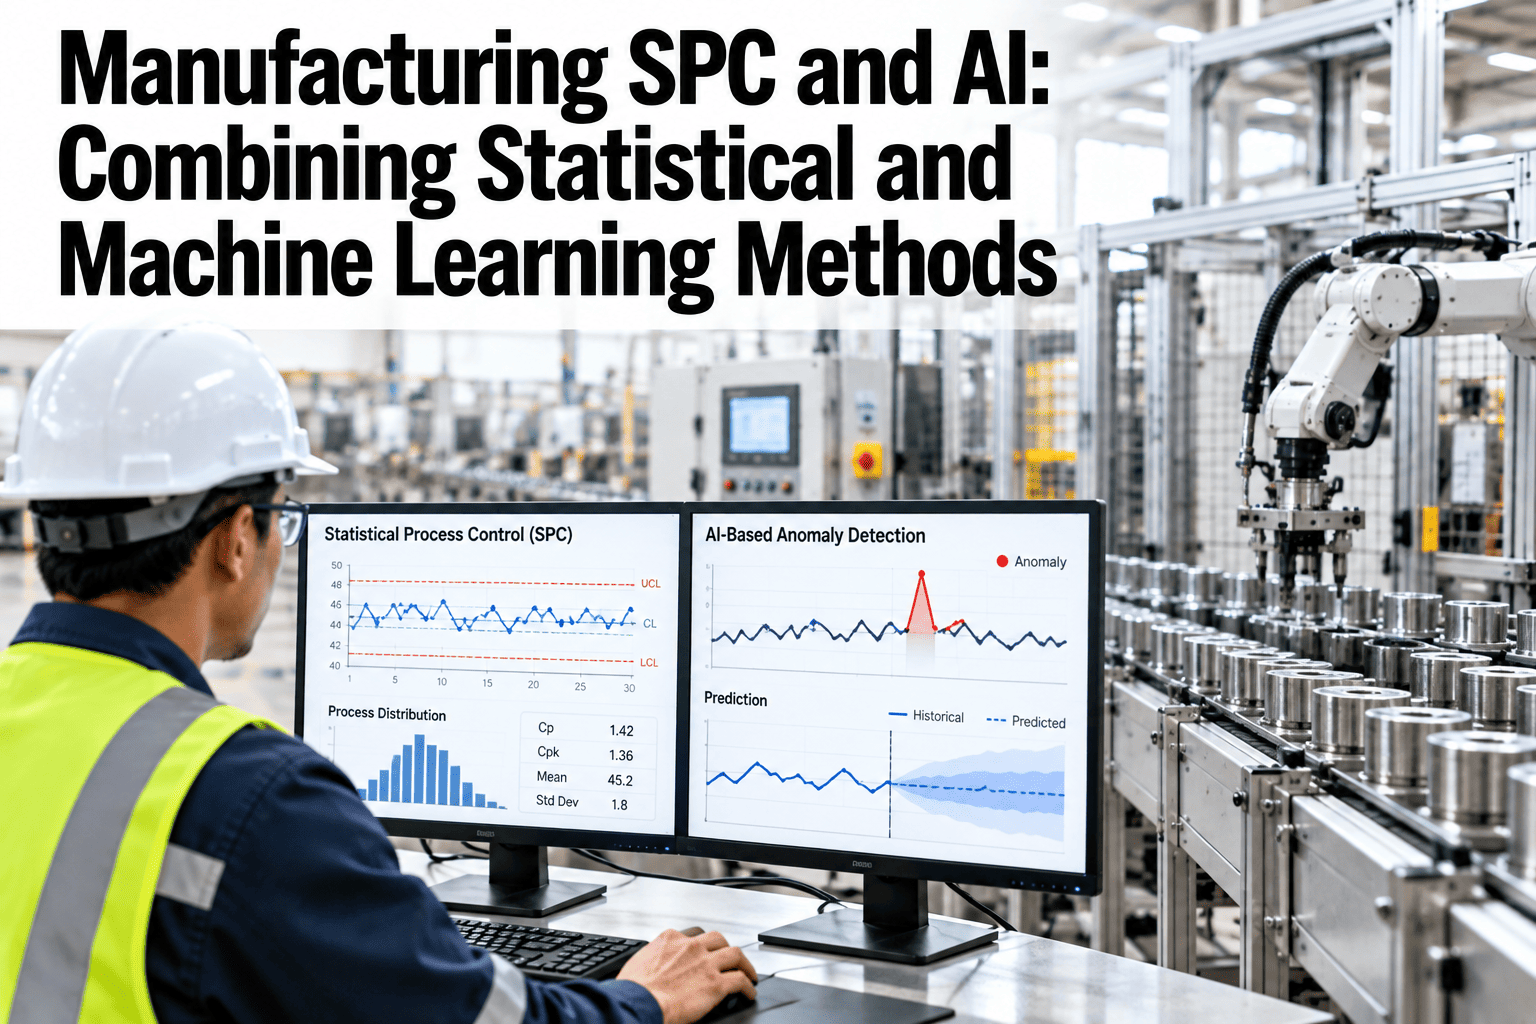
Traditional SPC and machine learning are often framed as competing approaches to process control, but in practice they answer different questions and work better combined than either does alone. Control charts excel at detecting a known pattern against a defined limit, consistently and explainably, which is exactly what an auditor or a regulator wants to see. Machine learning excels at catching the multivariate pattern that no single control chart would flag, the subtle combination of three or four parameters drifting together in a way a fixed rule never anticipated. A quality system that runs both together, rather than replacing one with the other, catches more real problems while keeping the explainability a defensible quality record requires. Quality engineers evaluating this combination can see SPC and machine learning running together on live process data before the next quality system review.
Manufacturing SPC and AI: Combining Statistical and Machine Learning Methods
Control charts for explainable limits, machine learning for the multivariate pattern no single chart would catch.
Why Neither Method Alone Is Enough
Treating SPC and machine learning as competing choices leaves a real gap on either side.
A combination of small, individually in-control parameters can still signal a real process problem.
A model flagging an anomaly without a clear reason is hard to defend in an audit.
Running SPC and ML in separate systems means neither informs the other.
Running both together, on the same data, closes the gap each method leaves on its own.
Where Each Method Fits
Matching the method to the question it answers best avoids forcing one tool to do a job it was not built for.
| Question | Best-Fit Method | Why |
|---|---|---|
| Is this single parameter in control? | SPC control chart | Clear limits, explainable, audit-ready |
| Are several parameters drifting together? | Machine learning | Catches a pattern no single chart would flag |
| Is this defect borderline or clear-cut? | Machine learning with confidence scoring | Routes uncertain cases for review instead of a binary call |
| Can we explain this result to an auditor? | SPC, or ML with documented reasoning | Explainability is required for defensible quality records |
Check Your Own Process for a Multivariate Pattern SPC Missed
Book a 30-minute session and bring your process data. iFactory AI will check for drift patterns a single control chart would not catch.
What iFactory AI Supports
SPC and machine learning run on the same data, feeding one quality view rather than two disconnected tools.
Live Control Charts
Standard SPC charts run continuously, with automatic Cpk and Ppk calculation.
Multivariate Pattern Detection
Machine learning flags combinations of parameters drifting together.
Explainable Alerts
Every ML-flagged event comes with the specific parameters and pattern behind the call.
One Combined Dashboard
SPC and ML results appear together, so quality teams never switch systems.
iFactory AI connects to existing process and quality data. Scope covers SPC setup, ML model training, team training and ongoing support.
Expert Review
The quality teams that get the most value from this combination are not trying to replace SPC with machine learning. They keep SPC for the explainable, audit-facing limits and add machine learning specifically for the multivariate patterns SPC was never designed to catch.
Explainability is not optional for the machine learning side either. A model that flags an anomaly without showing which parameters drove the call gets ignored by quality engineers within a few weeks, regardless of how accurate it actually is.
Frequently Asked Questions
Does adding machine learning replace our existing SPC charts?
No, existing SPC charts continue running unchanged for the single-variable, audit-facing control they already provide well. Machine learning is added alongside to catch the multivariate patterns SPC was never designed to detect. See both running side by side in a live session.
How does the system avoid flooding quality engineers with ML alerts?
Alerts are scored by confidence, with low-confidence or borderline cases routed for review rather than treated as a confirmed finding, which keeps the alert volume focused on patterns worth investigating. Ask support about alert tuning for your process.
Can the multivariate model be explained to an auditor?
Yes, every flagged event includes the specific parameters and the pattern that triggered it, giving quality engineers something concrete to show rather than just a black-box score. Request a sample explainability report.
How much historical data is needed to train the pattern detection model?
This varies by process complexity, but most processes need several months of historical data covering normal operation and known past events to establish a reliable multivariate baseline. Contact support to assess your available historical data.
How long before the combined system is validated for production use?
Most quality teams run a calibration period comparing ML-flagged patterns against known quality events before relying on the system unsupervised, typically within six to nine weeks. Book a session to estimate your own timeline.
Catch What SPC Alone Would Miss, Without Losing Explainability
iFactory AI runs SPC and machine learning together on the same process data. Book a walkthrough on your own numbers.