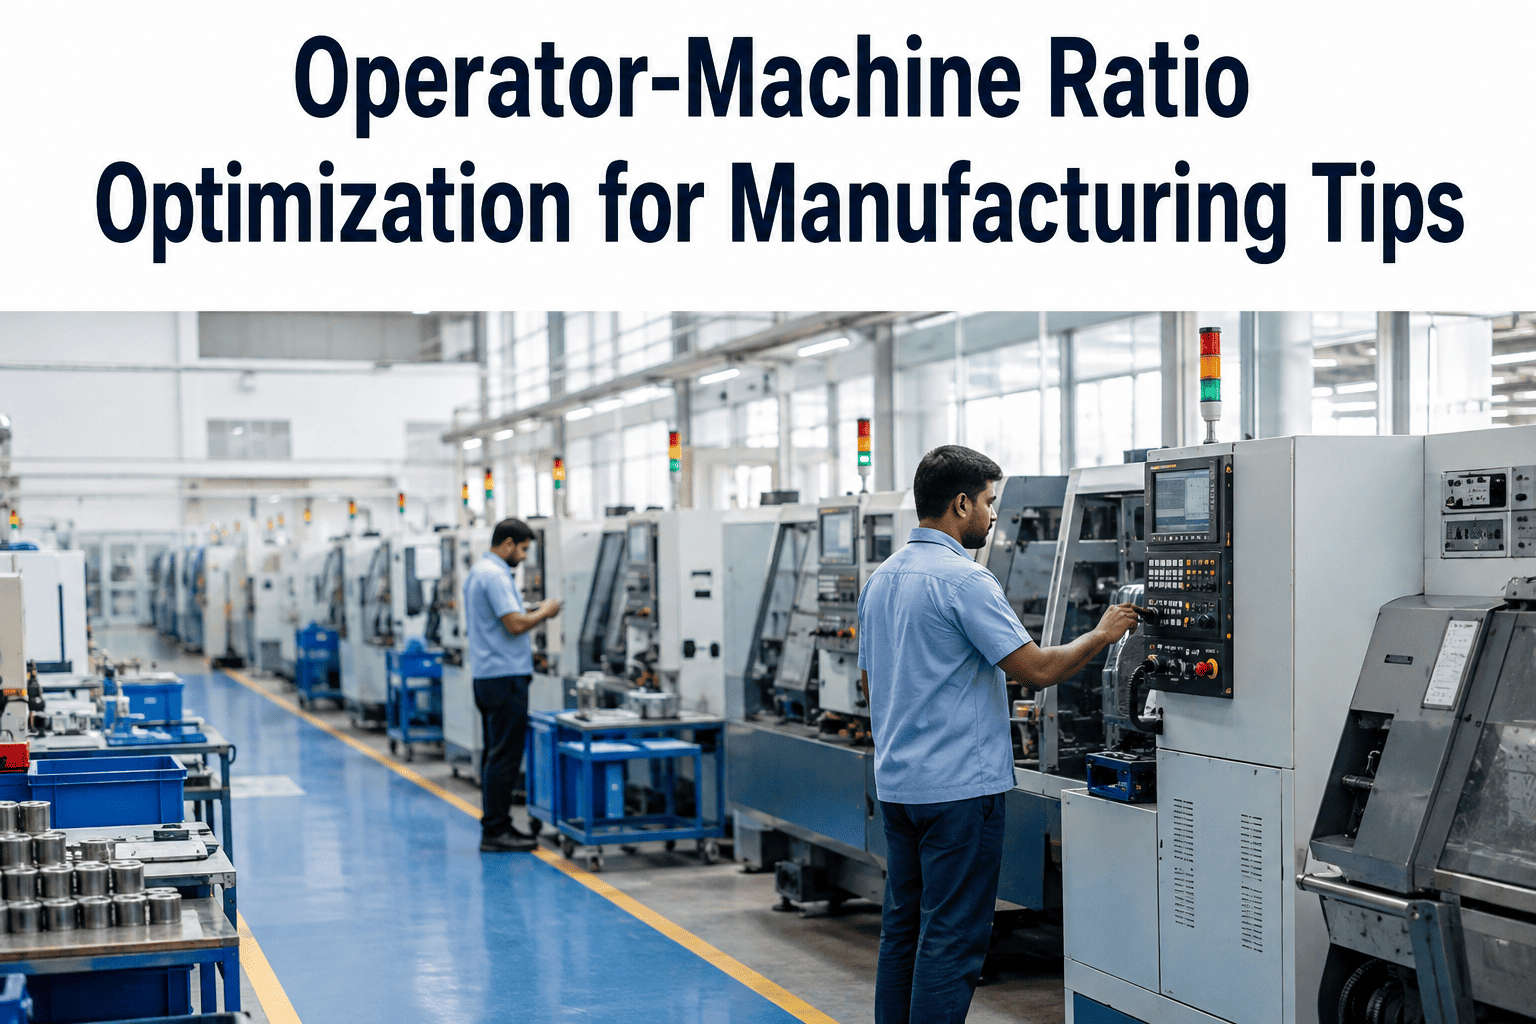
Most staffing plans on the plant floor are still built on instinct rather than data — one operator per machine because that is how the line has always run, even when half those machines sit idle waiting for material or finish a cycle in a third of the time the schedule assumes. The result is a workforce that is simultaneously overstretched on the bottleneck stations and underused everywhere else, and nobody notices until the labor line on the P&L stops making sense against the output number. iFactory's AI-driven operator-machine ratio engine reads actual cycle times, changeover patterns, and skill data to tell you exactly how many machines one operator can safely run, and you can book a demo to see your own floor modeled this way.
You Are Staffing for the Machine That Never Stops — Not the Nine That Do
iFactory's AI calculates the real operator-to-machine ratio your floor can support, station by station, shift by shift, so you stop overstaffing quiet lines and understaffing the ones that actually need attention.
Fixed Ratios Quietly Inflate Labor Cost While Machines Sit Idle Between Cycles
Manufacturers rarely set operator-machine ratios through analysis; they inherit them from whatever staffing pattern existed when the line was installed, and the pattern survives long after cycle times, automation levels, and product mix have all changed. The numbers below reflect how much slack typically exists in a fixed-ratio staffing model once actual machine utilization is measured against headcount.
Four Variables Decide How Many Machines One Operator Can Actually Run
A safe and productive operator-machine ratio is not a single number you can copy from a benchmark report — it depends on the specific mix of cycle time, task complexity, and layout on your floor. iFactory's AI weighs each of these variables continuously rather than locking in a ratio once and leaving it unchanged for years.
The longer a machine's automatic cycle runs unattended, the more machines a single operator can rotate through before the first one finishes and needs reloading. iFactory tracks actual cycle time per part number rather than a nominal spec sheet figure, because real cycle time drifts with tooling wear, material variation, and machine condition.
Ratios that look mathematically sound on paper often fail on the floor because the operator physically cannot reach every assigned machine before the next one finishes cycling. The AI factors real walk paths and layout distance into the ratio recommendation, not straight-line distance from a floor plan.
A machine that only needs a part swap supports a very different ratio than one requiring in-process inspection, adjustment, or documentation at every cycle. iFactory classifies task complexity per station using historical time-and-motion data rather than a single generic assumption applied across the whole line.
Operators can run more machines when the machines share similar controls, tooling, and quality checks, because less mental context-switching is required between stations. The AI groups machines by skill and task overlap when recommending which specific stations should be paired under one operator.
A Ratio Built From Real Cycle Data Beats One Copied From Last Year's Headcount Sheet
iFactory models your actual floor, not an industry average, so the ratio recommendation reflects your machines, your layout, and your product mix. Book a demo and bring your own cycle time data to the call.
From Time-and-Motion Data to a Validated Staffing Plan
iFactory does not hand you a single static ratio and walk away. The engine runs as a continuous loop so that staffing recommendations move with your product mix and equipment changes rather than going stale the moment conditions shift.
Capture Real Cycle and Task Data
Machine controllers, MES time stamps, and operator task logs are pulled together to build an accurate picture of cycle time, task duration, and walk distance across every station on the line.
Model Candidate Ratios
The AI simulates multiple staffing configurations against the captured data, checking each candidate ratio for machine starvation risk, operator overload, and quality task coverage before it is proposed.
Validate Against Safety and Skill Constraints
Every proposed ratio is checked against certified skill requirements and safety zone rules, so a recommendation never assumes an operator can run machines they are not qualified or positioned to run.
Deploy, Monitor, and Rebalance
The recommended ratio moves to the floor with a monitoring window, and the system continues watching actual throughput and idle time so the ratio is automatically flagged for adjustment when conditions change.
Fixed Operator Assignment vs AI-Optimized Multi-Machine Staffing
The comparison below sets out the practical differences between the fixed-ratio model most plants still run on and an AI-optimized approach that adjusts assignment based on live cycle and demand data.
| Dimension | Fixed 1:1 Assignment | iFactory AI-Optimized Ratio |
|---|---|---|
| Basis for Ratio | Historical convention or rule of thumb | Live cycle time, task, and layout data |
| Response to Product Mix Change | Manual review, often months later | Continuous recalculation as mix shifts |
| Idle Operator Time | Frequently 30 percent or higher | Reduced through validated multi-machine pairing |
| Skill Matching | Generic assignment by shift roster | Matched to certified skill and task overlap |
| Overload Risk | Unmonitored until a quality or safety incident | Modeled and flagged before deployment |
What Plants Report After Moving to AI-Optimized Ratios
The figures below are drawn from facilities that moved from a fixed operator-machine assignment model to an AI-recommended ratio, tracked over a minimum three-month period following the change.
How a Ratio Optimization Program Rolls Out on Your Floor
Ratio changes affect people directly, so iFactory's deployment model is built around validation and gradual rollout rather than a single sweeping headcount change announced overnight.
Baseline Time Study
Cycle time, task duration, and walk paths are captured across target lines to build an evidence base before any ratio change is proposed.
Pilot on One Line
A single line or cell tests the recommended ratio under supervision, with throughput and quality tracked against the current baseline.
Skill and Safety Sign-Off
Operations and safety teams review the proposed pairing against certification requirements before it moves beyond the pilot.
Facility-Wide Rebalance
Validated ratios extend across additional lines, with the AI continuing to monitor and flag any station where conditions have shifted.
Questions Operations Leaders Ask About AI-Driven Ratio Optimization
Stop Guessing at Staffing Ratios and Start Modeling Them
iFactory's AI builds a validated operator-machine ratio from your own cycle time and layout data, then keeps watching so the ratio stays right as your product mix changes. Book a demo and bring one line's worth of data to test it live.