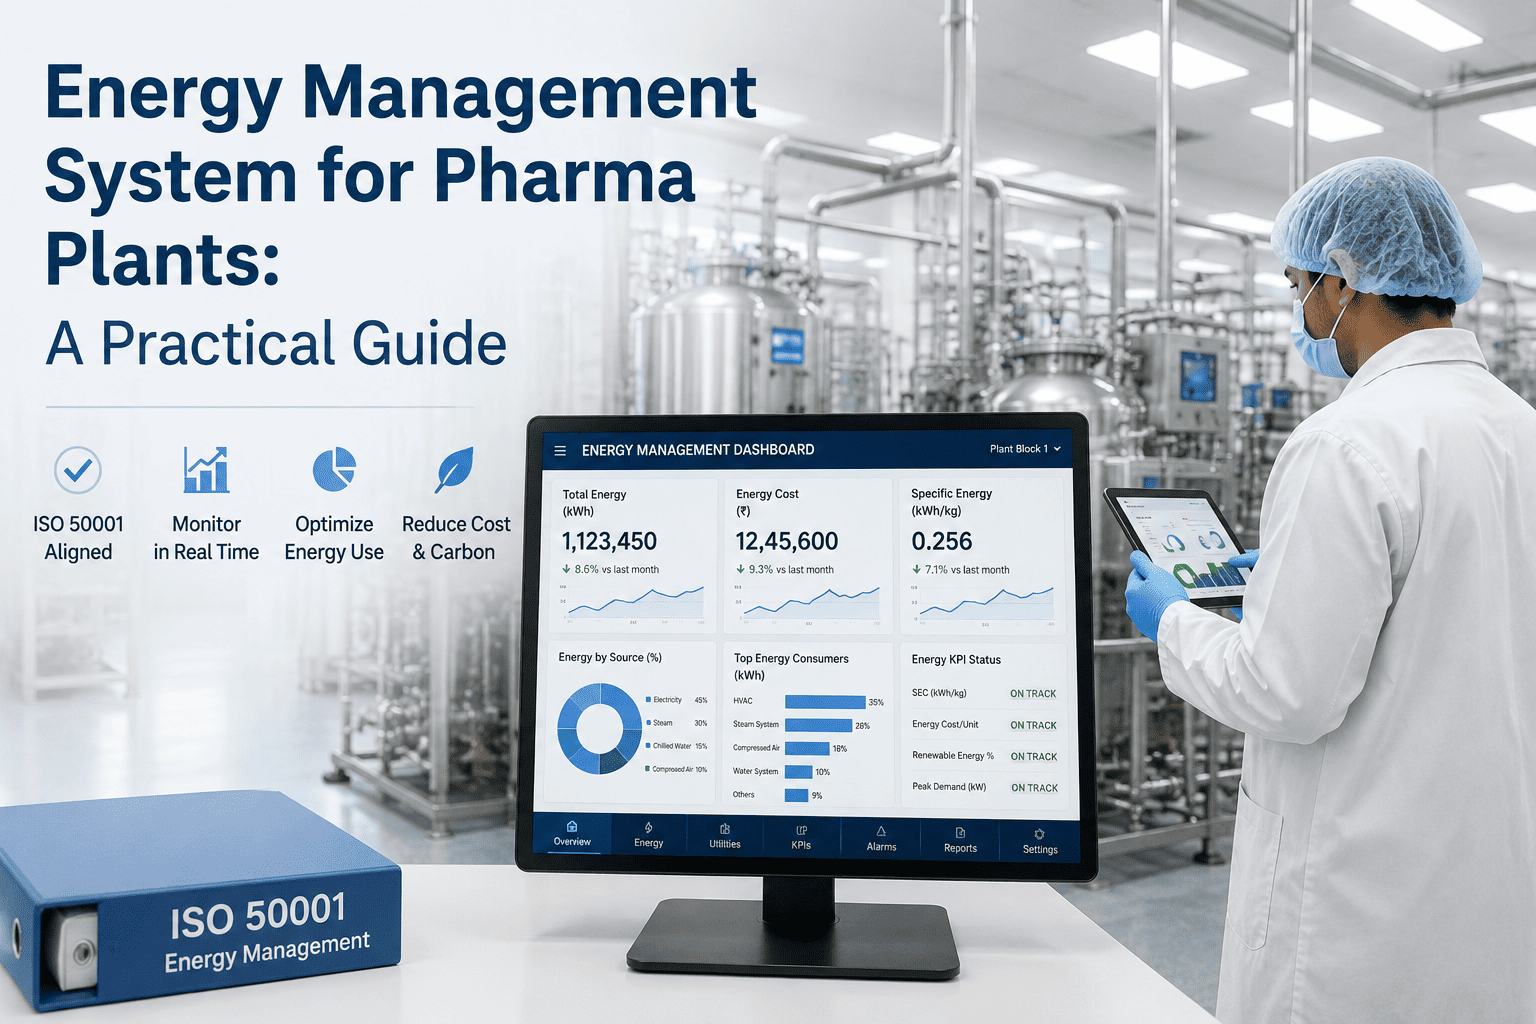
Energy Management System for Pharma Plants: A Practical Guide
By James C on June 15, 2026
A pharmaceutical plant's energy bill doesn't come from the production process most people picture — it comes from the air. Cleanrooms can consume up to fifteen times more energy than a comparable commercial building, and more than half of a plant's electricity goes to HVAC alone, driven by the high air-change rates that GMP demands. Add steam, compressed air, and purified water, and the four utility systems quietly dominate the meter while the energy team manages them off a monthly invoice that can't say which system is bleeding. An energy management system fixes the visibility first: submeter the significant energy uses, set a baseline, track performance indicators against it, and act before drift becomes cost. iFactory's EnMS aligns to ISO 50001 across HVAC, steam, water, and compressed air — real-time submetering and what-if modeling on a turnkey on-premise NVIDIA stack, inside your firewall.
iFactory EnMS · Pharmaceutical
Energy Management for Pharma, Built Around ISO 50001.
Submeter the four utilities that dominate the bill — HVAC, steam, water, compressed air — set an energy baseline, track EnPIs against it, and model what-if scenarios before you touch a setpoint. On a turnkey on-premise NVIDIA stack, GMP-safe inside your firewall.
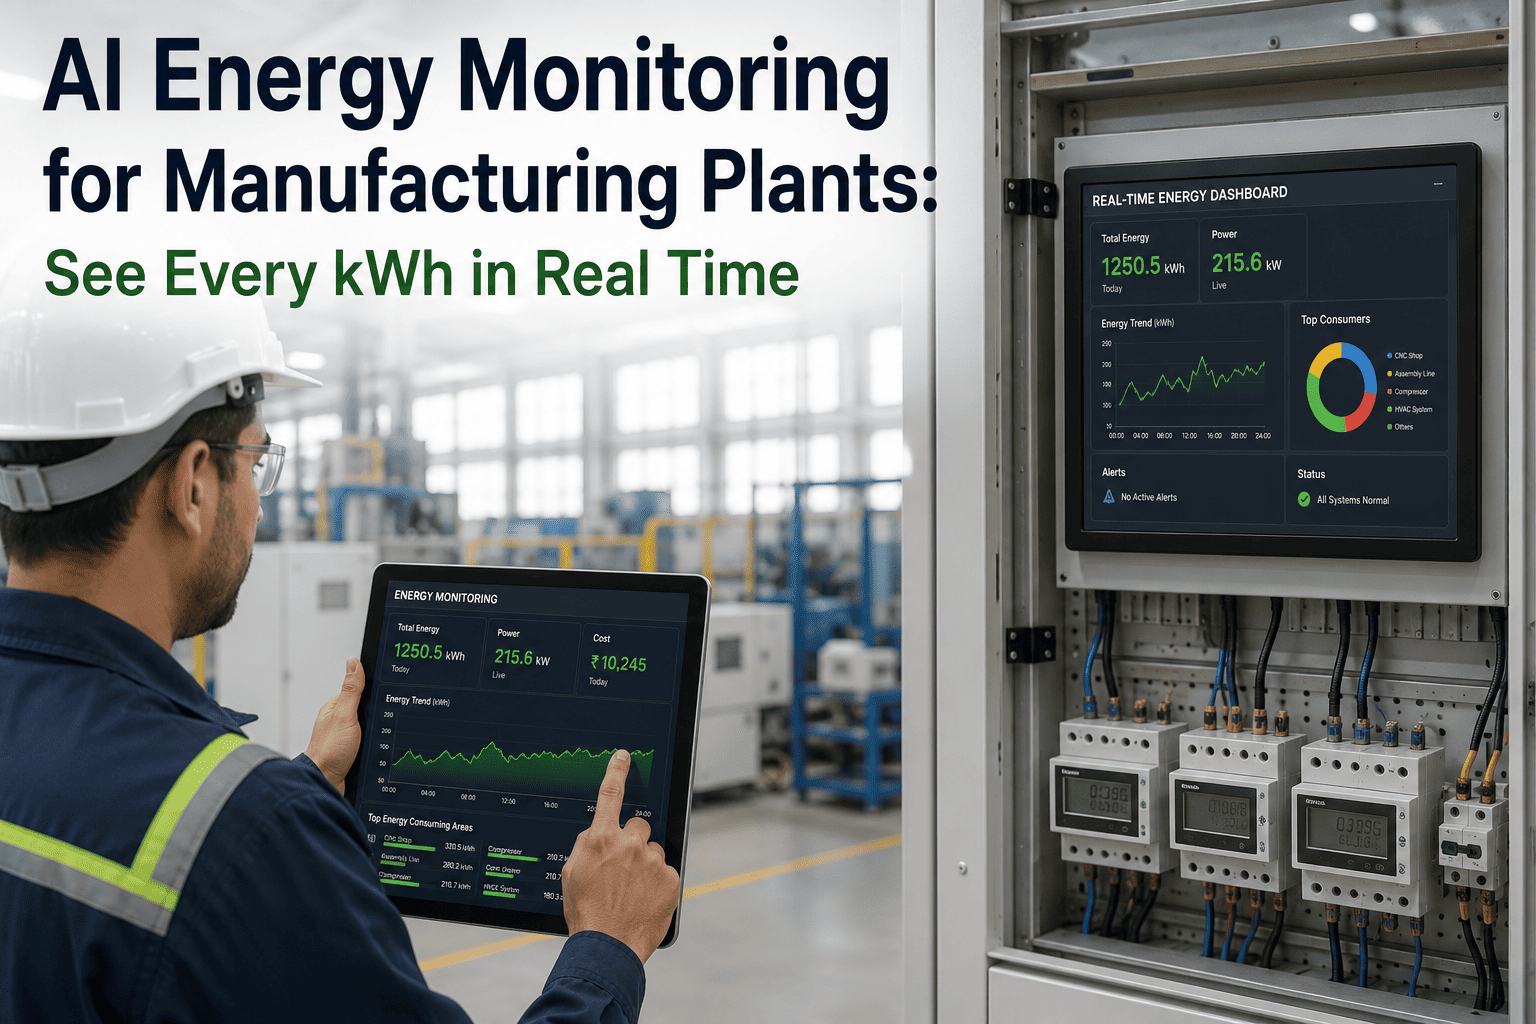
You cannot manage what the invoice hides. A monthly bill shows total consumption per site and tells you nothing about which system is driving it. In a typical pharma plant, HVAC and the boiler-and-steam loop together account for the lion's share — one case study put HVAC plus steam and hot-water boilers at 78% of total energy. The EnMS starts by submetering each load so the share is visible, because the first improvement is always knowing where to look.
HVAC / cleanroom
~50%+
Steam & boilers
~25%
Compressed air
~10%
Purified water
~8%
Process & other
~7%
Illustrative share — actual split varies by site, product, and climate. The point is that two systems usually own most of the bill, and the EnMS measures the real split for your plant rather than assuming this one.
Don't know your real split? Get a turnkey AI quote and we'll submeter your significant energy uses and show the actual breakdown in the pilot.
The Four Utilities, Each as a Significant Energy Use
ISO 50001 calls the big loads significant energy uses — the systems that account for substantial consumption or offer the most improvement potential. Each pharma utility becomes an SEU with its own performance indicator, baseline, and operational controls. Here is what the EnMS watches and where the savings hide in each.
HVAC & Cleanroom
The biggest load by far. High air-change rates set for worst-case occupancy run flat out around the clock.
Lever: unoccupied-mode air-change setback, justified by continuous EM data under Annex 1, can cut HVAC energy substantially.
Steam & Boilers
Heats large volumes for sterilization, CIP, and process. Distribution losses and trap failures bleed energy invisibly.
Lever: trap monitoring, condensate recovery, and load-matched firing against the baseline.
Compressed Air
Powers process and supports HVAC and clean utilities. Leaks and oversized, fixed-speed compressors waste a large fraction.
Lever: leak detection, pressure optimization, and variable-speed control matched to real demand.
Purified Water
WFI and PW generation and the hot loops that keep them compliant run continuously, pumping and heating around the clock.
Lever: loop-temperature and recirculation optimization without breaching microbial control.
The ISO 50001 Loop, Running Live
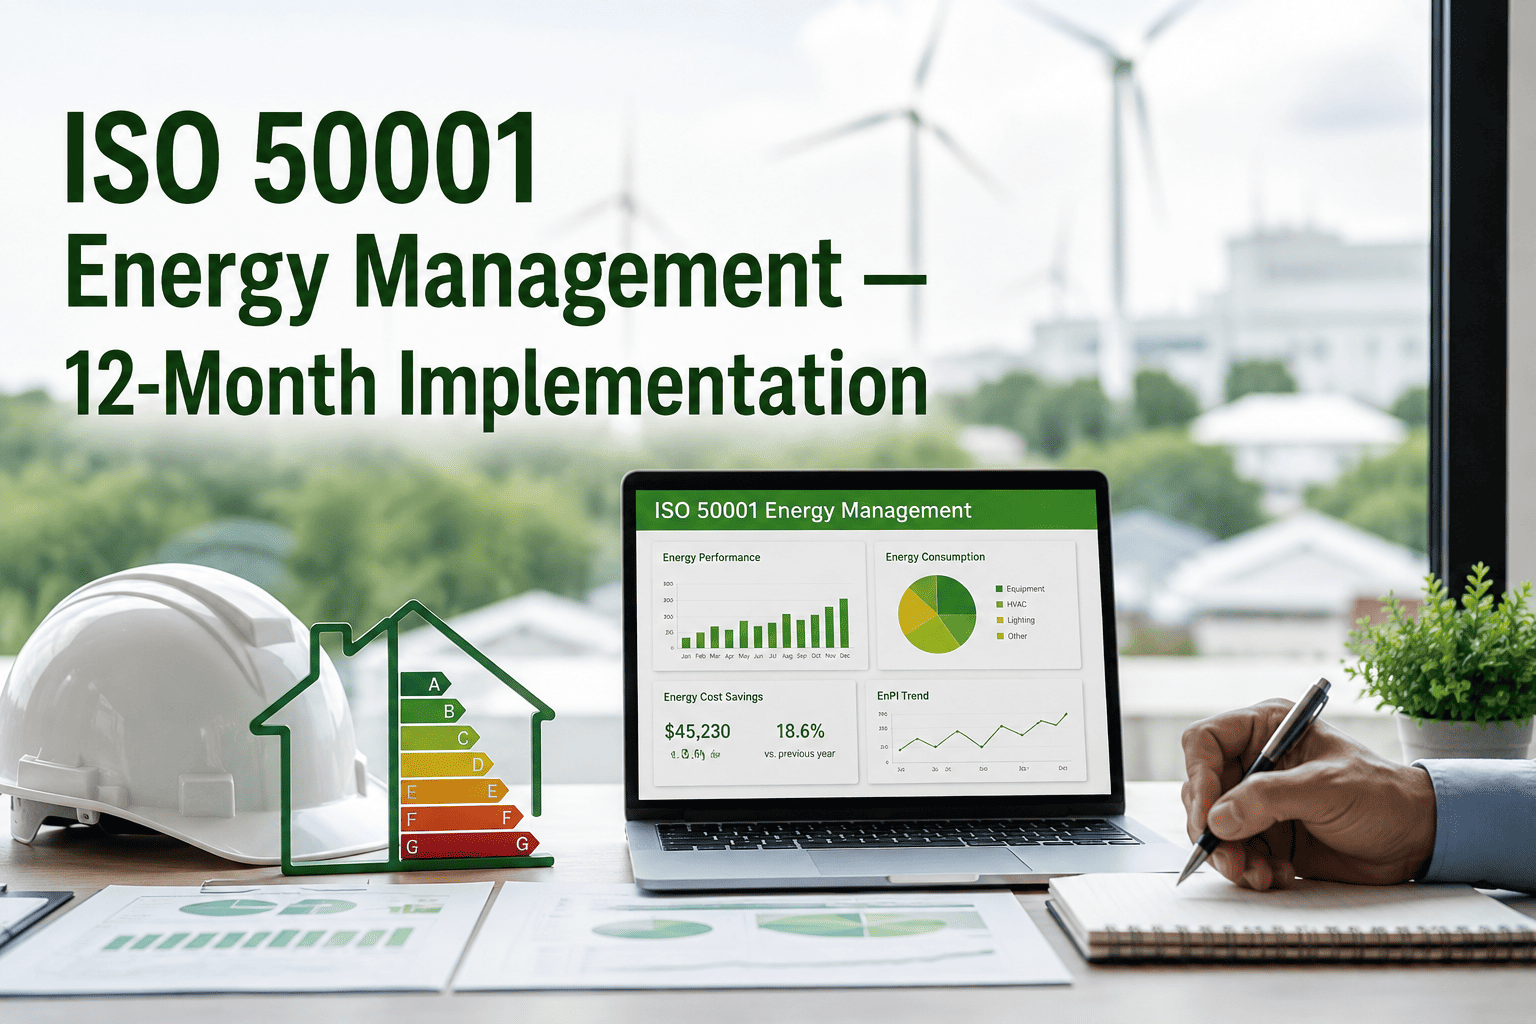
ISO 50001 is a plan-do-check-act management system, not a one-time audit. Its backbone is four linked clauses: an energy review identifies the SEUs, an energy baseline fixes the reference period, EnPIs track performance against that baseline, and operational control plus management review drive continual improvement. The EnMS runs this loop on live data instead of an annual spreadsheet, so the cycle turns continuously rather than once a year.
Plan
Energy Review & SEUs
Submetered time-series data segments consumption by system and identifies the significant energy uses worth managing.
Do
Baseline & EnPIs
A reference period fixes the energy baseline; each SEU gets an EnPI, normalized for relevant variables like production and weather.
Check
Monitor vs Baseline
EnPIs are compared to the baseline continuously; significant deviations trigger an alert instead of a month-end surprise.
Act
Control & Improve
Operational controls and verified savings projects feed management review, and the improved performance resets the next cycle.
Auditors scrutinize baseline adjustments closely, because a quietly re-based number can make performance look better than it is. Live, traceable data makes every EnPI and baseline defensible at a surveillance audit — no shadow spreadsheets.
EnPI vs Baseline: The Number That Proves Savings
The whole point of an EnMS is demonstrating that energy performance actually improved — and that means an EnPI tracked against a fixed baseline, normalized so a busy production month doesn't masquerade as waste. The chart shows the mechanism: the baseline holds as the reference line, actual normalized consumption trends below it after the improvement actions land, and the gap is the verified saving an auditor and a CFO both accept.
Energy baseline (EnB) — fixed reference
Actual normalized consumption (EnPI)
The fork at the marker is where an improvement action — say, unoccupied air-change setback — takes effect. Everything below the baseline after that point is verified, normalized saving, not a billing artifact.
Want savings you can prove at audit? Start a 6-week pilot and we'll build a normalized baseline on one SEU from your historian.
What-If Before You Touch a Setpoint
The riskiest words in a GMP plant are "let's just lower it and see." The EnMS models the energy and the constraint together, so the energy team can test a change against compliance limits before it goes live — what does dropping unoccupied air changes do to recovery time and to the bill, what does a steam-pressure trim do to sterilization. The model answers on paper first; the plant stays compliant.
Lower unoccupied air changes?
Models HVAC kWh saved against cleanroom recovery time and EM limits, so the setback holds the sterility state Annex 1 requires.
Trim steam header pressure?
Projects boiler fuel saved versus the temperature and time needed for sterilization and CIP cycles to still pass.
Cut compressor setpoint?
Estimates kWh saved per psi against the minimum pressure every point of use actually needs, leaks included.
Adjust PW loop temperature?
Weighs pumping and heating energy against microbial-control margin on the purified-water loop.
Ask the Copilot
The EnMS answers plain language too — for the energy manager chasing a spike or the operations head sizing a savings idea before committing.
Plant Copilot — EnMS
Energy Manager
Site kWh is up 9% this month but production is flat. Where is it going?
Copilot
It's almost all HVAC, and it's not production-driven. AHU-3 and AHU-5 serving the Block C cleanrooms have been running full air changes 24/7 since the unoccupied-setback schedule was disabled on the 4th — that alone explains about 7 of the 9 points against your normalized baseline. The remaining 2 points trace to a compressed-air pressure creep on Compressor 2. Neither is a process need; both are recoverable.
Energy Manager
If we re-enable the Block C setback, what do we save and is it compliant?
Copilot
The what-if model puts the setback at roughly 6% of site electricity recovered, worth the bulk of this month's overage. EM data for Block C shows the zones hold their grade with margin during unoccupied hours, and modeled cleanroom recovery stays inside your Annex 1 limit. I can stage it as a controlled change with the recovery-time verification attached for QA sign-off.
Turnkey: Hardware, Software, Live in 6-12 Weeks
iFactory ships a pre-configured NVIDIA AI server — racked, software pre-loaded. Rack it, plug in power and Ethernet, and the EnMS is live inside your firewall. The engagement covers submeter and sensor integration, BMS/SCADA and historian connection over Modbus, OPC-UA, and MQTT, baseline and EnPI setup, what-if model configuration, operator training, and 24×7 remote monitoring. Your existing BMS and utility controls are inputs, not migration targets.
Phase 1 · Weeks 1-4
Ship & Meter
Edge server on-prem; submeters and BMS/SCADA connected. Energy review run on the four utility SEUs.
Phase 2 · Weeks 5-8
Baseline & Model
Normalized baselines and EnPIs set per SEU; what-if models built and validated against historian data in shadow.
Phase 3 · Weeks 9-12
Control & Go Live
Live dashboards, deviation alerts, and verified savings tracking, operator training, 24×7 monitoring at 99.9% uptime.
1000+
clients running iFactory
99.9%
platform uptime
6-12 wks
to live operation
On-prem
inside your firewall
What the Energy Team Gets
Submetered visibility into the loads that own the bill, an ISO 50001 baseline-and-EnPI structure that holds up at audit, what-if modeling that keeps changes compliant, and a continual-improvement loop that runs on live data instead of a once-a-year review.
Visible
Real load split
submetered SEUs, not a blind invoice
Audit-ready
Baseline & EnPIs
traceable, normalized, defensible
Safe
What-if first
model the change against GMP limits
Air-gapped
On-prem deployment
energy and process data stay on-site
Frequently Asked Questions
Why is HVAC such a large share of a pharma plant's energy?
GMP cleanrooms require high air-change rates to control airborne contamination, so the air-handling systems run hard around the clock. Pharmaceutical cleanrooms can use up to fifteen times the energy of a comparable commercial building, with HVAC typically accounting for more than half of plant electricity. That's why it's the first significant energy use the EnMS targets.
What are SEUs, EnB, and EnPIs in plain terms?
SEUs are the significant energy uses — the systems that dominate consumption or offer the most savings, like HVAC and steam. The EnB is the energy baseline, a fixed reference period you measure against. EnPIs are the performance indicators tracked relative to that baseline. Together they form the measurement backbone ISO 50001 requires before a certification audit.
Can we cut HVAC energy without breaching GMP?
Yes, with evidence. The revised EU GMP Annex 1 requires continuous environmental monitoring, which gives you the empirical data to justify reducing air-change rates during unoccupied hours while proving the zone holds its grade. The EnMS models the setback against recovery time and EM limits first, so the saving is taken safely rather than guessed at.
Does it replace our existing BMS?
No. The EnMS sits above your building management and utility control systems, reading submeters, BMS, SCADA, and historian over Modbus, OPC-UA, and MQTT. It adds the energy review, baseline, EnPI tracking, and what-if modeling layer — your existing controls remain the system of record for operation.
Where does our energy data live?
Entirely on-premise inside your firewall on the pre-configured NVIDIA server — read-only and inbound-only to connected systems. Energy, baseline, and process data never leave the plant, with 24×7 remote monitoring and 99.9% uptime. The deployment can be fully air-gapped where required.
ISO 50001-Aligned. Four Utilities. What-If Safe. On-Prem.
See Your Plant's Real Energy Picture
Bring one site and a few months of utility data. We'll submeter the four SEUs, build a normalized baseline and EnPIs, model an unoccupied-setback what-if against your Annex 1 limits, and show the verified saving — then scope the 6-to-12-week turnkey deployment, on-prem, inside your firewall.